Performing network analysis in a wastewater system is a critical activity periodically performed by engineers to perform sewer capacity analysis, evaluate the impacts of new construction on existing infrastructure, as well as simulating the effects of wet weather events on the overall system. While all these activities are performed by highly trained individuals using very specialized software, the pipe and elevation data that drives all this analysis is often stored and maintained in the GIS.
This article is the second in a series where we explore how the ArcGIS Utility Network can be used as a modern network management solution to help track, maintain, and analyze wastewater infrastructure. These articles are intended to not only demonstrate these topics, but also to contextualize the industry-agnostic terminology used by the utility network so you can better navigate discussions within the utility network community as well as the online help.
In the previous article, we showed how the utility network organizes data using a series of well-defined data models. We also showed how these data models include a rule base that is used to guide quality assurance which allows you to ensure that the connectivity represented in your database is accurate.
In this article we will demonstrate how you can take this validation to the next level and ensure that not only the individual features are connected correctly, but that your data represents a valid network where all features can be proven to be participating in a wastewater management system. The model and data in this article are based on the Sewer Utility Network Foundation from the ArcGIS Solutions site.
Tiers
So, how does the utility network determine which direction materials flow through pipes on their way to a treatment plant? Like many other aspects of the utility network, this is a question that is answered by providing a configurable framework that allows each industry to answer this question using their own rules; because what works for an electrical network won’t necessarily work for a wastewater network.
The first step is to look at how the sample wastewater domain network is configured.
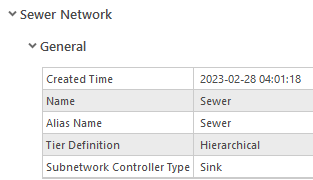
Every network has both sources (inputs) and sinks (outputs) and these points are used to determine the direction of flow within the network, however most systems only require you to define either the sources or the sinks. While the flow in a sewer network could be modeled by establishing all the sources in your network, it is typically handled by setting treatment plants as sinks. This allows upstream traces to identify all the sources for that area, and a downstream trace to identify the path wastewater will take to the treatment plant.
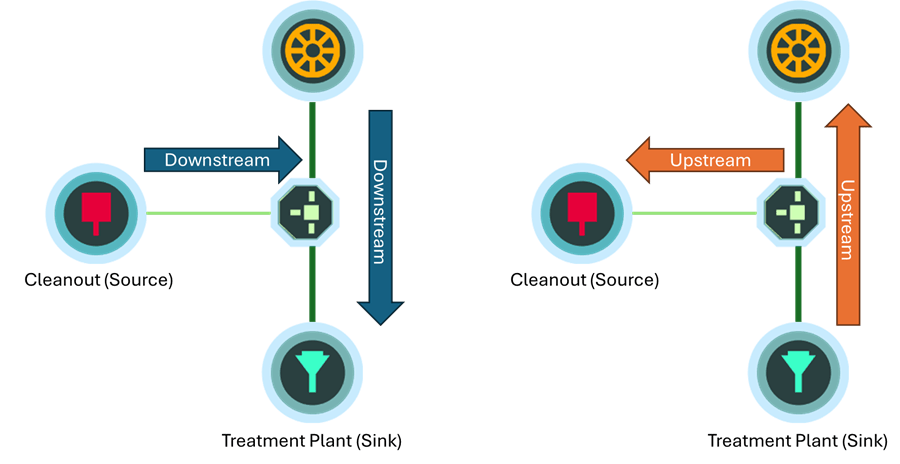
The decision to configure the wastewater domain to use sink-based subnetwork controllers is one of both convenience and correctness.
It is convenient to model the wastewater treatment plants as sinks because there are relatively few of them, and the accuracy of their information is quite high. There are significantly more sources in a wastewater network, but because this data is not always accurate or complete within the GIS it is not suitable for analysis. Finally, consider that water can naturally infiltrate a wastewater system through leaks in manholes and pipes, so even if you modeled all the known sources of water inlets for your system you still wouldn’t be ablet to capture all the water infiltration. By setting the wastewater treatment plant as a subnetwork controller you can capture downstream flow to the treatment plant, and any upstream traces will capture the inflow and infiltration upstream of that location.
Now that you see why wastewater treatment plants are treated like sinks in the network, how does the system account for the flow changes caused by pumps and lift stations? How does the system know that the area managed by a lift station is always a subset of the area managed by a wastewater treatment plant? How can we account for subbasins within the sewer collection system?
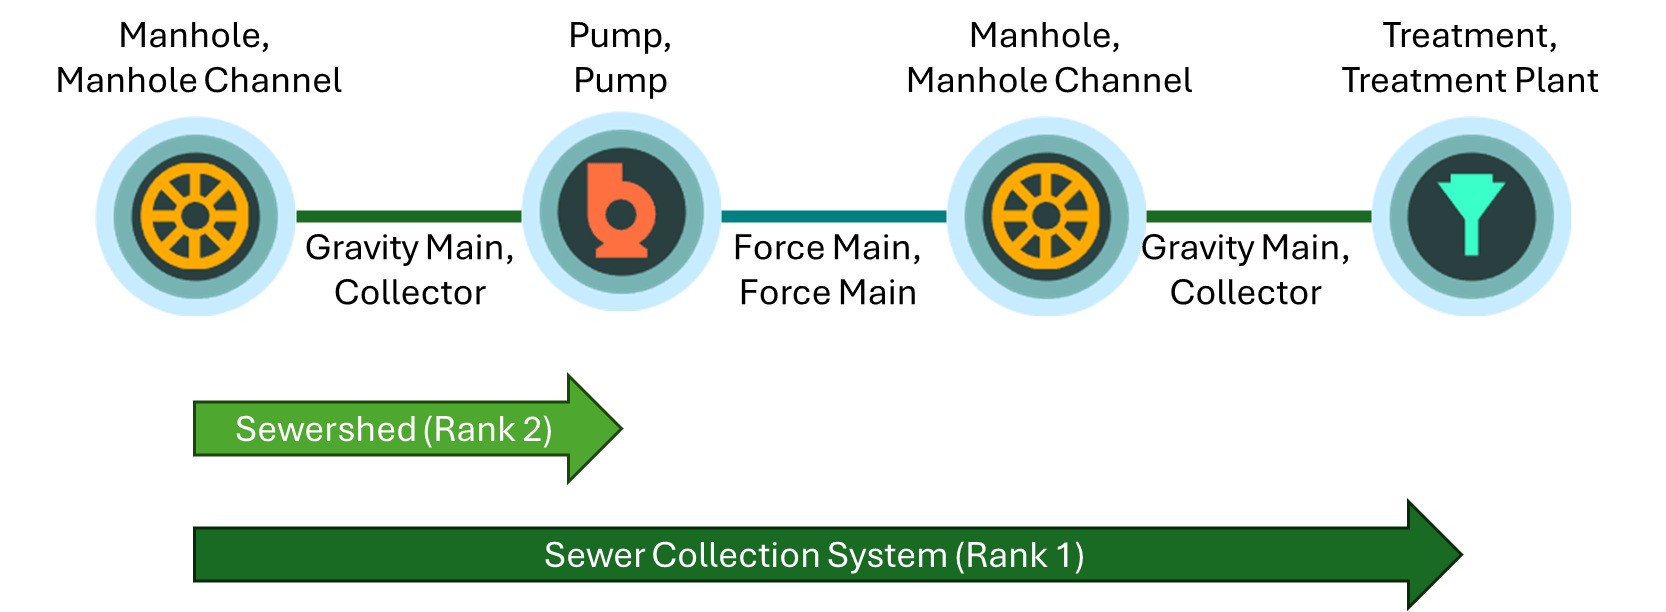
The answer is that a utility network can have multiple definitions of systems, known as tiers, with each tier having a different rank within our network that determines whether it is the ultimate source/sink (rank 1) or is a lesser area (rank > 1) within the network.

Because Sewersheds are rank 2 and the sewer model is a sink-based network, that means that they are considered upstream of any Sewer Collection Systems. In use, this can be modeled by creating the Sewer Collection System to model each basin within your network while the Sewershed areas represent the subbasins. It’s also worth noting that not everything that belongs to a Sewer Collection System must belong to a Sewershed, but everything that belongs to a Sewershed should also belong to a Sewer Collection System.
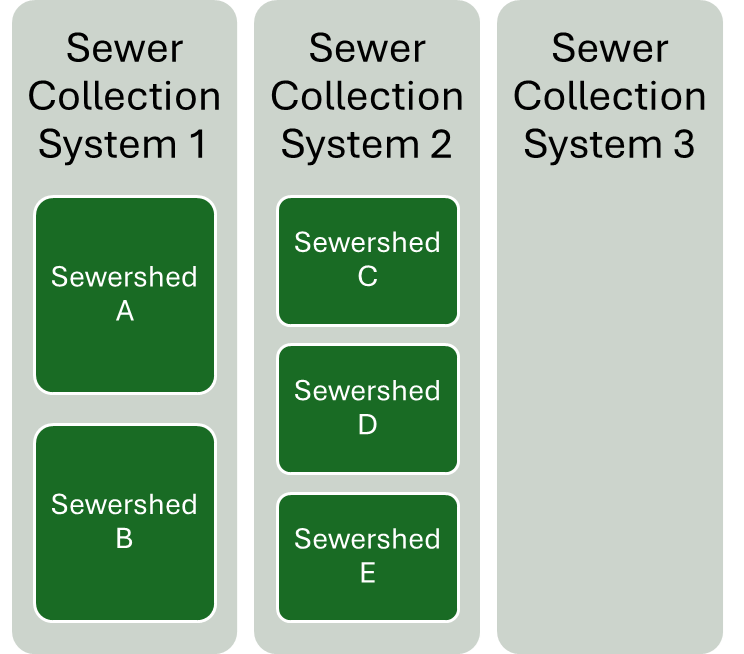
Another important benefit of tiers is that each tier allows you to define separate configurations for tracing along with which types of features are allowed to control and participate in each tier. In the wastewater domain these tiers typically correspond to basins / wastewater treatment plants (sewer collection system) and to the subbasins within each sewer collection system (sewershed area).
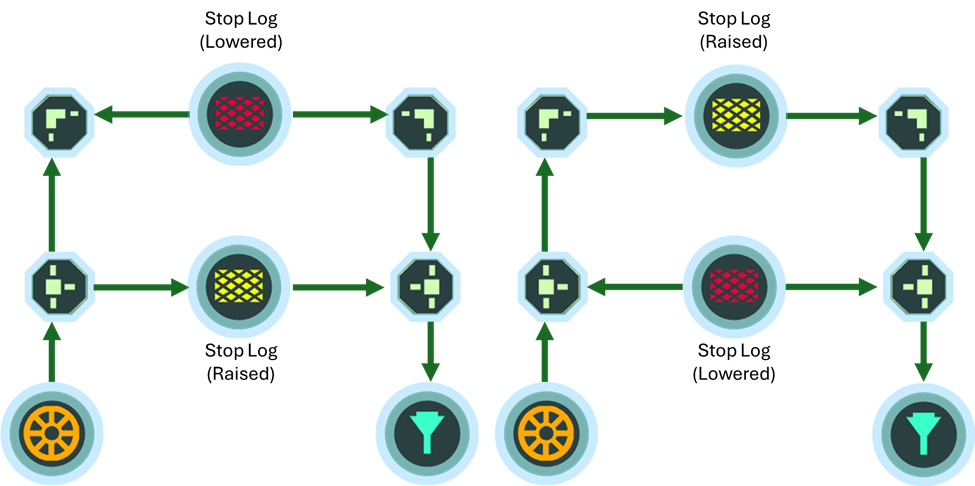
Each tier allows you to define the default behavior of tracing one of these areas by specifying a trace configuration. In a wastewater system this is typically set to exclude proposed features, exclude areas of the network that are only active during a wet weather event, or stop at any closed device (gate, stop log, etc.). In the example below you can see how a raising (open) and lowering (closed) a stop log in a manhole affects the flow of gravity mains within a subnetwork
Subnetworks
Up until this point we’ve been referring to these connected areas of your network as systems or tiers within the utility network. Unsurprisingly, the utility network has its own special language for describing these systems. Each specific area managed by a controller represents a subset of your entire utility network, so the utility network refers to this as a subnetwork. By extension, the device or devices that act as the controllers (sources and sinks) for this subnetwork are referred to as subnetwork controllers. Finally, the collection of rules on each tier that define how a subnetwork behaves are known as the tier’s subnetwork definition.

Given the two definitions we discussed for sewer subnetworks, sewer collection system and sewershed area, this raises an interesting question: If a feature belongs to a sewershed area, doesn’t it also belong to a sewer collection system?
Yes, and this is especially true if your subnetworks correspond to the basins and subbasins of your network. Because everything that belongs to the subbasin also belongs to the parent basin, it would make sense that the utility network would need to support the ability for features to participate in multiple subnetworks. So how does the utility network achieve this? What constraints does it place on membership in multiple subnetworks? And most importantly what is the language used to describe these ideas?
Partitioned vs Hierarchical Network
The utility network does allow a feature to belong to multiple subnetworks, but only allows a feature to belong to a single subnetwork per-tier (unless it is acting as a barrier between subnetworks).
As an example: a cleanout can be located upstream of both a lift station and a water treatment plant, but if there are multiple lift stations downstream of the cleanout then it will only be considered part of the subnetwork of the nearest lift station.

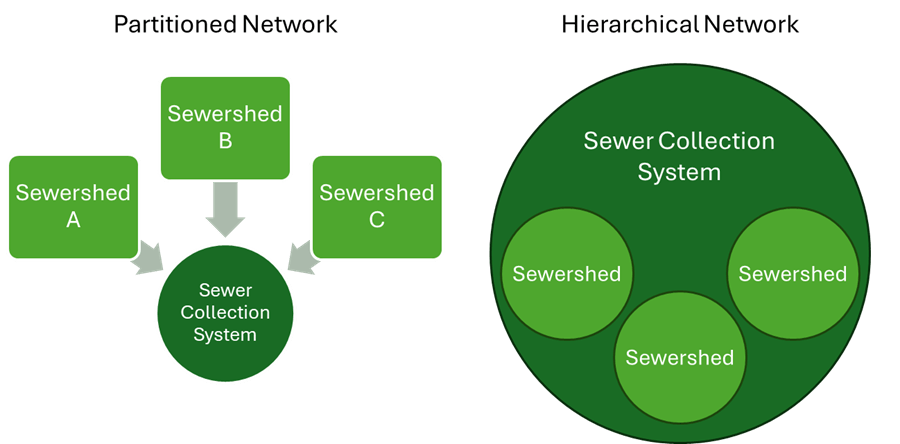
But what if you want your features to belong to multiple tiers? This is handled through the configuration of the tier definition for the domain network. In a partitioned network a feature can only belong to a single tier, and in a hierarchical network a feature can belong to multiple tiers. In the case of the sewer model the domain is configured to be hierarchical because it is important to know the sewer collection system for a feature, even if it belongs to a sewershed area.
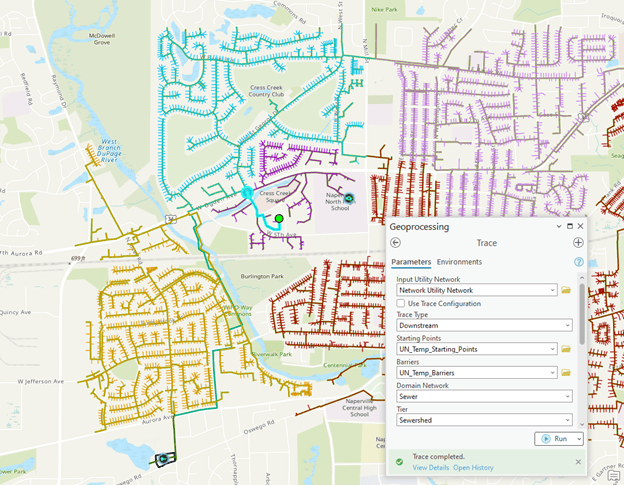
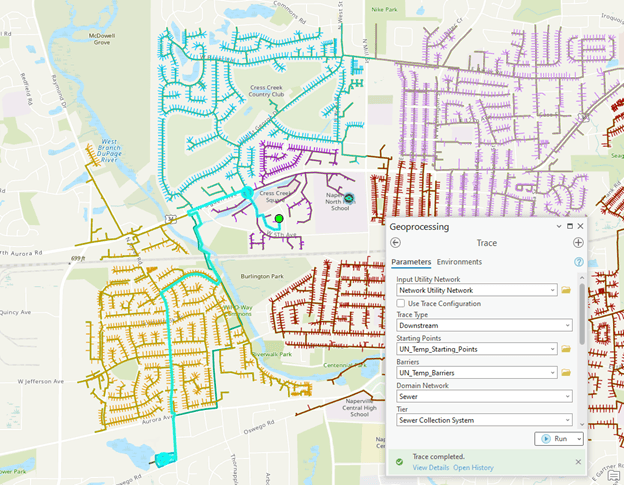
When running traces in the utility network you can select which tier of the utility network you wish to analyze. This is an important parameter to consider in a hierarchical network since it can be the difference between analyzing the contents of a small lift station or the contents of an entire city!
Conclusion
Now that you’ve made it through this article, you should have a good understanding of the key concepts and terminology of the utility network. If you want to continue your journey at a high level, I recommend you read the related articles found below. If you’re ready to dig into the detail at a more technical level, I recommend you check out the Learn ArcGIS Utility Network for Water Utilities or Learn ArcGIS Utility Network for Sewer and Stormwater learning series. If you want to download the model and sample data from this article, check out the Sewer Utility Network Foundation solution on the ArcGIS Solutions page.
You can also try these hands-on tutorials related to this article:


Commenting is not enabled for this article.