In my former life at Alabama Power Company, I used to have a manager who would give me requirements like the Ronco Man’s signature line. “But wait! There’s more!” The ArcGIS Utility Network is much the same. The more I dive into the core features of the product, the more apparent its capabilities become.
It has been amazing to see the interest of the partner and user community that have helped drive this project. Functionality such as the utility network, attribute rules, the service based multiuser editing model (branch versioning), and many other components are a direct result of Esri responding to the needs of the utility sector.
The ArcGIS Utility Network provides a comprehensive solution for managing utility networks. In our most recent release of the ArcGIS Utility Network with ArcGIS Pro 2.5 and ArcGIS Enterprise 10.8, we continue to build upon the framework designed through partner and user community engagement. Core tools within the Utility Network toolbox can be used to create and configure the utility network. For automation purposes, the ArcGIS Solutions team makes the Utility Network Package Tools available with asset packages for electric, gas, and water domains.
I’d like to share Esri’s vision for the ArcGIS Utility Network and offer an overview of the functionality it brings to the table. Esri’s utility network vision has four main concepts:
• Leverage the Esri platform
• Accurately model real-world assets
• Provide dynamic visualization
• Provide advanced editing and tracing
Leverage the Esri platform
You can visualize, analyze, and edit the utility network across the entire Esri platform using a service-based architecture that is available on any device or web application or leverage the full analytic capabilities of the utility network in file geodatabase for prototyping and testing in ArcGIS Pro. Your GIS team can model and edit in the ArcGIS Pro client; while a wide range of mobile applications can be developed for your inspections and asset tracking. Web solutions can be provided for people who work in the field as well as those who work in the office. Out of the box applications with Collector and Explorer can be used with enhanced capabilities coming in future releases.
But wait! There’s more! All these features deployed on mobile devices can provide content-rich data integrity and collection modules. An excellent example of this is line inspections. Now your inspectors will be geo-empowered with mobile applications during substation inspections. And those inspectors can provide feedback simultaneously for your work plan tracking and asset repair as necessary. Mobile, web, and business intelligence applications configurations can be used in step with the ArcGIS Utility Network.
We have built a robust data design that is better suited for operational intelligence and business intelligence platforms. The new framework is built around Representational State Transfer (REST) based feature services and can provide a more significant return on investment for your Enterprise package. The utility network takes advantage of the branch versioning transactional model that is accessible via REST for deployed services. Equipped with the ArcGIS Utility Network you are positioned to respond to your company’s ever-changing data needs.
It’s also easy to share information securely with those who need it.
This capability is powerful for existing asset inspections such as switches, structure components, and even encroachments. Actual stub poles and even anchors can be captured in field inspections, used in work plans, or in the hectic world of restoration activities. Air patrols for pipelines can capture features that pose a risk to reliability and associate them with maintenance response teams. It’s going to be interesting to see this potential on display during emergency restoration events. Instead of paper maps, digital as-built/designed configurations will be in the hands of your field crews to assist with communication, logistics and overall improved response times.
Accurately model real-world assets
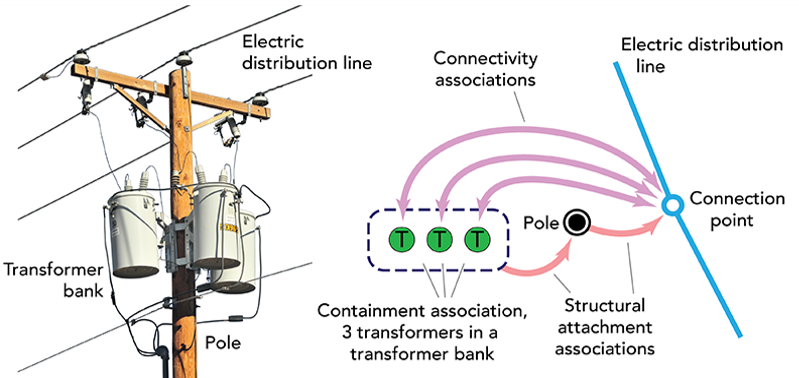
But wait! There’s even more! The utility network accurately models real-world assets. A concept called associations allows connectivity, containment, and structural attachments to be modeled between network features, giving you an accurate representation of what’s on the ground. For the first time, there is a true interconnection between the engineering design of the asset and the operational utilization of the same feature. I have had some frustration in attempting to provide solutions that bridge the gap for years. In my experience, operational models were not suited for asset inspection. And GIS datasets were focused on maintenance work plans and were often updated manually from operational notes. It’s important to note that the ArcGIS Utility Network certainly has a strong operational flavor and associations enable solutions far beyond traditional operations-based GIS products.
Associations allow you to model and view the contents of complex assemblies of devices and lines and manage how assets are connected to them. Connectivity, Containment, and Structural attachment are the three associations modeled in the utility network.
With the connectivity association, you can have point to point connectivity between two devices that are not necessarily geometrically coincident. Flow systems such as gas, water, sewer, and complex valve systems can be visualized and participate in connective tracing.
This is the ‘bread and butter’ of the utility network, due to feature service and data structure optimization. You now have greater control over feature management, participation, and function than ever before. The new ArcGIS Utility Network allows for businesses to model multiple interconnected networks. Not only can you map facilities from source to sink and from transmission to distribution activities; but gas, electric, and water assets can be modeled in a single solution.
Containment associations can help you model the association between devices contained in a structure. Historically, it has been challenging to build GIS solutions for substation or pumphouse maintenance and construction. The density of critical features in a limited space is complicated to represent at a regional scale across service territories.
The container approach takes away the challenge of modeling features in tight spaces and provides performance and scalability. This capability allows you to build simulated environments for complex switching or pumping configurations. You can utilize the utility network to capture feature locations with improved accuracy and provide spatial context during pumphouse and substation inspections. The ability to containerize features also prevents the buildup of map clutter that can reduce the visual impact of your map product.
But wait! There’s more! Structure associations enable features and objects to be associated with physical orientations on the ground. For the first-time, poles can be associated with linear network assets. The Utility Network Management extension allows for the attachment of switches, fuses, transformers, and other connectively based assets. You can correctly model H-frames and three pole configurations down to the pole asset. Associations are going to change the way utility companies track, manage and operate their assets. This is going to be a major opportunity for utilities during storm events when communication is critical between the field and the storm center. This level of data resolution will also allow for effective logistics pipelines for improved restoration times.
Provide dynamic visualization
Have I mentioned how beautiful ArcGIS Pro renders maps? GIS teams have never been so empowered to render beautiful cartographic products due to the 64-bit geoprocessing and rendering capabilities.
The utility network incorporates a mixture of cartography and network modeling for displaying network features. A common problem when mapping utilities is, it’s hard to produce a cartographic representation and still accurately represent the underlying connectivity of the network. The utility network gives users many ways to visualize their network system and assets. Display filters can be used in conjunction with associations to toggle features on or off in the map view for dense areas such as substations within electrical networks. This gives you the flexibility to control the complexity of map contents whether you are creating cartographic maps for different use cases, or inspecting and editing utility features.
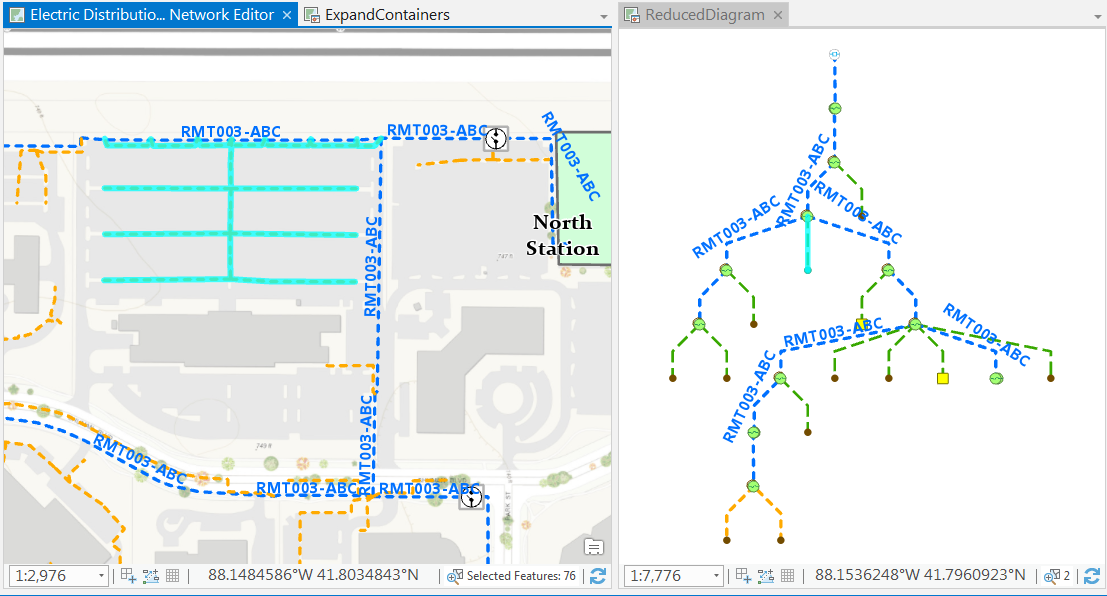
But wait! There’s more! Network diagrams can be created to allow you to efficiently create multilevel representations, readily check network connectivity, and obtain logical views of the utility network. The utility network includes preconfigured schematic diagramming capabilities that allow the generation of diagrams without any setup. You can enrich them by building custom schematic diagramming models or importing models that were built for other utility networks.
Advanced editing and tracing
Honestly, it’s difficult not to get a little excited about all these toys. The utility network provides a highly responsive and intelligent editing environment. Network rules, attribute rules, and validation in the network helps ensure data quality by preventing the entry of invalid data and associations. With advanced topology rules, behavior regarding the connection to terminal devices (such as transformers) can provide ‘on the fly’ quality control during editing sessions. Load-based restrictions can prevent you from connecting inappropriate devices or equipment. Design constraints can be applied to objects supporting or limiting flow. Offset objects that impact the operation or reliability of the linear assets can now be tracked and participate within the context of the model.
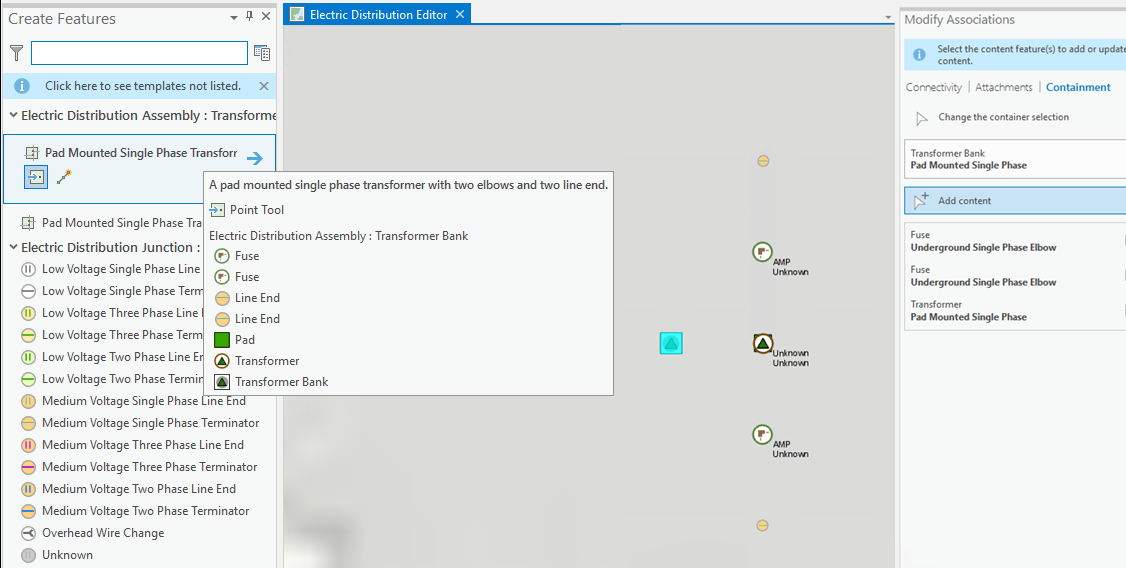
Templates allow you to create preset collections of related assets with a single click or organize a group of templates for more interactive feature creation. You can create preset templates for repeatable configurations when editing that create automatic defining of containment, connectivity, and structural attachment associations during feature creation. For example, with a preset template you can create a pad-mounted single phase transformer bank container with two elbows and two line ends in one click.
In addition to pole features using associations, a pole-mounted transformer can also be vertically represented. The utility network classes are z-enabled to allow accurate modeling of above and below ground infrastructure. This enables the viewing and editing of network features in their real-world elevation and allows you to take advantage of the many ArcGIS Pro visualization features.
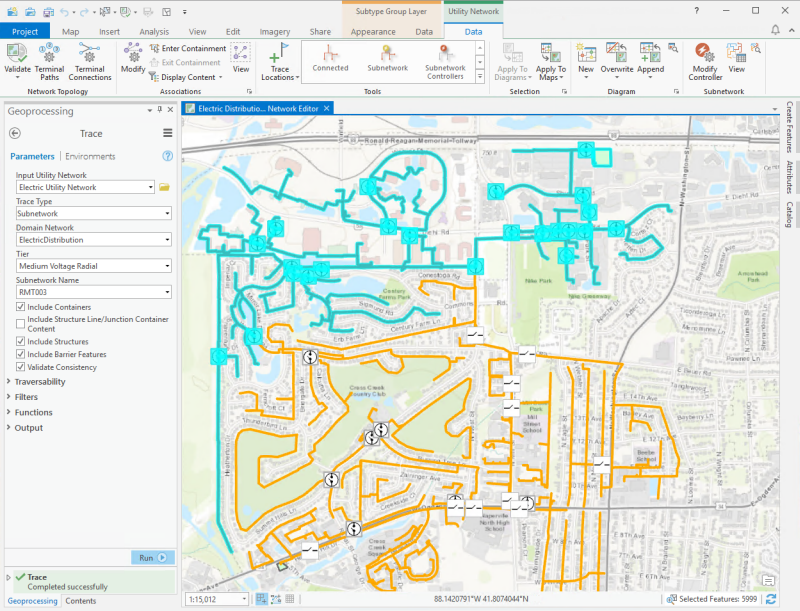
But wait! There’s more! The utility network has a collection of tracing and analysis tools to support a variety of analytic workflows. You can use traces to help determine the number of customers with access to your resource, create a load summary to present the number of customers being fed by a specific circuit, or do an inspection of the entire network after a major weather event.
Tracing functions exposed as a geoprocessing tool perform at a higher rate because of the use of REST endpoints that pass through the analysis service. You can trace network features upstream or downstream from a given location. Analytics can be fired off as SDK (Software Development Kit) or process styled events. This approach translates to a faster performance for analytic capabilities customized to fit specific business drivers. If a water main breaks, you can run a trace across all systems involved to see where the problems are, then decide on the best solution.
In the words of Ron Popeil, “Isn’t that amazing!” I am excited for our partners and user community to use and experience the ArcGIS Utility Network. The utility network has so much functionality it’s difficult to discuss all of it in one post. In future posts, I will share more about specific areas of functionality in the utility network across electric, gas, water, and other use cases. The next blog post will discuss the concept of domain networks in the utility network, opportunities for utilization and even a few thoughts from the development team here in Redlands.
– Remi Myers, Esri Utility Network Product Manager
This post was originally published on January 23, 2018, and has been updated.



Commenting is not enabled for this article.