To support action against COVID-19, information is critical. Just a few weeks ago we knew very little about the health, social and economic impact that COVID-19 was inflicting on our society. We still have much to learn about COVID-19 itself. Yet, a few weeks ago and still today, governments and organizations of all sorts are pressed to quickly set up policies to deal with this pandemic.
That was the case in Spain earlier this year. Government officials needed information on how citizens were managing life in quarantine and where to take action first. To get a pulse on how people were being affected, Dr. Nuria Oliver developed a 24-question survey in collaboration with European researchers and the Spanish Government.
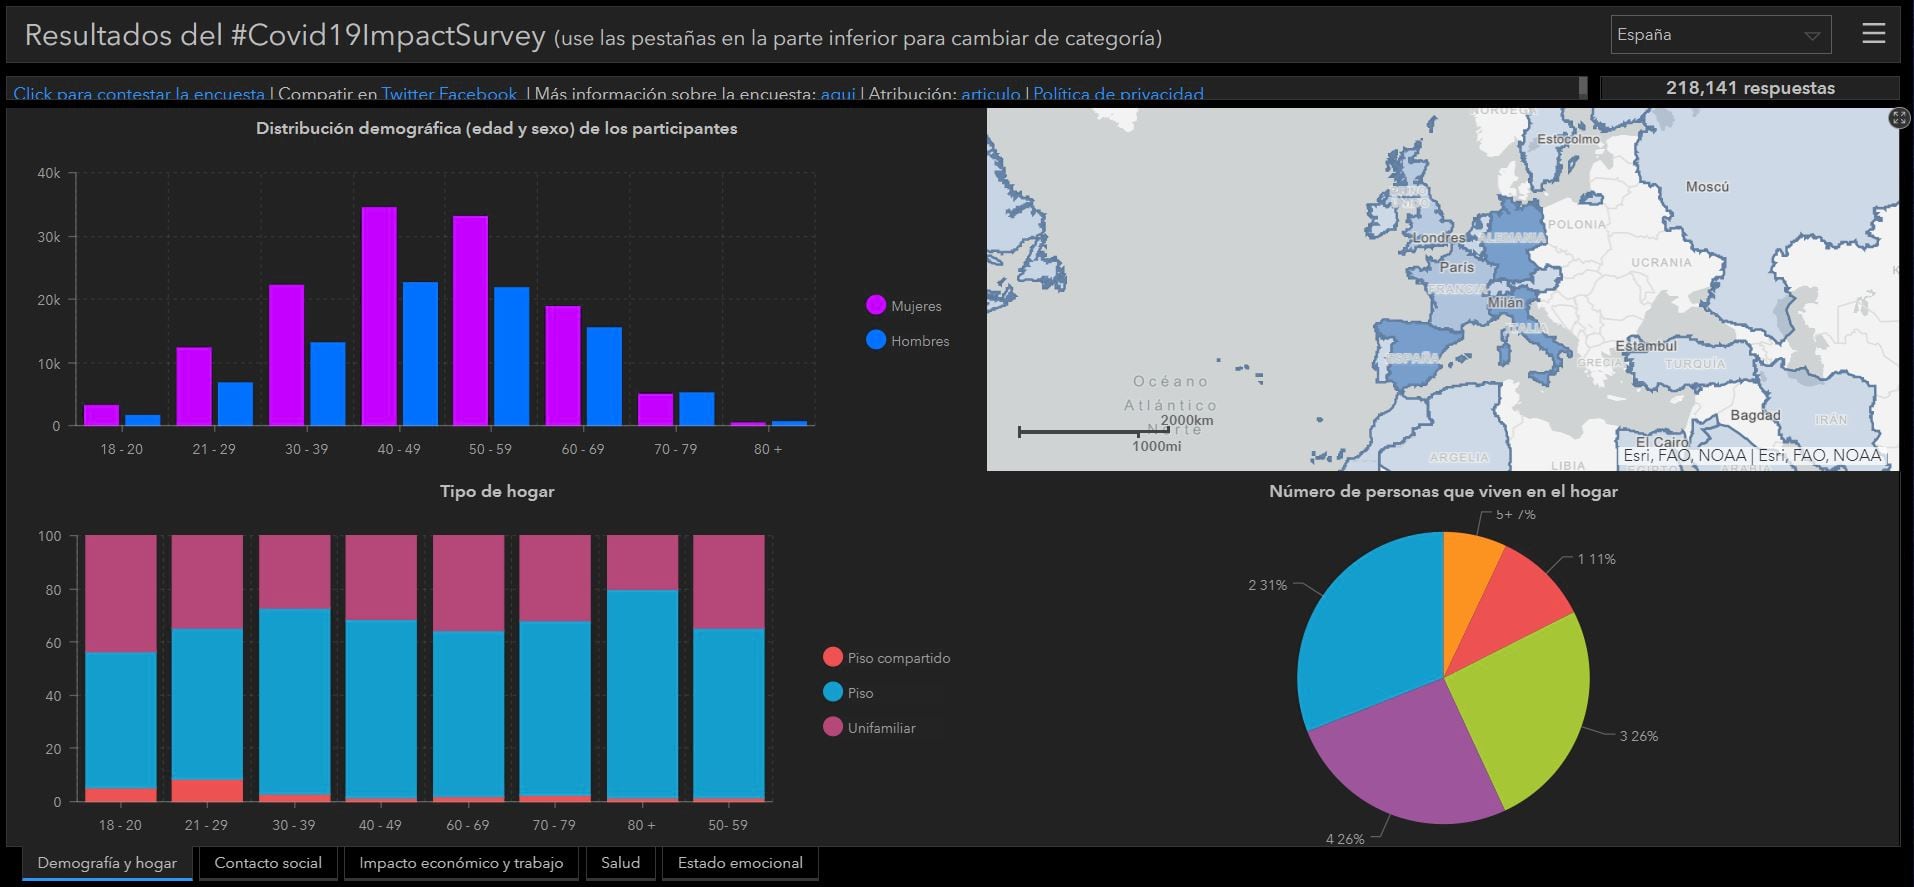
Dr. Oliver is the high-commissioner of Artificial Intelligence and COVID-19 of Valencian Government in collaboration with European researchers and the Spanish Government, Director of ELLIS (European Laboratory for Learning and Intelligent Systems) in Alicante. The survey was designed to gain insights into each participant’s home situation, social contact behavior, personal economic impact, workplace situation, and health (including questions on testing and symptoms). The survey went viral, with more than 146,000 responses in less than 48 hours, and more than 213,000 responses total (so far).
“We wanted to get first-hand information about people’s experiences and perceptions during the confinement period due to the COVID-19 pandemic,” Dr. Oliver explained. “In particular, we wanted to shed light on people’s social behavior during the confinement, resilience towards the measures, labor and economic impact, symptom prevalence, test availability and emotional state. All in a short, 25-question survey that can be filled out in about 3 minutes.”

To help the researchers process the vast amount of data in a short period of time, the results were aggregated into a real-time dashboard to quickly understand citizens’ personal experiences and concerns. The project was so successful that Cornell University’s Computer Science department released an academic paper assessing the impact of the survey, drawing implications for the design of public policies related to the management of the pandemic. To view the academic survey analysis from Cornell University, you can download the PDF from their website.
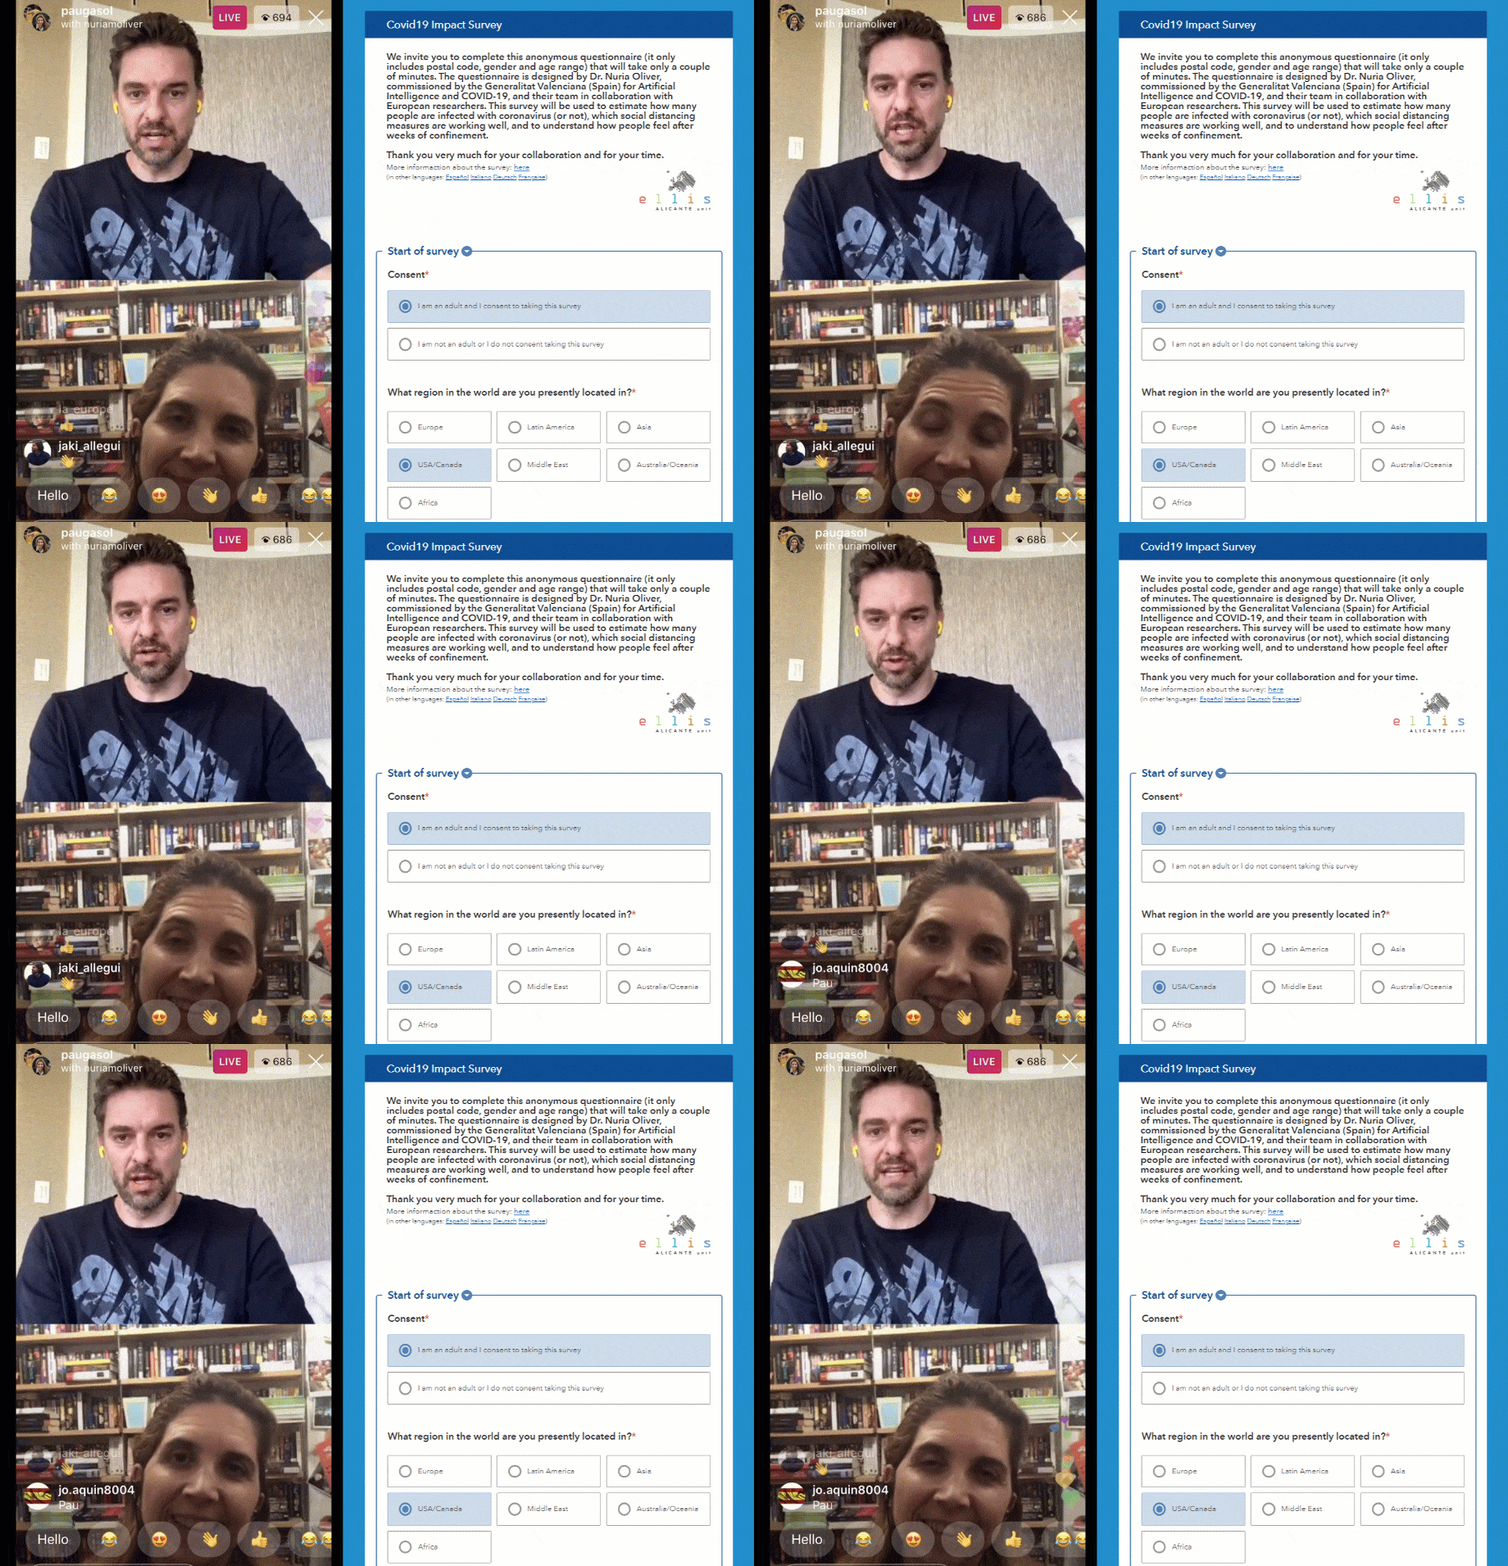
The survey and results even garnered attention from NBA Player Pau Gasol, who interviewed Dr. Oliver about the survey on Instagram Live. The COVID19 Impact Survey is still open and collecting public data, so you can participate by taking it today.

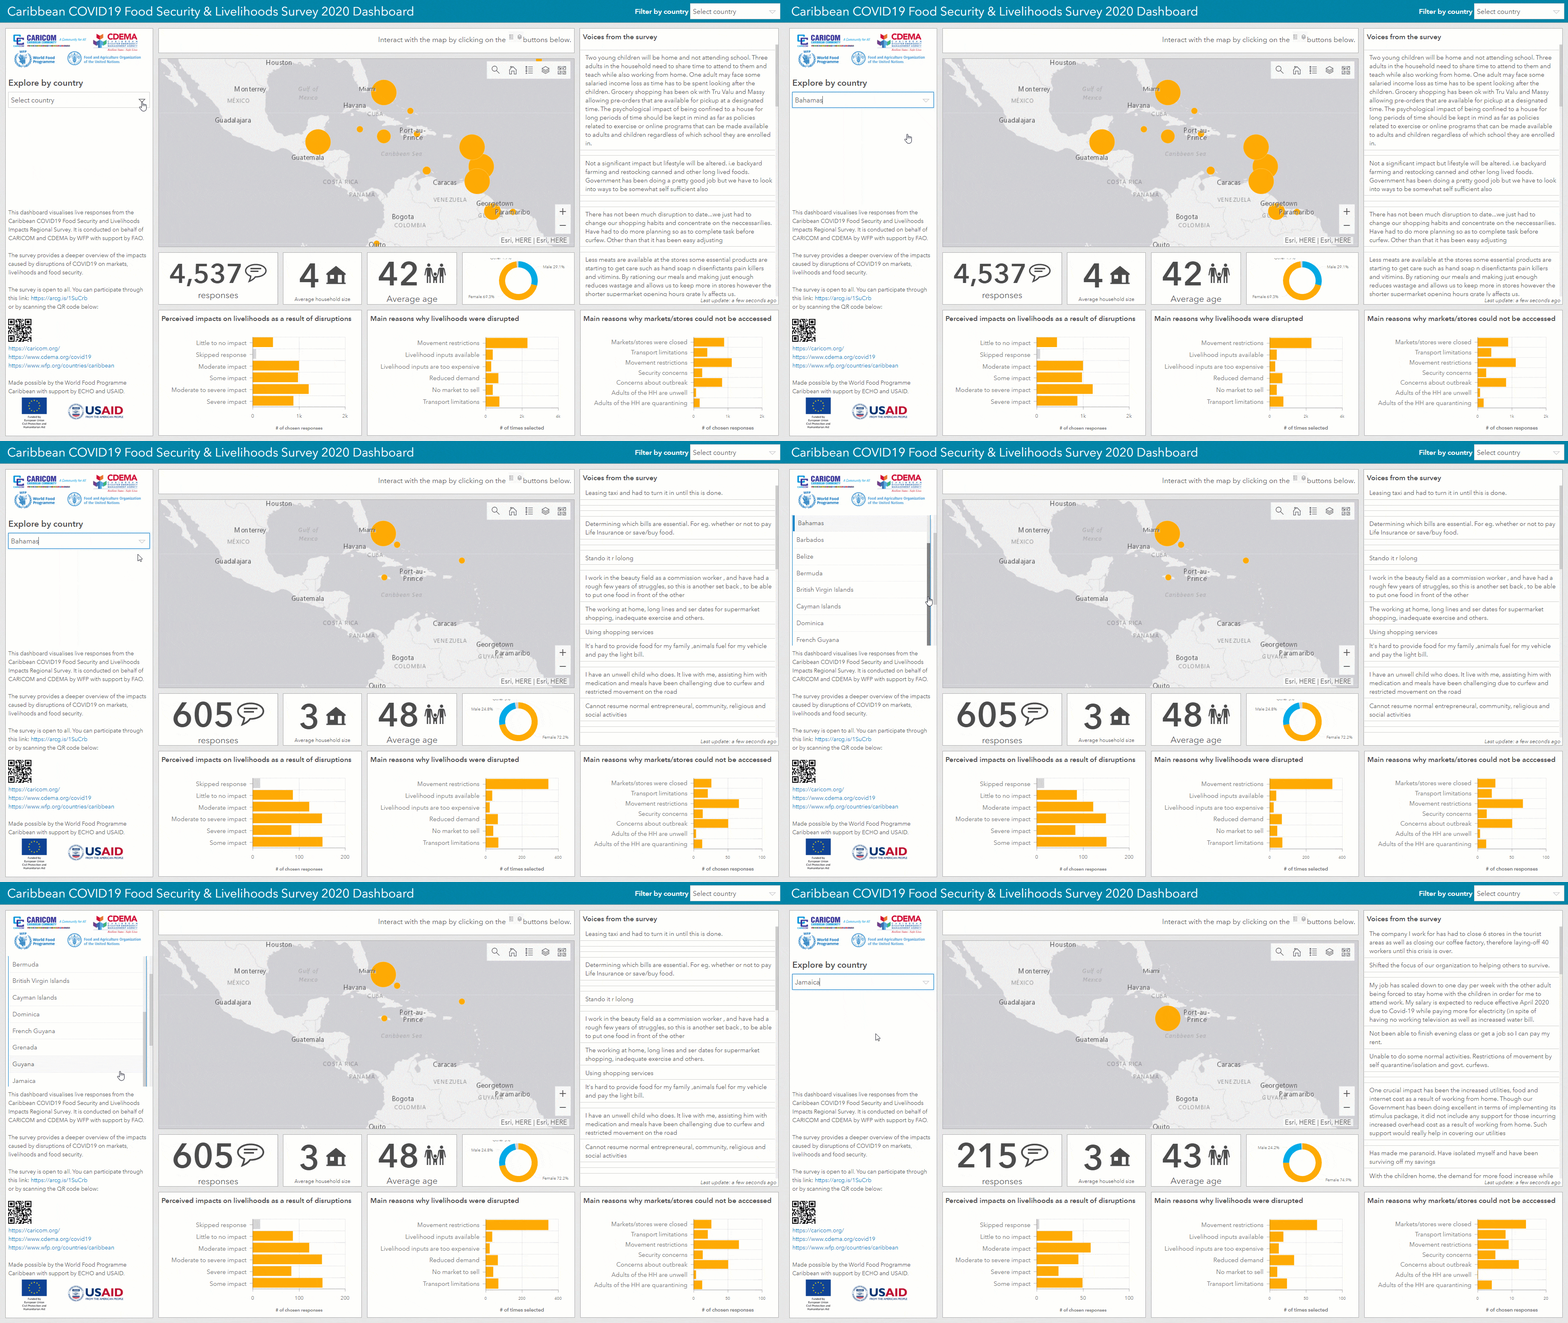
Meanwhile, the United Nations World Food Programme was facing a similar challenge. The Caribbean COVID-19 Food Security and Livelihoods Impact Survey was launched to rapidly gather data on the impact the virus was having on livelihoods, food security, and access to markets. The survey was shared broadly via social media, email, and media and garnered 4,537 responses from 19 countries in the region.
Similarly, responses were visualized live on an interactive dashboard and continually monitored to ensure their legitimacy based on cross-referencing with prior knowledge and secondary data.
Here is a screenshot of the dashboard:

The UN World Food Programme’s full report on this project can be downloaded here.
These stories demonstrate a common pattern – organizations around the world are using ArcGIS Survey123 to capture data and leverage spatial thinking to support decision making. The value of using location-aware smart forms and dashboards to collect and visualize quality spatial data from the beginning is critical for responding to crises in real time.
For more information and COVID-19 resources from Esri, please visit our website and the COVID-19 GIS Hub. All of the latest updates for ArcGIS Survey123 are posted in our GeoNet Community.

Article Discussion: