Today marks the dawn of a new era for storytelling with maps. After many months of research, planning, testing, and development, we’ve just launched a beta version of our next-generation storytelling tool. I’ll tell you more about that in a moment, but, as my team and I pause at this exciting inflection point, I’d first like to reflect on how we got here.
A brief history
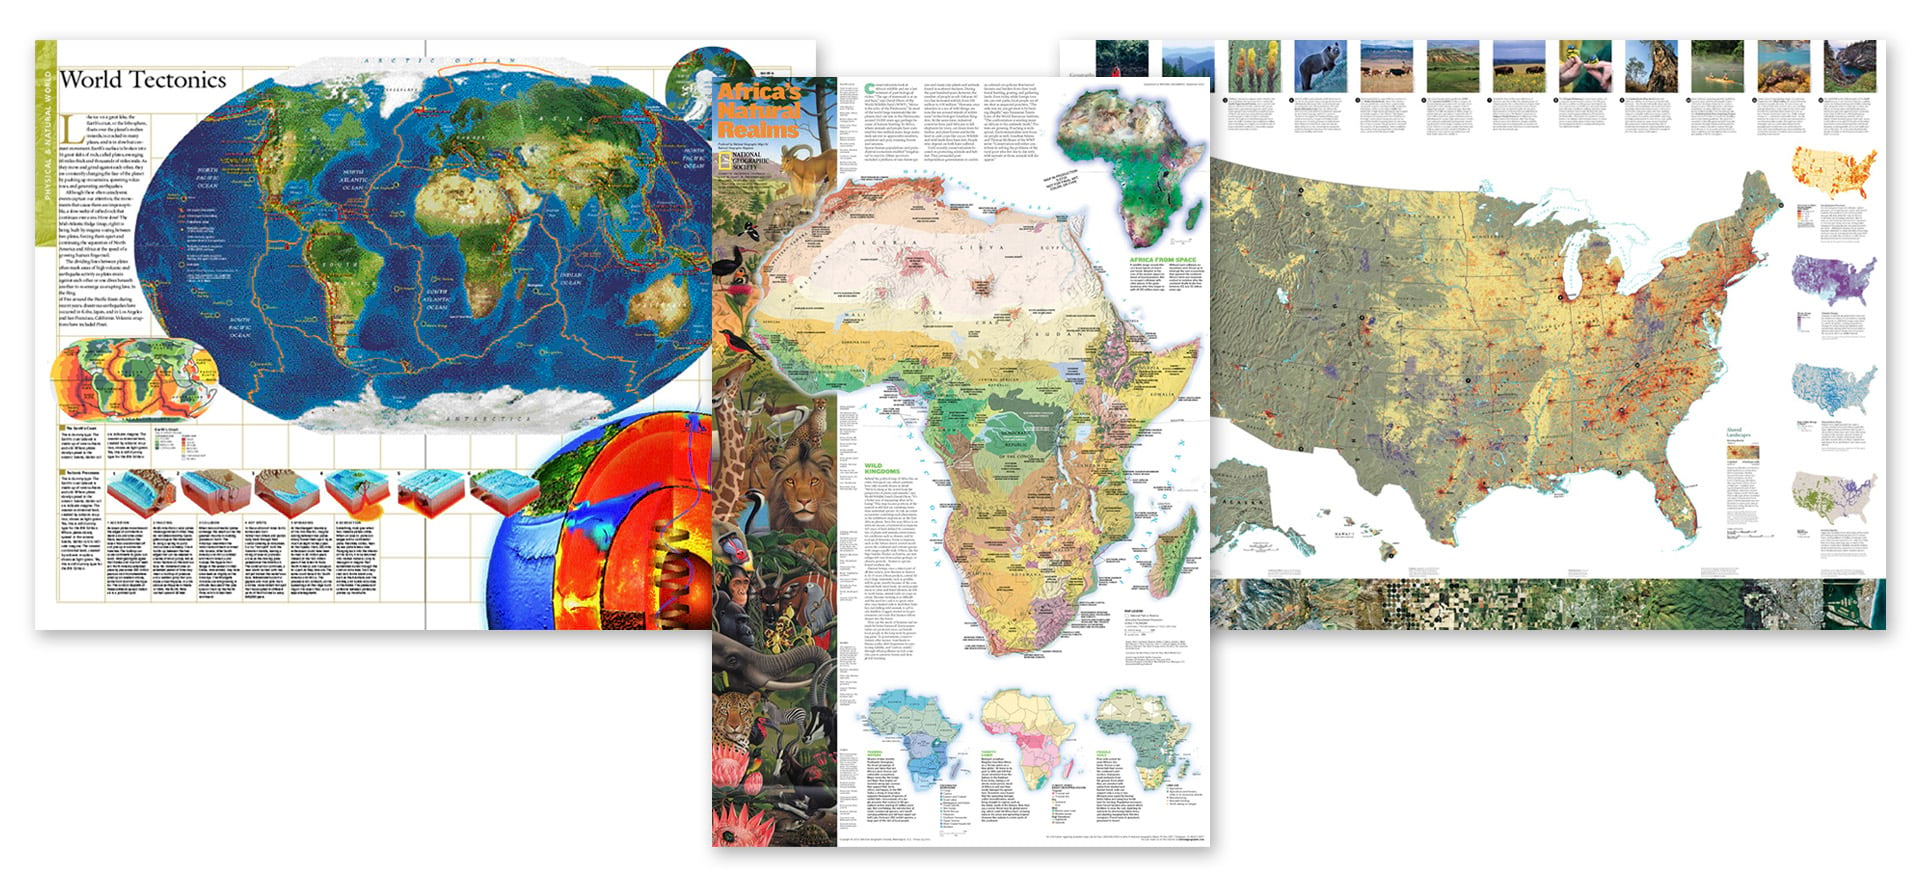
Maps have been telling stories for centuries. In a way, every map tells a story, both about the places it depicts and about the perspectives and biases of the mapmaker. In the latter years of my long tenure at National Geographic, I had the good fortune of telling stories with maps as the Society’s chief cartographer. The vast majority of that storytelling was published via ink and paper (see examples below). We used all sorts of tricks and techniques to create narrative flows within a static medium: We manipulated hierarchies of type, we tweaked color palettes, we adjusted layouts and compositions to guide readers’ eyes across a page, an atlas plate, or a large-format wall map.
During the 1990s, as the Internet was exploding into a mass medium, it began to dawn on us that the Web created exciting new opportunities for map-based storytelling. Maps no longer had to be static; they could be combined with multimedia content and woven into new, immersive experiences.
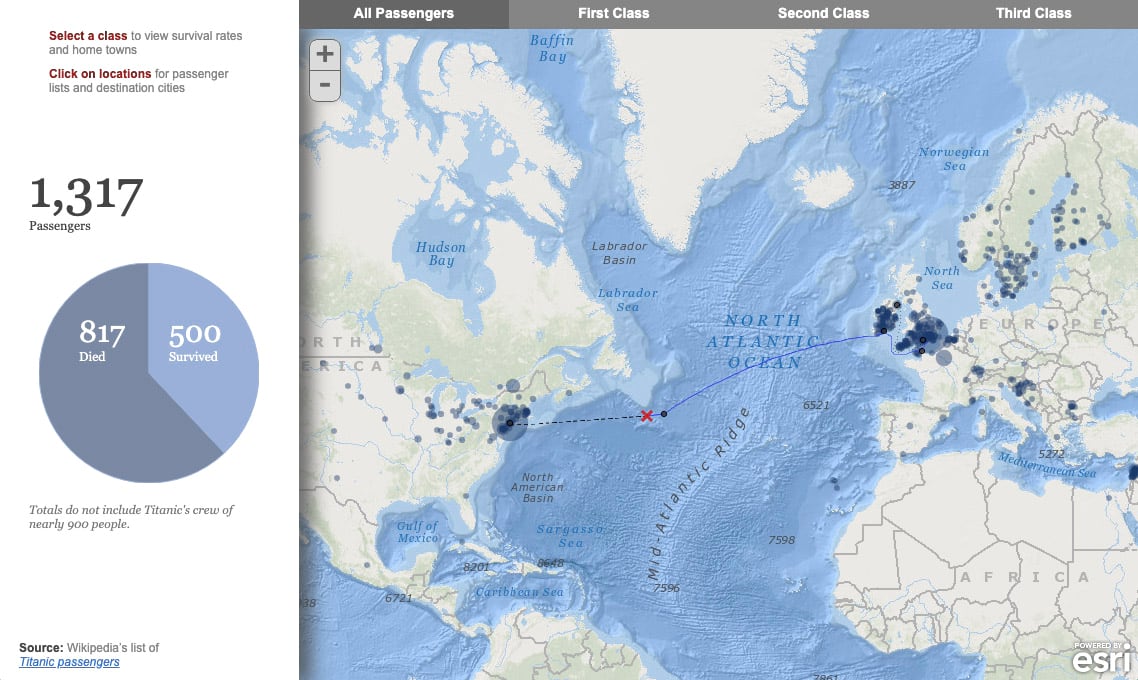
Eager to explore these new opportunities, I came to Esri in late 2010, founding the Story Maps team. Right away, we began to experiment. We assigned ourselves specific story topics and built custom user experiences to support those stories. One of our early successes was to map-enable the passenger list of the Titanic. While the story’s interface was successful for that particular topic, it didn’t lend itself to broader applications. Other early experiments, however, raised the possibility that anyone could pour their own maps, images—and passions—into the same format to great effect.
Storytelling tools for the masses
While I’d brought a few design and editorial skills to my new role, I’d had little success in progressing from my chronic state of technical ineptitude—despite my lengthening tenure at a technology company! My team and I wanted to enable anyone, myself included, to create rich map-driven narratives, so we began to incorporate builder functions into our experiments. These builders made it possible to create stories without needing technical expertise in programming or web development.
Story Map Tour was our first foray into configurable web apps that provided a means by which people could tell their own stories. Since then, Map Tour has been used to create hundreds of virtual guided tours through historic districts, natural areas, gardens, and campuses.
Map Tour, together with our continuing experimentation, spawned additional storytelling templates that presented place-based narratives in a variety of ways. Story Map Journal was released in 2015 along with an example story we co-produced with the Wildlife Conservation Society. Journal was a breakthrough for us; its versatility and more sophisticated builder helped it become the most widely used template to date.

Map Journal and its more recent offspring, Story Map Cascade, reflect the degree to which we’ve improved as we gained experience. We benefited from user feedback and from steady advancements in Esri’s ArcGIS Online technology. Soon a burgeoning authoring community was creating hundreds of thousands of story maps. It was enormously exciting to watch our efforts gain traction, and to discover beautiful stories produced by all sorts of people and organizations.
The lessons we’ve learned
Looking back, our successes have not come without some key opportunities for self-evaluation. Each successive template was better than its precursor, but that also meant no two templates had the same builder. This can be a little confusing to new story map authors, who sometimes begin crafting a story in one template only to realize later on that they’d prefer a different one.
Another realization has been the rapidly increasing importance of thinking mobile-first. While all our templates work across devices and screen sizes, many of the mobile experiences had been developed in a time when it was OK to put desktop first and mobile second. Today, readers expect much, much more from mobile designs.
Finally, we’ve come to see map-driven stories as an effective way to build greater awareness for the power of thinking spatially. While the GIS community has always been, and will forever remain, our core audience, we’re convinced that there are millions and millions of potential story mappers out there: students, scholars, scientists, public affairs specialists, designers, journalists, activists, hobbyists. With the right tools, these individuals could start turning their own narratives into place-based stories, starting with basic geographic context and building their skills as they discover the incredible potential of thoughtfully visualized spatial data.
A revolutionary next step
Esri Story Maps have evolved tremendously over the past eight years, but today marks our biggest leap forward yet. We’ve taken the lessons described above, along with the wealth of feedback provided by our storytelling community, to create a next-generation storytelling tool. Meet our latest and greatest creation: the ArcGIS StoryMaps Beta.
As my colleague Mark outlines in the video above, the new StoryMaps’ key features include:
- A unified builder, within which you’ll ultimately be able to mix and match all the various experiences from our classic templates in a single place;
- New design tools to refine the look and feel of your story in just one click;
- Express maps, a new mapmaking tool that lets you create simple maps in minutes;
- New publishing workflows, including autosave and the ability to make changes to a shared story but only publish them when you’re ready; and
- A completely redesigned mobile experience that minimizes load times and maximizes delightful reading.
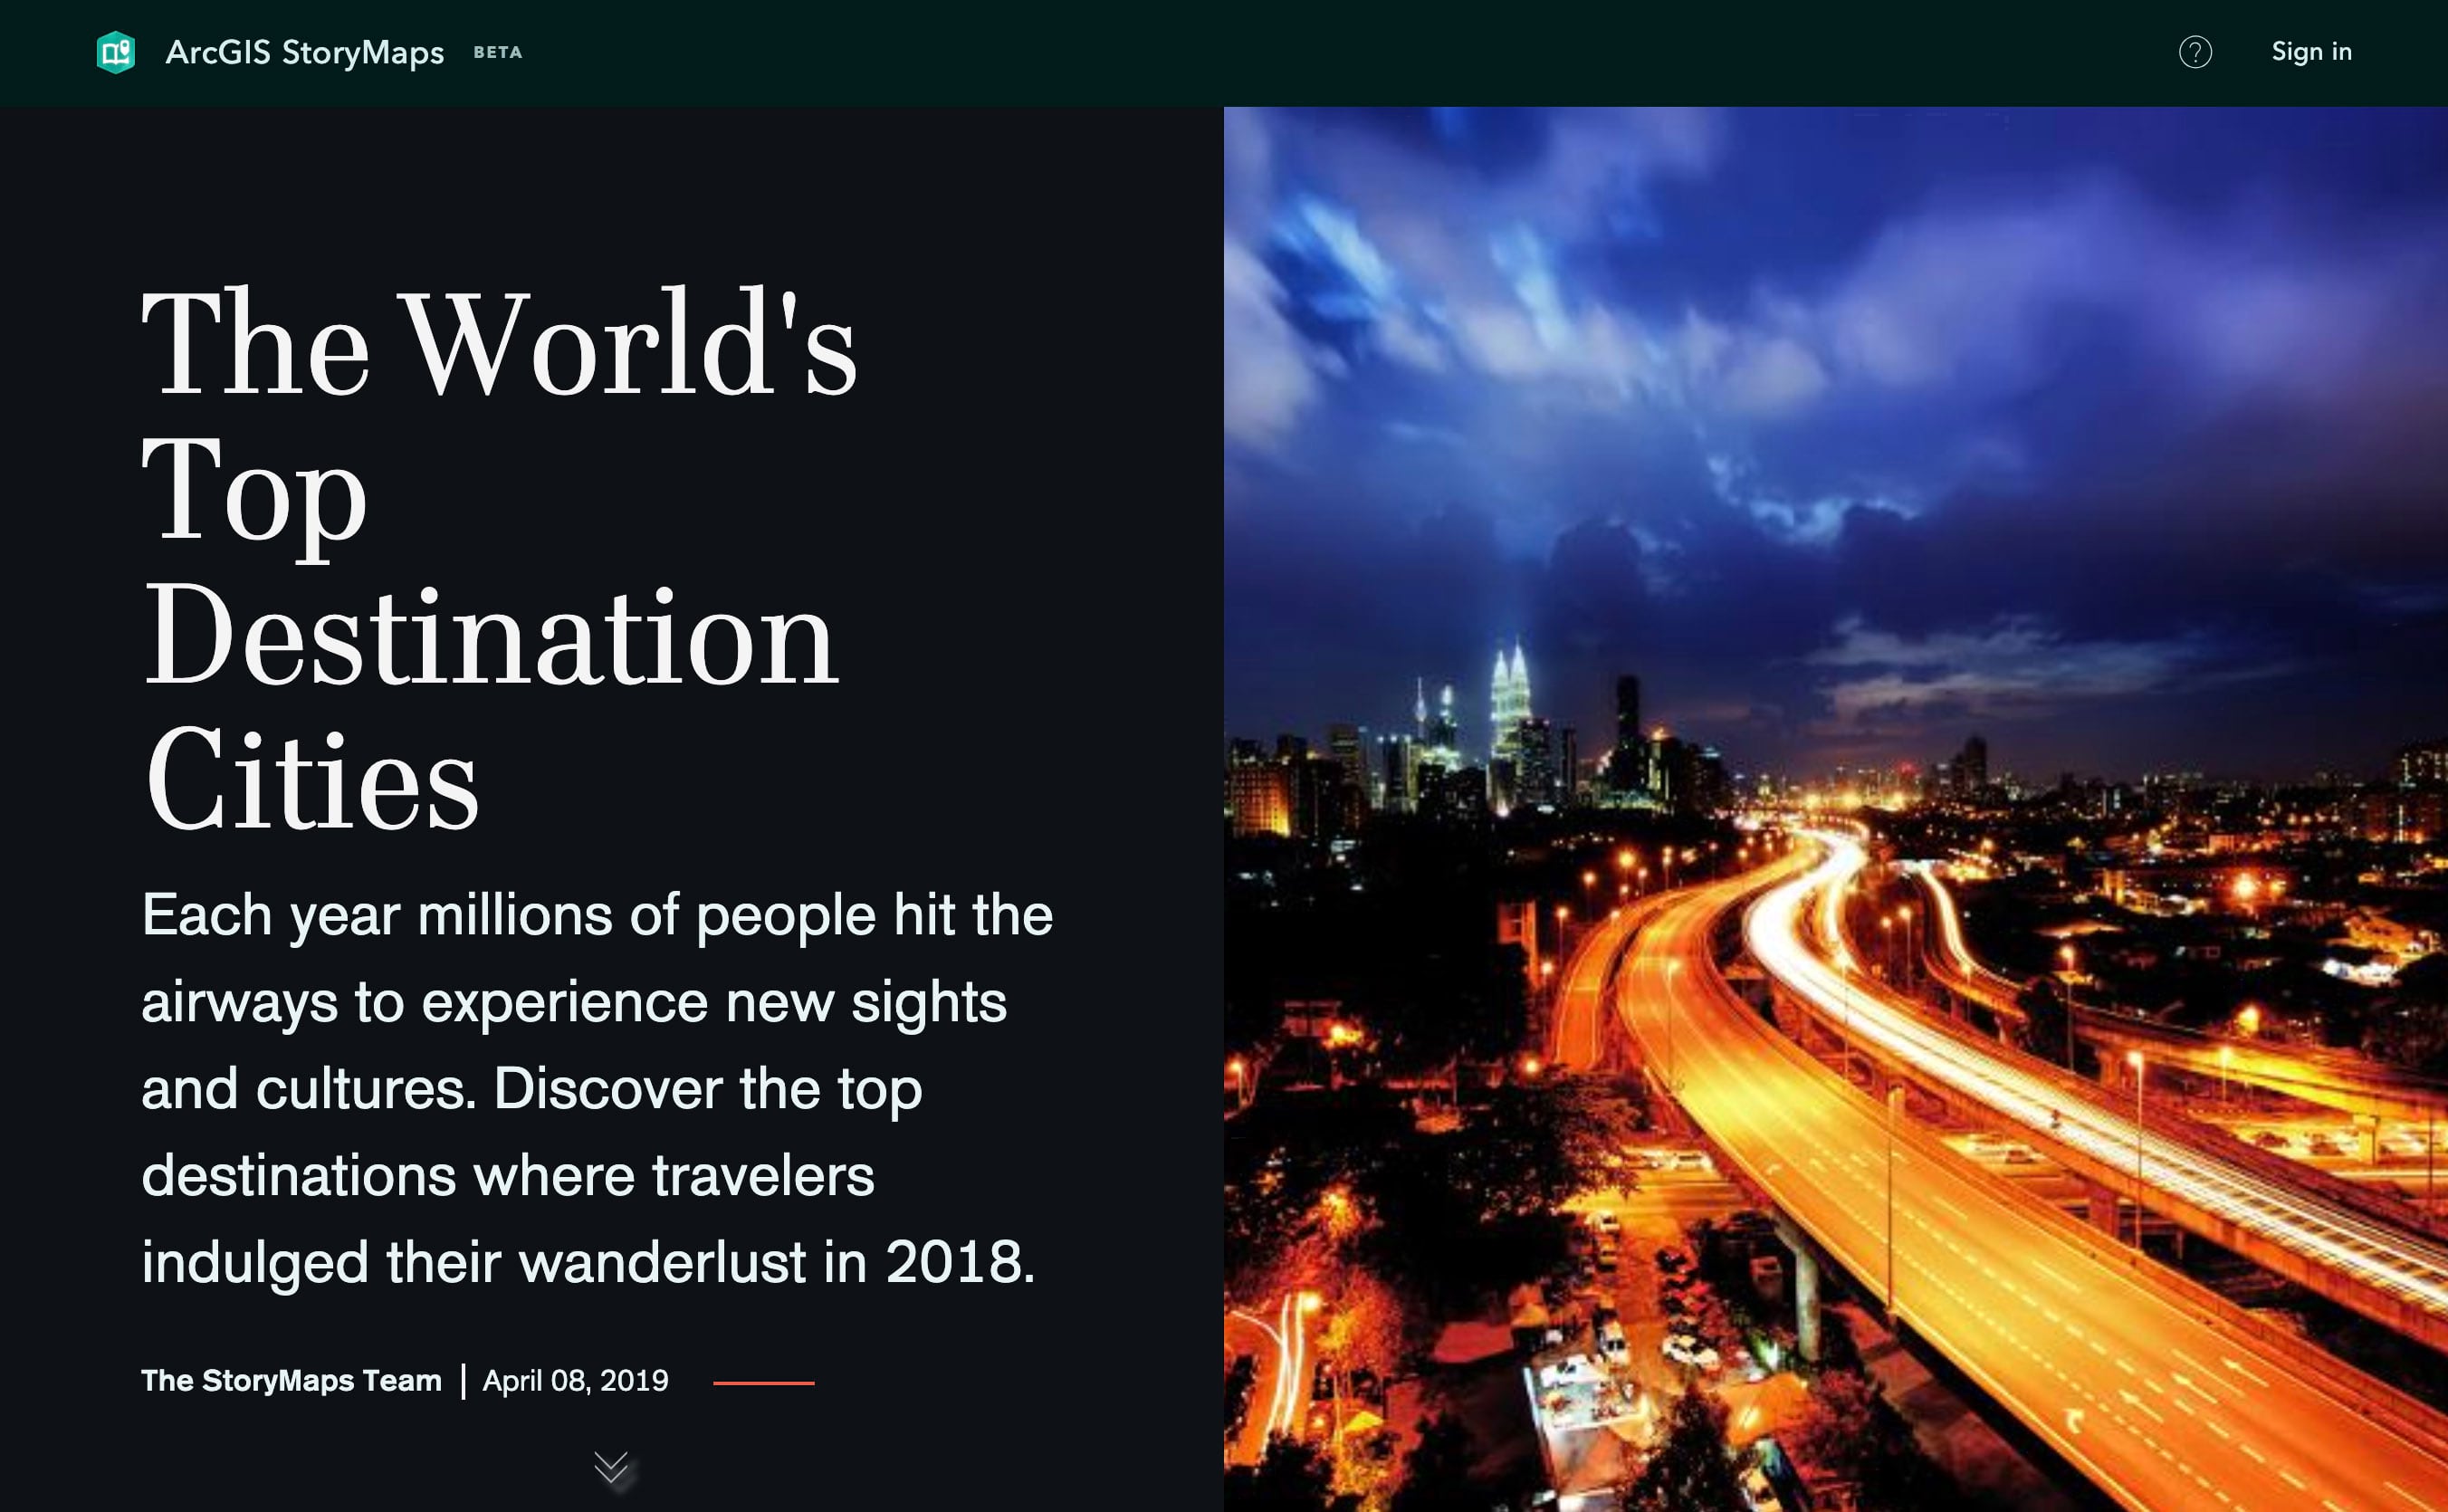
There’s no better way to see just how different the new ArcGIS StoryMaps is than to take a look, so here’s a new story map created with the beta.
It’s worth repeating that the new StoryMaps is currently in beta phase, meaning the product isn’t feature complete just yet. In a nutshell, here’s our plan for beta testing:
- The beta is open to the public—anyone with a Creator license is welcome to take it for a spin.
- We’ll be relying on your feedback to improve the tool for its official release, so please be sure to share your thoughts, reactions, and questions with us on GeoNet.
- Meanwhile, our current array of story map templates—including Story Map Journal, Cascade, Shortlist, Series, and Tour—will remain available for the foreseeable future.
If you’re an online news junkie like I am, you’ve probably seen the custom multimedia features that media organizations like the New York Times, the Washington Post, and The Guardian are producing. Those organizations are blessed with teams of skilled designers and developers who create bespoke stories. It’s our goal to enable thousands and thousands of people to create sophisticated, map-driven narratives that rival the best of those custom productions. ArcGIS StoryMaps bring us significantly closer to fulfilling this vision.
So, without further ado, please give the beta a try and let us know what you think!


Commenting is not enabled for this article.