It’s that time of year, when the StoryMaps team comes together to review and reflect on the great projects you’ve created this year — and to share some of our favorite stories. 2024 marked a year of growth and innovation for ArcGIS StoryMaps, propelled by the creativity and engagement of a growing, global community of storytellers. We feel the stories below embody that creative, ambitious spirit — and we think you will, too.
Whether you’re into nature, history, news, or travel, there’s a story for you. So grab a cup of tea and get cozy. You can view all our favorites in the collection below, learn about why we selected them, and even spruce up your desktop with some downloadable wallpapers!

Choosing just a handful of favorites from the thousands of ArcGIS StoryMaps created in 2024 is no easy task. For every favorite story on our list, there are hundreds more that deserve recognition. We’ve picked fifteen standout Esri- and community-authored stories that showcase a diversity of topics and creative storytelling techniques.

Conservation: Animals leading the way
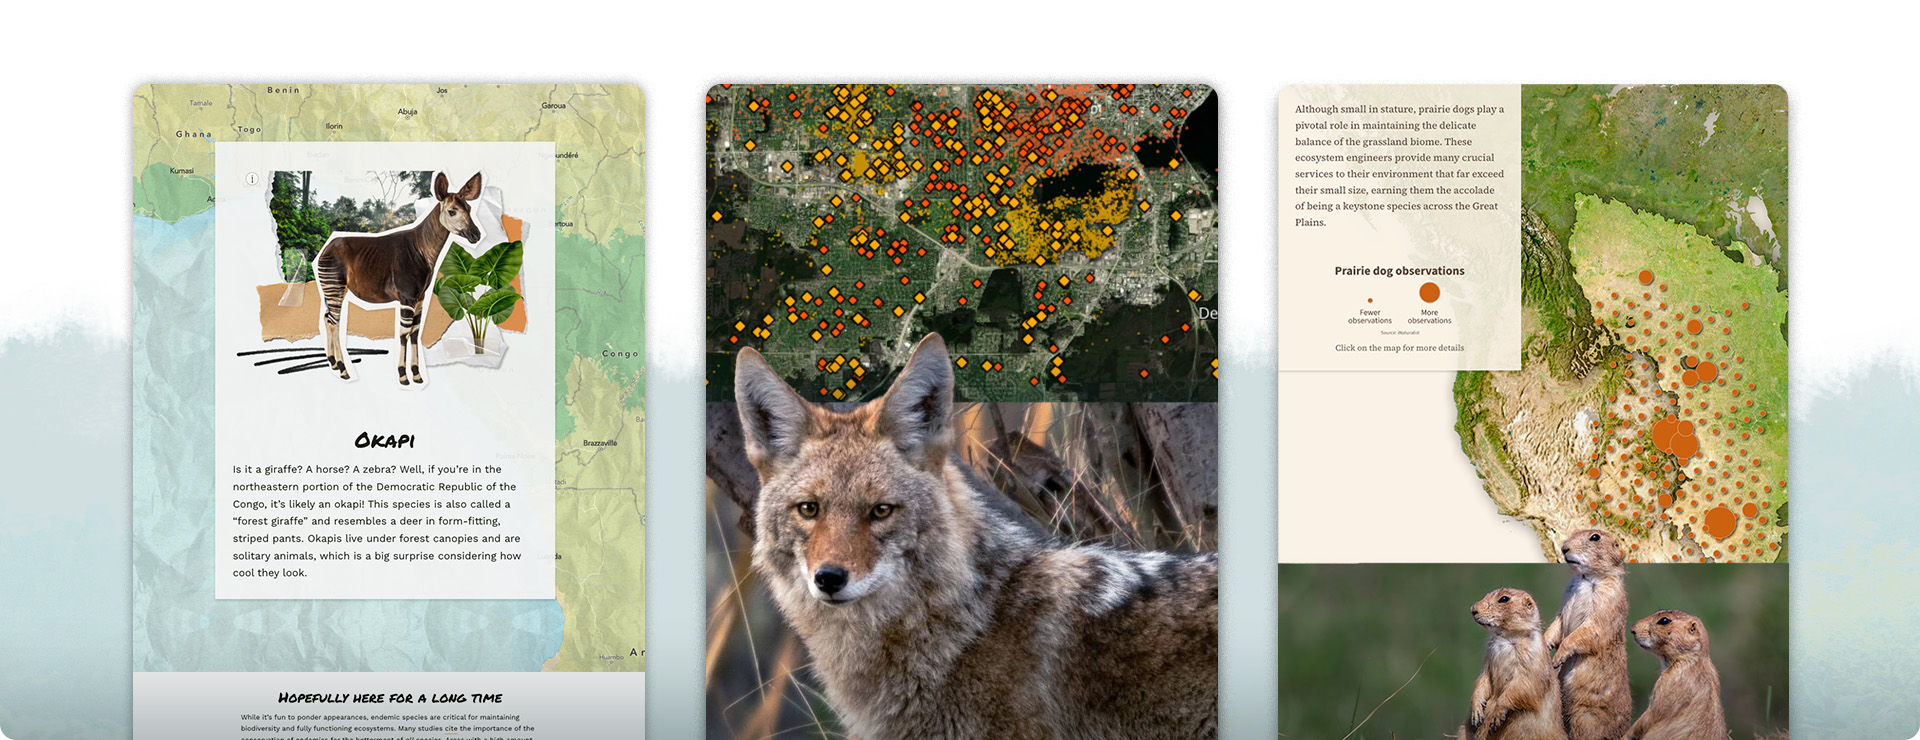
Conservation was a popular topic for storytelling in 2024, with many stories beautifully weaving together visual elements and innovative design to highlight the urgency of protecting our planet.
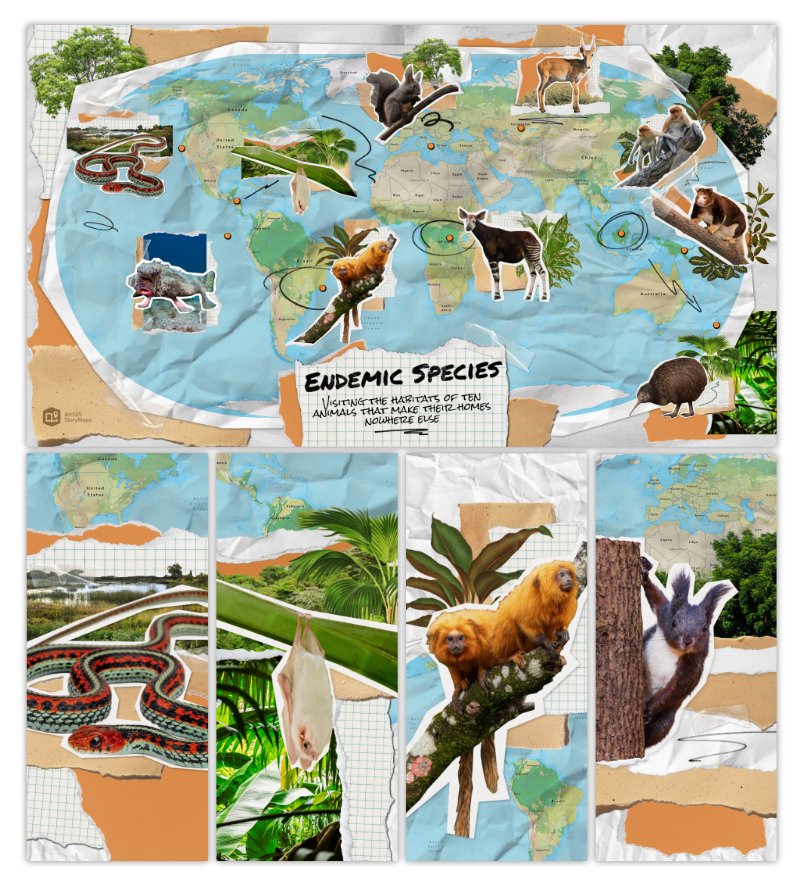
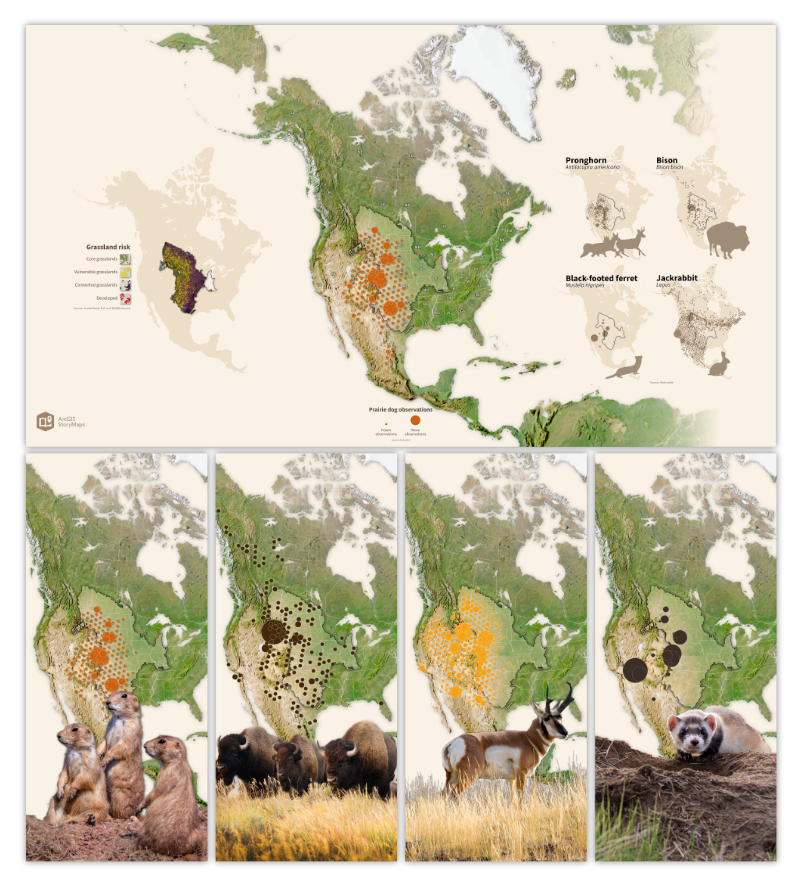
In Little hero on the prairie, custom graphics and interactive media actions showcase the essential role prairie dogs play in supporting hundreds of other species within North America’s grasslands. Endemic species takes viewers on a global, visually rich adventure to emphasize the importance of biodiversity hotspots. Meanwhile, Carnivores in the city uses map choreography, timelines, and swipe blocks to illustrate how coyotes and red foxes thrive in urban Madison, Wisconsin.
All of these stories demonstrate how rich narration and visuals can combine to create immersive stories that convey critical environmental issues and inspire conservation efforts.
Carnivores in the city by Esri’s StoryMaps team
Endemic species by Esri’s StoryMaps team
Little hero on the prairie by Esri’s StoryMaps team

Data-driven science: Making complex information more accessible
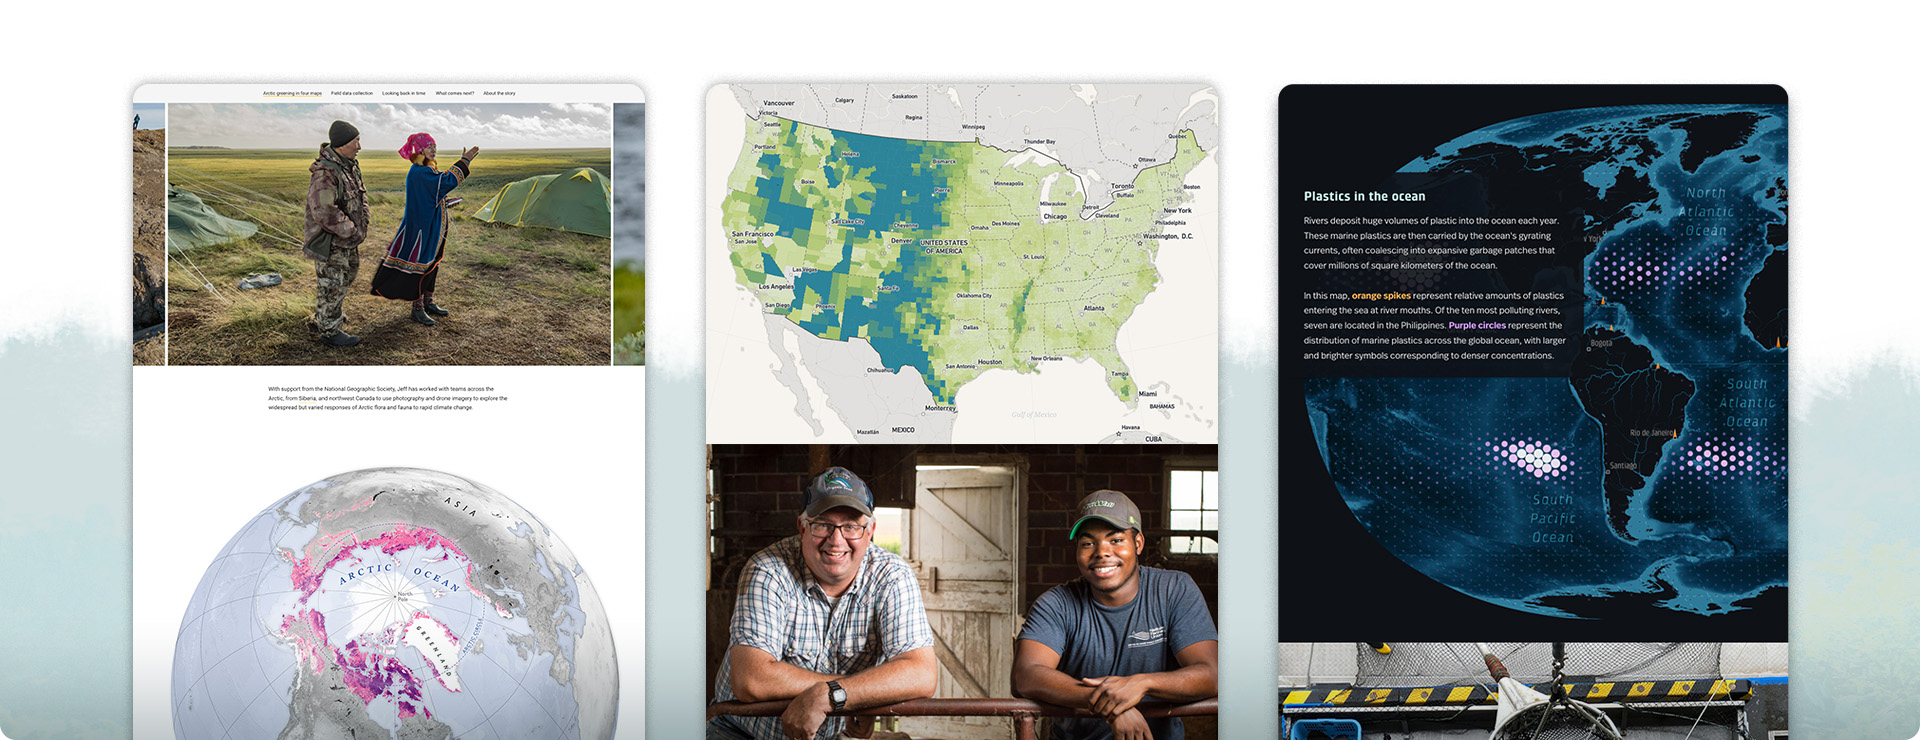
Data-driven stories also proliferated in 2024. Our favorites from this category all use interactive blocks and visually appealing designs to transform intricate scientific data into engaging and accessible narratives.
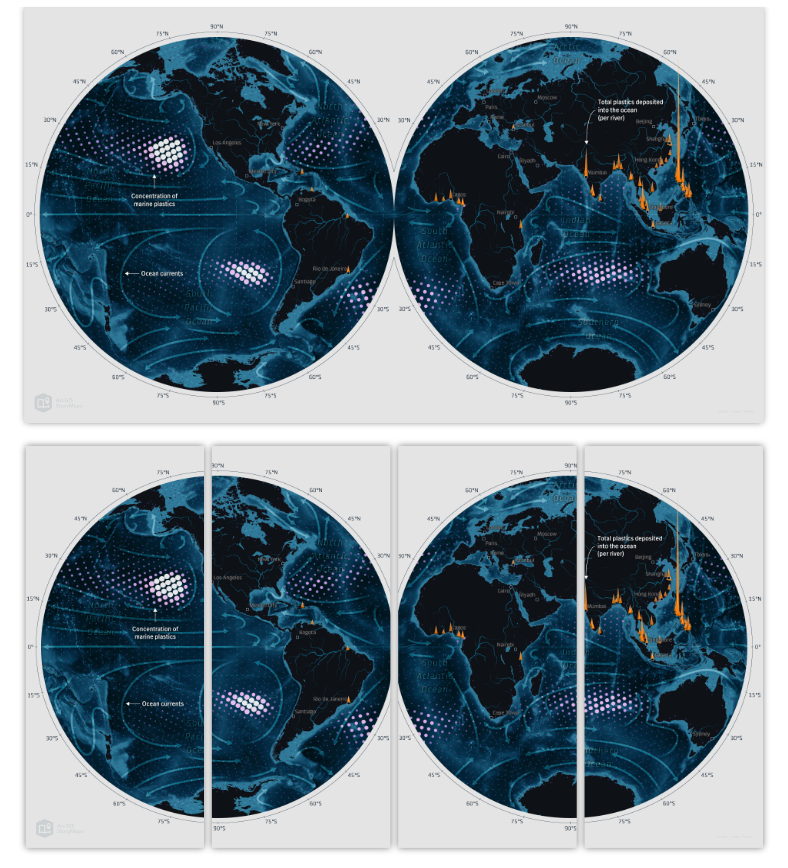
American agriculture by the numbers uses dynamic maps to reveal patterns in the distribution of farms and farm workers, while The finite ocean combines powerful cartography with striking imagery to highlight threats to our ocean ecosystems such as overfishing and pollution. Science meets photography in a greening arctic merges stunning Arctic photos with scientific data, making climate change impacts easy to understand.
American agriculture by the numbers by Esri’s StoryMaps team
Science meets photography in a greening Arctic by Jeff Kirby
The finite ocean by Esri’s StoryMaps team

History: Bringing the past into the present
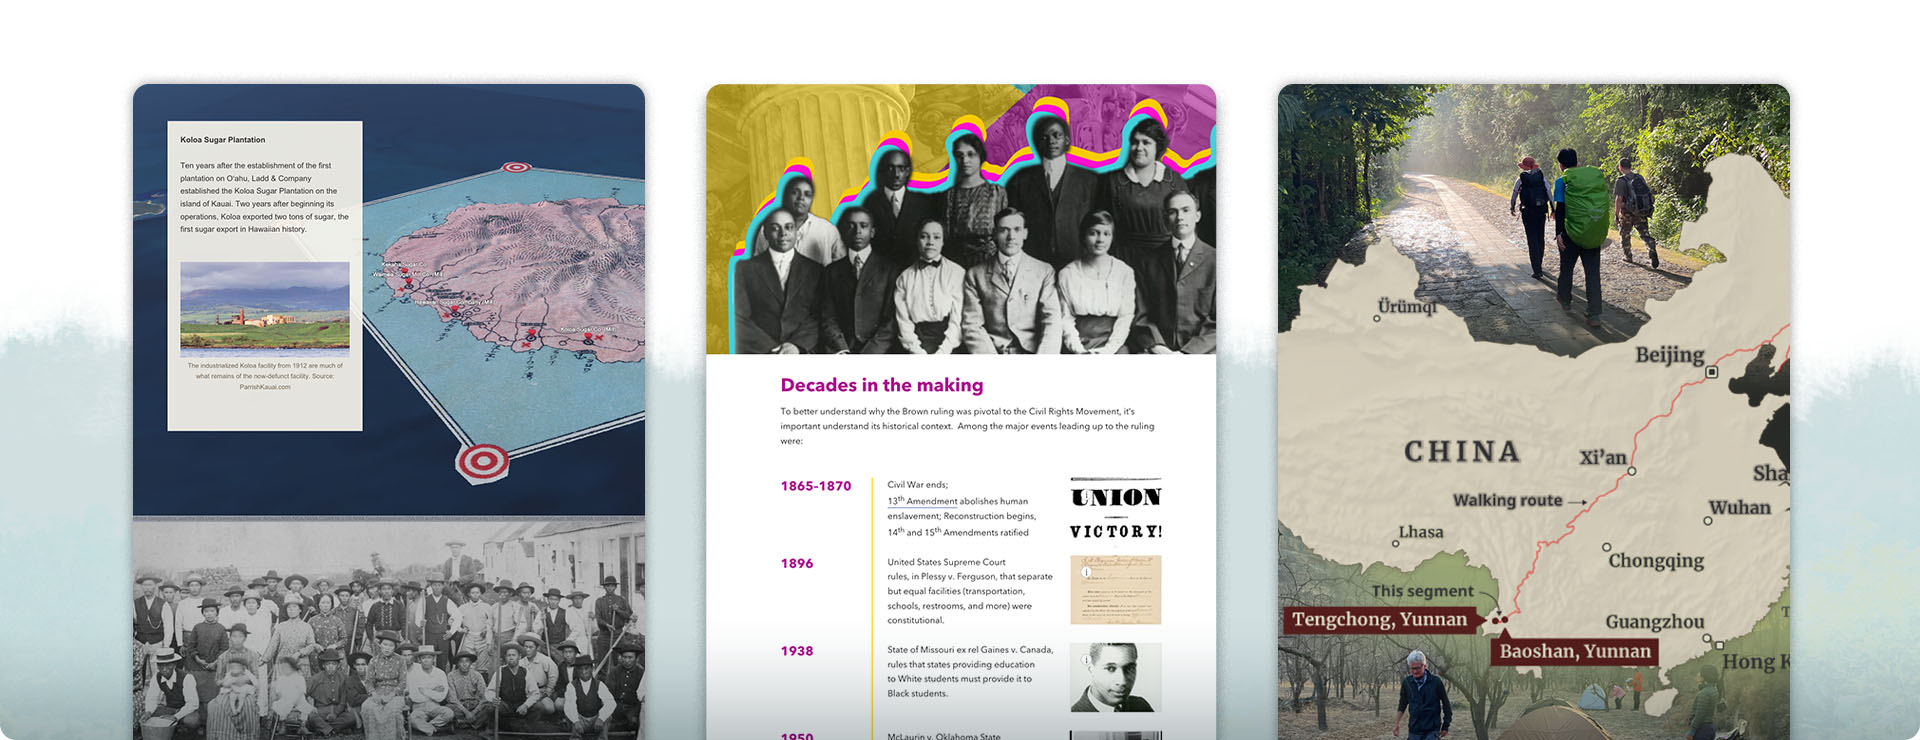
Historical storytelling is a powerful way to connect with our roots and to help us understand the events that have shaped our world. These three stories seamlessly blend interactive maps and custom graphics to make history engaging and immersive.
Walking China’s antique roads uses sidecar blocks and striking photography to present a personal narrative against the complex backdrop of Chinese history, while A civil rights turning point uses the timeline and map tour block to highlight pivotal moments in the Brown v. Board civil rights movement. Finally, Nekketsu Takei’s Hawai’i leverages map choreography and the swipe block to illustrate the cultural ties between Hawai’i and Japan in the past and present.
A civil rights turning point by NAACP and Esri
Nekketsu Takei’s Hawai’I by Katie Chiu, Will Forker, and Li Wei Yang
Walking China’s antique roads by Esri’s StoryMaps team

News & Events: Capturing moments as they happen
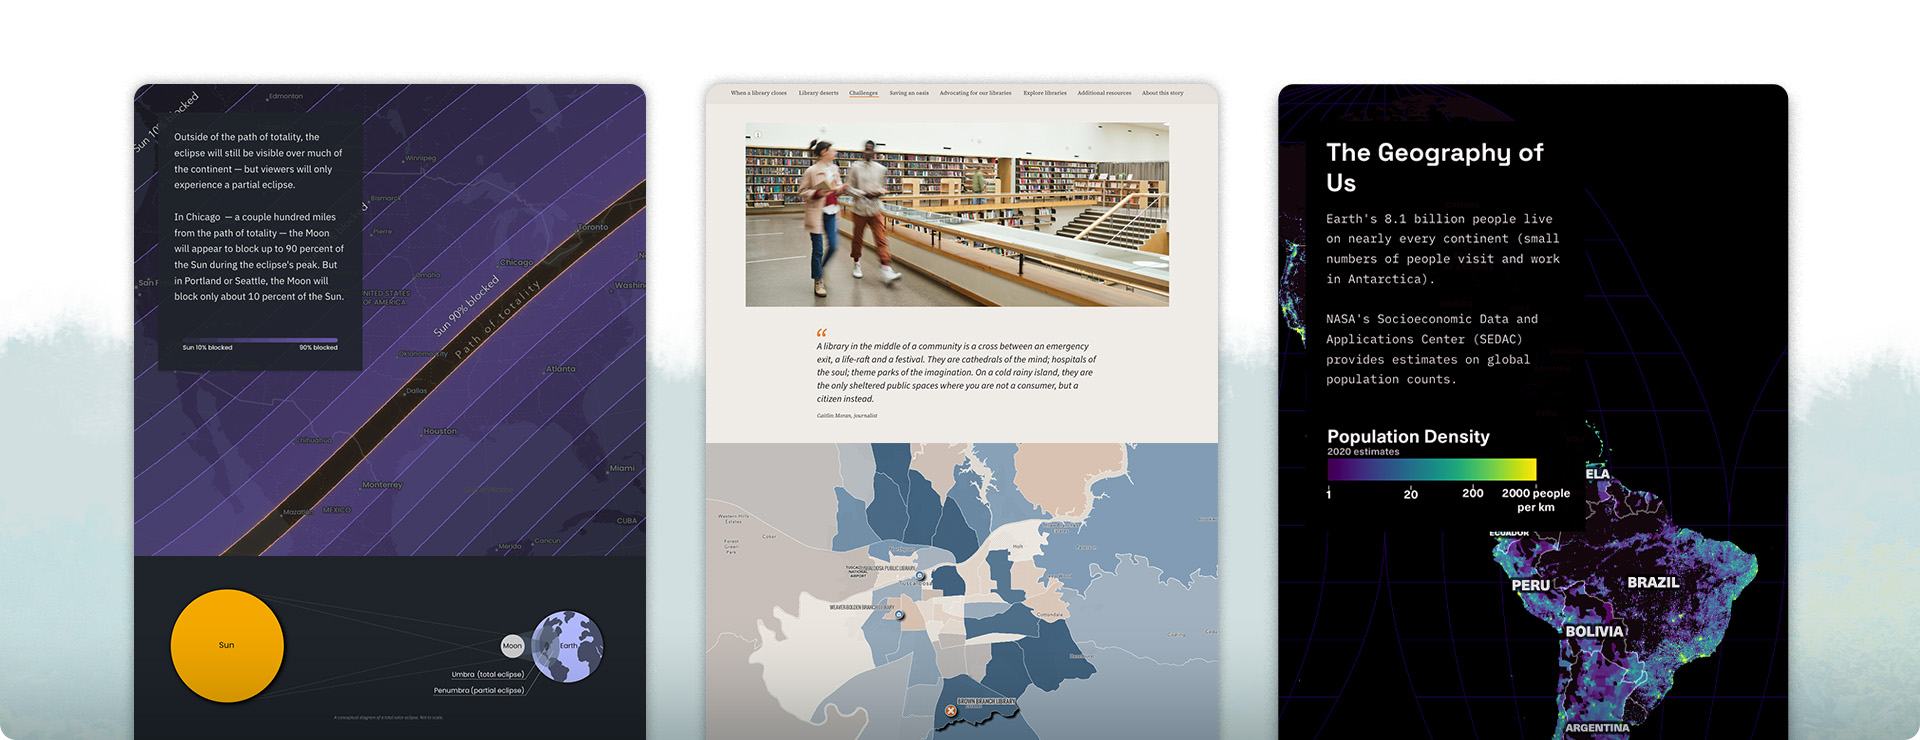
Stories about current events can provide immediate, immersive insights into what’s happening around the world, and shed light on societal issues with real-time data and interactive elements.
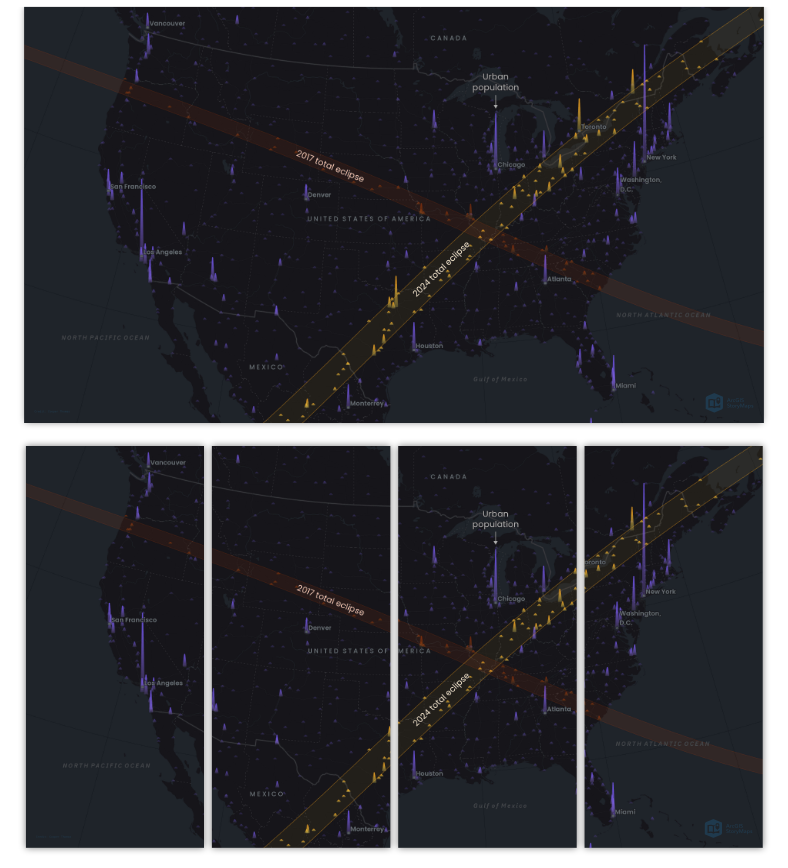
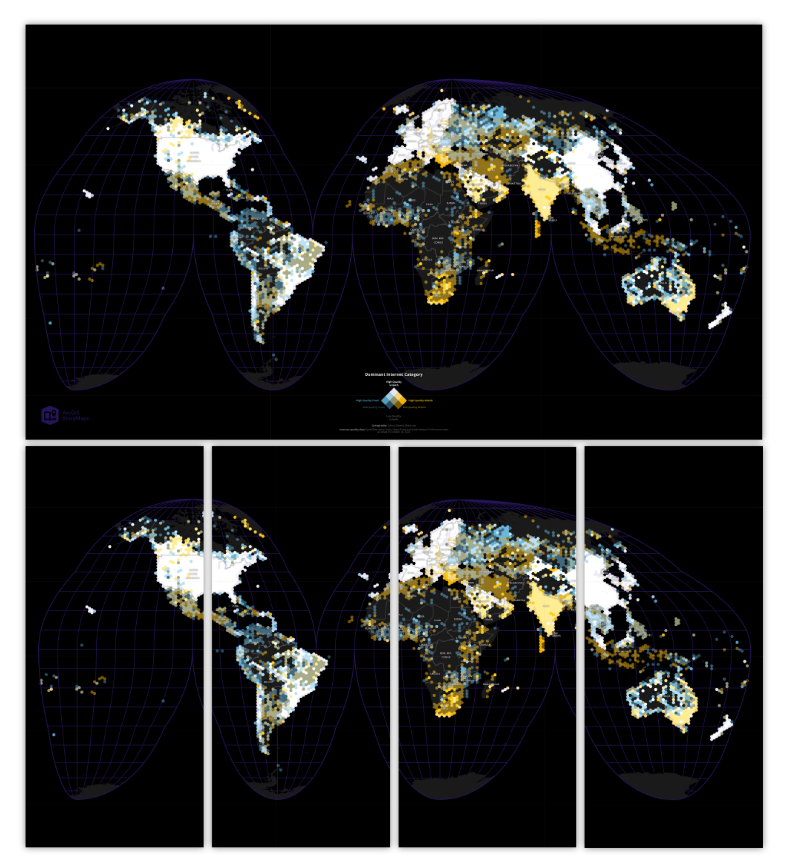
Mapping the eclipse uses map choreography and custom graphics to trace a solar eclipse’s path and impact. Library deserts uses the timeline block and custom legends in its maps to highlight areas lacking library access, advocating for better public services through engaging maps and statistics. Taking the pulse of the internet leverages interactive graphs and maps to visualize internet usage trends and the digital divide. These stories demonstrate how dynamic visual elements and innovative design techniques make news and events both engaging and informative.
Library deserts by Esri’s StoryMaps team
Mapping the eclipse by Esri’s StoryMaps team
Taking the pulse of the internet by Joshua Stevens

Travel & Tourism: Your interactive travel guide
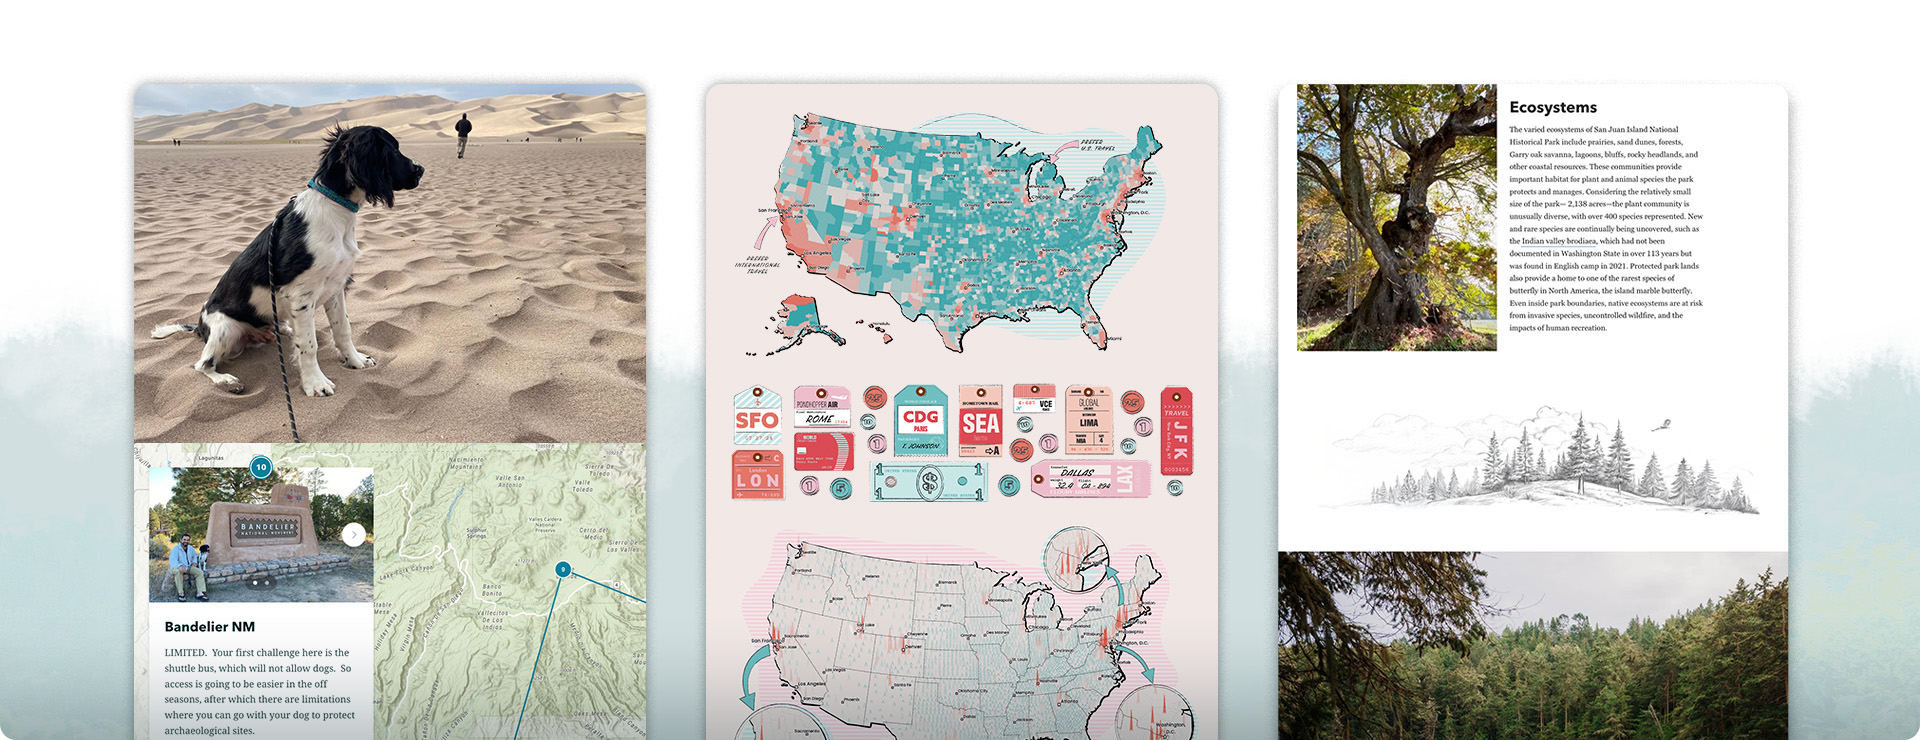
Travel stories can serve as a virtual tour guide, showcasing destinations with engaging maps, photos, and personal tips. They can also teach us more about our own travel preferences and habits.
Discovering San Juan Island uses dynamic maps, media actions, custom graphics, and audio to offer a virtual tour of its rich ecosystems and conservation efforts. Dogs and national parks uses map tours to highlight pet-friendly trails, accommodations, and parks, ensuring a great experience for travelers and their furry friends. Have money, will travel features beautiful cartography and a fun custom theme to explore how demographics and economic factors shape travel preferences across the U.S. These stories show how interactive elements, and creative designs make traveling and exploring new destinations both exciting and informative.
Discovering San Juan Island by Micah Stailey and Zak Wood
Dogs and national parks by Ryan Valdez
Have money, will travel by Esri’s StoryMaps team
Read and explore all of these stories in our
2024 collection of end of year favorites.

Adventure awaits for your devices!
Kick off the new year with a fresh look for your computer or phone! We’ve transformed some of our favorite 2024 maps and graphics into downloadable wallpapers. Spread the holiday cheer by sharing these free backgrounds with your friends and family! Download the wallpapers here.
Mapping the eclipse by Esri’s StoryMaps team
Experience the magic of a solar eclipse through interactive maps and stunning visuals.
Endemic species by Esri’s StoryMaps team
Discover unique animals around the world with immersive maps and vibrant graphics.
The finite ocean by Esri’s StoryMaps team
Dive into the ocean’s critical threats using dynamic maps and powerful imagery.
Taking the pulse of the internet by Joshua Stevens
Visualize global internet trends and connectivity through interactive maps and insightful graphics.
Little hero on the prairie by Esri’s StoryMaps team
Follow the vital role of prairie dogs in ecosystems with engaging maps and captivating visuals.
Thank you to our amazing global community of storytellers for making 2024 truly outstanding! Your feedback and creative projects have pushed ArcGIS StoryMaps to new heights, showcasing what’s possible when innovation meets passion. Your inspiring stories help millions around the world better understand our planet and work towards a brighter future.
As we look ahead to 2025, we’re excited to dive deeper into new storytelling techniques and fresh approaches. Wishing you a Happy New Year from all of us on the StoryMaps team!

Article Discussion: