Spatial Analytics and Data Science capabilities across ArcGIS have been enhanced this fall with new tools and optimized experiences. Do more to account for uncertainty within data in ArcGIS Pro, streamline repetitive analysis tasks in ArcGIS Online, and leverage ArcGIS for Microsoft Fabric to process large datasets. Read on to learn about these updates and how they can help you unlock new insights from your data while improving your workflows.
What’s new in spatial analysis?
Listed here are some of the major improvements and innovations in this fall’s releases:
- ModelBuilder available in ArcGIS Online
- Use capabilities for assessing uncertainty
- Accelerate AI-workflows with foundational models
- Enhance zonal analysis workflows
- Streamline your workflows for creating network evaluators
- Improved graph data visualization and analysis
- Generate 3D lines using point cloud data
- Schedule web tools
- Elevate your workflows with ArcGIS for Microsoft 365
And more…
1. ModelBuilder available in ArcGIS Online
You can now try ModelBuilder within Map Viewer to visually connect analysis tools and data. This helps you create models for visualizing, documenting, and automating your analysis workflows. With this no-code approach, you can streamline repetitive analysis tasks, reduce errors, and enhance the transparency and reproducibility of your analyses.
ModelBuilder is available as a public beta in ArcGIS Online through the Early Adopter Program.
To participate in the beta program, you must have an ArcGIS Online organizational account that meets the requirements to use ModelBuilder.
2. Use capabilities for assessing uncertainty
The Assess Sensitivity to Attribute Uncertainty tool in ArcGIS Pro introduces new capabilities for effectively evaluating how analysis results may change when the values of one or more input variables are uncertain. By simulating input data, the tool presents variations in results through layers, charts, and pop-ups, helping you assess the stability of the results based on the input variables’ level of uncertainty. This helps you determine whether the model or analysis process is fit for its intended purpose.
The tool conducts sensitivity analysis by repeatedly generating simulated datasets. It uses the original analysis variable and its associated measure of uncertainty (e.g. margin of error) to create these datasets, which accurately reflect plausible real-world scenarios.

This process allows for multiple runs of the analysis to assess sensitivity to uncertainty. If the simulation results closely align with the original findings, this can provide additional degrees of confidence in the model’s reliability. However, if considerable differences are found, caution is advised in drawing conclusions.
3. Accelerate AI-workflows with foundational models
Using the Train Deep Learning Model tool within ArcGIS Pro, you can now fine-tune geospatial foundational models such as Prithvi, designed for tasks like crop classification and flood segmentation, as well as ClimaX, which assists with forecasting and climate modeling. The Train Deep Learning Model tool provides a guided workflow to assist you in training deep learning models using the data you have collected.
Additionally, you can now integrate external, third-party Large Language Models (LLMs). These include open-source LLMs such as Mistral, as well as commercial LLMs. These models make it possible for more accurate and efficient AI-powered text analysis using fewer training examples and less compute resources.
4. Enhance zonal analysis workflows
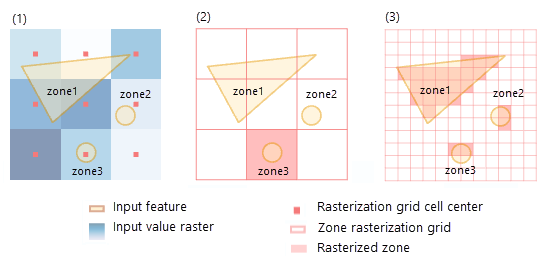
The new Zonal Characterization tool in ArcGIS Pro enables you to easily summarize different raster datasets within specified zones, which can significantly aid in workflows such as evaluating the suitability of candidate sites for planting specific types of plants or crops.

A zone is defined as all areas in the input that share the same value, and these areas do not need to be contiguous. With a single run, the Zonal Characterization tool can calculate different statistics for multiple rasters and reports the results as a table. This provides a comprehensive overview for informed decision-making for agricultural use cases and much more.
5. Streamline your workflows for creating network evaluators
In ArcGIS Pro 3.4, the Field Script Evaluator and Element Script evaluator dialog boxes have been enhanced with aids for writing evaluator expressions. Script evaluators enable you to craft custom and domain-specific logic for assigning values to network attributes and refining how network traversability is modeled.
Field Script and Element Script, two types of evaluators, use expressions to calculate the value that gets assigned to each element. Field Script evaluators utilize fields from network sources, while Element Script Evaluators use parameters on the same attribute or values from other network attributes.
6. Improved graph data visualization and analysis
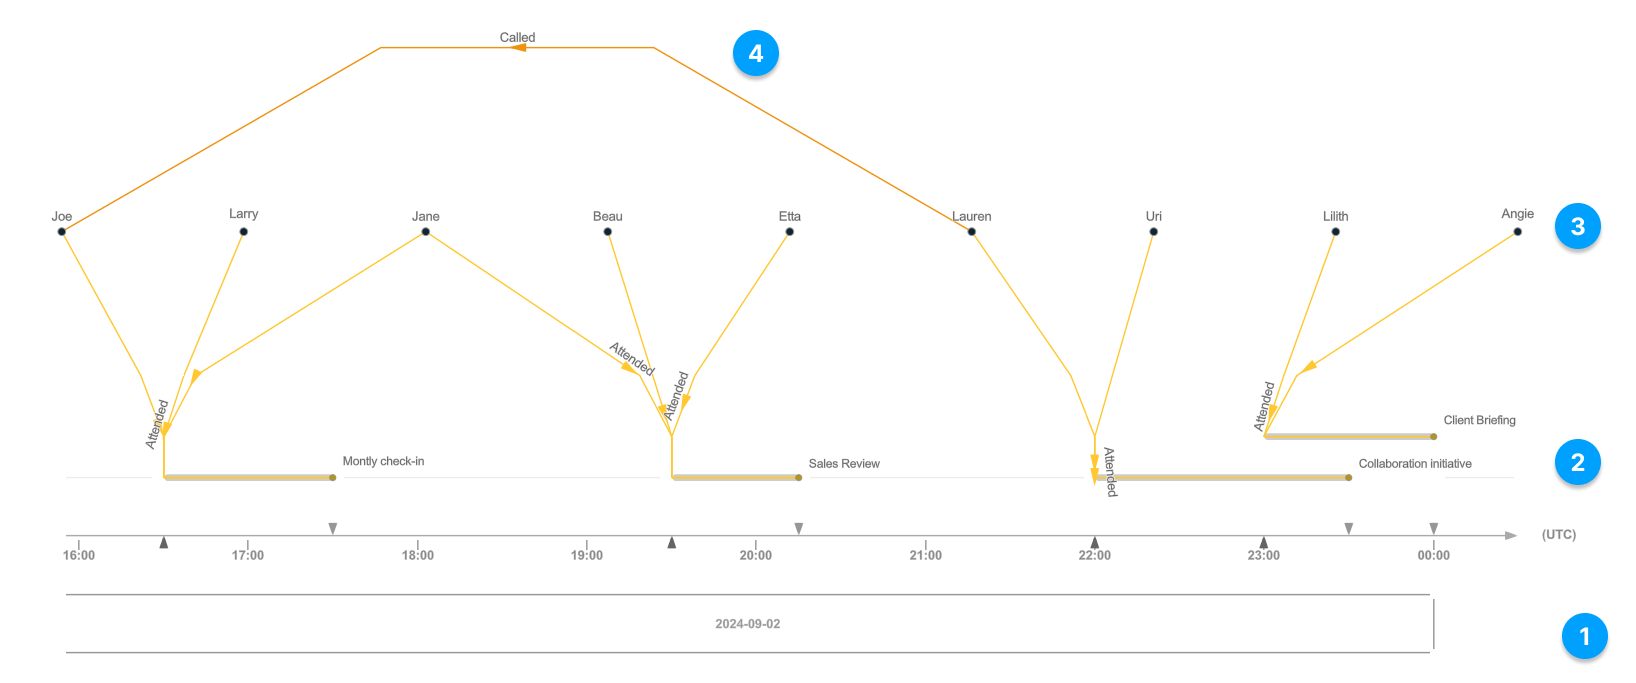
The latest release of ArcGIS Knowledge introduces enhancements for graph analytics, designed to improve data visualization and analysis capabilities. Here are the key updates for this release:
- Time-Based Data Exploration: Present your data in dynamic timeline views, with and without time properties. This update allows you to customize various settings, such as the direction of the time axis, the time zone, and the positioning of entities and relationship.

- Improved visualization for spatial vs. non-spatial data: Quickly toggle non-spatial entities on and off within a graph. Save visibility effects, such as blur and shadow, and apply these settings to all spatial or non-spatial data elements.
- Query parameters for saved queries: Obtain specific insights without the need to learn the graph query language. For example, effortlessly switch from Supplier A to Supplier B within a saved graph query without needing to understand or update the full query syntax. Additionally, the latest update enables you to open and explore their knowledge graphs directly in a web browser.
For more information about the latest enhancements to ArcGIS Knowledge, read this blog.
7. Generate 3D lines using point cloud data
With the latest release of 3D Analyst, users in industries like transportation can now generate 3D lines representing rails or centerlines using point cloud data. This is made possible through deep learning libraries and point cloud data that has been pre-classified as rails. By automating this process, you can improve the efficiency of transportation workflows and better showcase important transportation features in 3D models.
8. Schedule web tools
Within the ArcGIS Enterprise 11.4 release, you can now use ArcGIS Pro to schedule web tools that you own or manage, enabling automatic updates of datasets and refreshing analysis workflows. The recurrence options are flexible, allowing you to set schedules by the minute, hourly, daily, or monthly – so you can easily schedule a web tool to run at a later time or execute on a recurring basis based on a list of preset parameters.
9. Elevate your workflows with ArcGIS for Microsoft 365
The latest release provides updates and enhancements to ArcGIS for Microsoft 365, that is designed to boost your data management, editing, visualization, collaboration and automation within the Microsoft environment. Here are the key updates for the December release:
- ArcGIS for Excel allows adding data in Excel spreadsheet rows in attribute tables and creating point features on the map, streamlining data editing and visualization directly within Excel.
- ArcGIS for SharePoint allows geoenablement of SharePoint lists using your organization’s feature layers, streamlining data integration and visualization.
- ArcGIS for Teams introduces Single Sign-On with Microsoft identity integration, simplifying access and enhancing security for seamless collaboration.
- ArcGIS for Power BI improves the Join Layer Process to streamline data integration, enhancing BI reports with authoritative GIS and business data.
- ArcGIS Connectors for Power Automate enables batch handling of features in insert or update workflows, increasing efficiency and automation for managing features.
To learn more about all the release updates and how they can enhance your workflows, please read the blog.
And more…
The spatial analytics updates across ArcGIS also include:
- Comparing trends using Combo Charts in ArcGIS Pro
- Improving the predictive power of your models using spatial components
- Quantifying correlations in spatially clustered data
- Improved productivity for imagery focused GeoAI workflows
- New Python API support for network analysis, GeoAI models, and web tools
From automation enhancements, to new visualization options, to innovations in GeoAI and predictive analytics, spatial analytics across ArcGIS enable you to gain deeper insights and harness the full potential of your geospatial data.
For more information, check out the blogs below and we encourage you to try out the lates features.


Article Discussion: