The Spatial Analyst extension introduces new and enhanced capabilities in ArcGIS Pro 3.4. This release gives you new tools for surface and zonal analysis as well as improved capabilities for density and distance analysis. Several tools for hydrology analysis have improved performance. Some new help content is available for solar analysis. Read on to learn more.
Where to get it?
ArcGIS Pro 3.4 was released in November 7, 2024.
For an overview of the changes that have been made for this release, have a look at the ArcGIS Pro Update (November 2024) blog post and video.
What’s changed for Spatial Analyst?
Here are the primary areas of improvements over the last release:
- Density analysis
- Distance analysis
- Hydrology analysis
- Solar analysis
- Surface analysis
- Zonal analysis
1. Density analysis
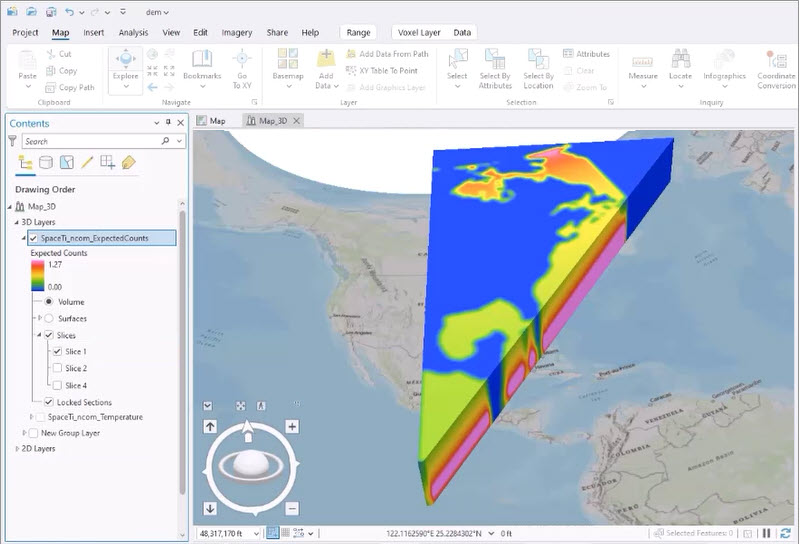
The Space Time Kernel Density tool can now create an output voxel layer. This output represents the density of the input points as magnitude per-unit-area across multidimensional space and time. What does that mean? You can now interactively explore the results as a 3D volumetric visualization!
Have a look at the following screenshot for an example of what you can do with this new capability.

The output must be a netCDF raster, which you create by specifying “.nc” as the filename extension for the Output Raster parameter. Some new Usages help guide you through the process of creating the voxel layer and adding it to a scene.
We also improved some of the parameter descriptions for the tool, as well as the How Space Time Kernel Density works help topic.
2. Distance analysis
Around the world distance:
Do you perform distance analysis at a global extent? Several tools can now calculate least cost paths around the entire world! The Distance Accumulation, Distance Allocation, Optimal Path as Line, and Optimal Path as Raster tools no longer treat the edge of the map as a barrier. This improvement is available when the Distance Method parameter is set to Geodesic, and the data is in either a geographic coordinate system or a cylindrical projection.
Zero or negative values for Cost Distance:
A usability improvement for distance tools that can use a Cost raster as an optional input. These tools are: Distance Accumulation, Distance Allocation, Optimal Corridor Connections, and Optimal Region Connections.
Since the cumulative cost algorithm is a multiplicative process, calculating accumulative cost correctly is problematic if any cost values are zero or negative. In earlier releases, the tools processed cells with these values as NoData. Now, the tools treat these values as very small positive values. This allows the use of Cost rasters that contain cells of zero or negative values directly in workflows, without having to remove them in a pre-processing step.
Raster Functions:
The same update to handle the edge of the projection at a global extent as the corresponding geoprocessing tools was applied to the raster functions: Distance Accumulation, Distance Allocation, and Optimal Path As Raster.
For the Distance Accumulation and Distance Allocation raster functions, the Vertical Factor parameter now includes Hiking Time and Bidirectional Hiking Time options. This matches the the options that were added to the equivalent geoprocessing tools in ArcGIS Pro 3.3.
3. Hydrology analysis
For hydrology analysis, we made notable performance improvements to the Basin, Flow Length, Snap Pour Point, and Stream Order tools. A future blog post will cover in more detail the types of gains achieved by these tools.
4. Solar analysis
Do you use the Raster Solar Radiation and Feature Solar Radiation tools in Spatial Analyst? We added several new help topics to better explain how to use these tools. The Analyze solar radiation topic provides some general information on solar radiation is calculated for a surface on the Earth or the Moon. To learn more about using these tools and how the calculations are performed, read the How Feature Solar Radiation works and How Raster Solar Radiation works topics.
5. Surface analysis
Three new geoprocessing tools are available for performing surface analysis. One application for these tools is to extract and evaluate information about elevation-derived hydrography directly in ArcGIS Pro in a more integrated and seamless workflow than was previously possible.
Feature Preserving Smoothing
The Feature Preserving Smoothing tool smooths out a surface raster by removing small scale surface variation (noise), while preserving the meaningful landscape features. It has several parameters that gives control over the amount and type of smoothing you want to apply.
Multiscale Surface Difference and Multiscale Surface Percentile
Two new tools identify specific landscape characteristics of a surface raster at multiple scales. In this context, the different scales represent different neighborhood distances from each input cell.
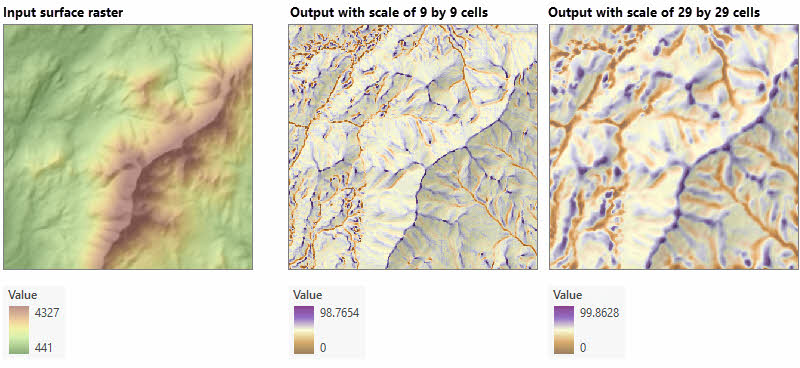
The Multiscale Surface Difference tool identifies the maximum difference from the mean for each input cell across multiple scales. The Multiscale Surface Percentile tool identifies for each input cell the most extreme percentile value.
For both tools, an optional output raster identifies the specific scale where that value occurred. You can also control how the increase in neighborhood distance behaves with parameters for the minimum and maximum values, as well as the increment between the scales.
The following illustration shows the result of applying two different scale settings to a surface raster with the Multiscale Surface Percentile tool.

6. Zonal analysis
The new Zonal Characterization tool summarizes the values of multiple input rasters for a zone input. The primary output is a table where each record represents an input zone, and each field the resulting value of the specified statistics the cells that fall within that zone.
While this tool supports the same types of statistics as the Zonal Statistics as Table tool, it offers several advantages. In one run of the tool, it can calculate several different statistics for the same value raster, the same statistic for multiple value rasters, or any combination thereof. You can also choose to create a new output feature class that joins the output table to the input zone data.
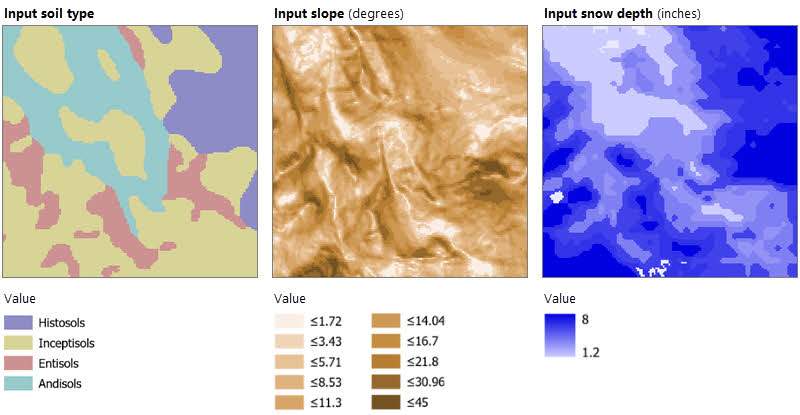
For example, say you have a workflow for water level conservation where you want to know the average slope, the total accumulation of snow, and the maximum snow depth for a soil type map. The images below show the inputs for the tool followed by the resulting output table.

The output table:

Summary
That covers the new things you can do, and the improvements made to the Spatial Analyst toolbox for ArcGIS Pro 3.4. Download the update and try them out!
To keep up to date with new posts as they become available, bookmark this link:
For additional questions and discussion related to Spatial Analyst, see here:
- https://community.esri.com/t5/arcgis-spatial-analyst-questions/bd-p/arcgis-spatial-analyst-questions
Here are some starting points if you want to learn more about Spatial Analyst:
- Learn more about the Spatial Analyst Extension product
- What is the Spatial Analyst Extension
- The Spatial Analyst toolbox in ArcGIS Pro
Visit the ArcGIS Pro page or the What’s New documentation for more information about this release. If you have any questions, you can post in the ArcGIS Pro board in Esri Community.

Article Discussion: