The March 2020 update to Survey123 brings exciting new features as well as a good set of fixes and other enhancements. The update is available across all supported platforms as well as the Survey123 website. Here are the highlights:
Survey update notifications in the Survey123 field app
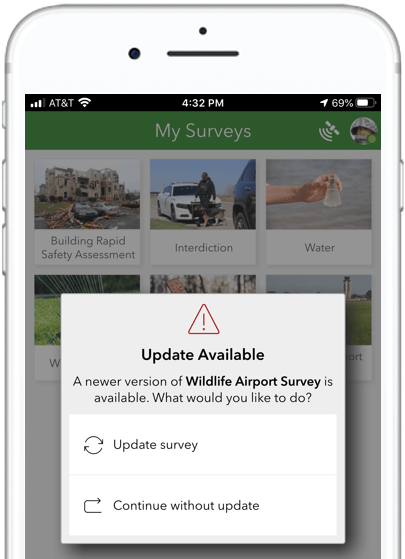
Despite doing your best to nail down the design of your smart forms, I am sure at some point you had to make adjustments to your surveys in the middle of a data collection effort: updates on choice lists, refinements in data validation rules, rewording of questions…
With Survey123 designer and Connect you can easily make these changes but how do you ensure field users who already had downloaded your survey do not get out of sync?
With this release, the Survey123 field app lets you know if a survey in your device needs an update. This check happens automatically when the application starts, when a new user signs in and when a survey is opened. Users can also manually check for updates by simply dragging down on the survey gallery.
New Map question in the Survey123 web designer
Survey123 web designer lets you visually create location-aware smart forms. Once a form is published, you can submit data to it from the Survey123 mobile app, or directly from a web browser.
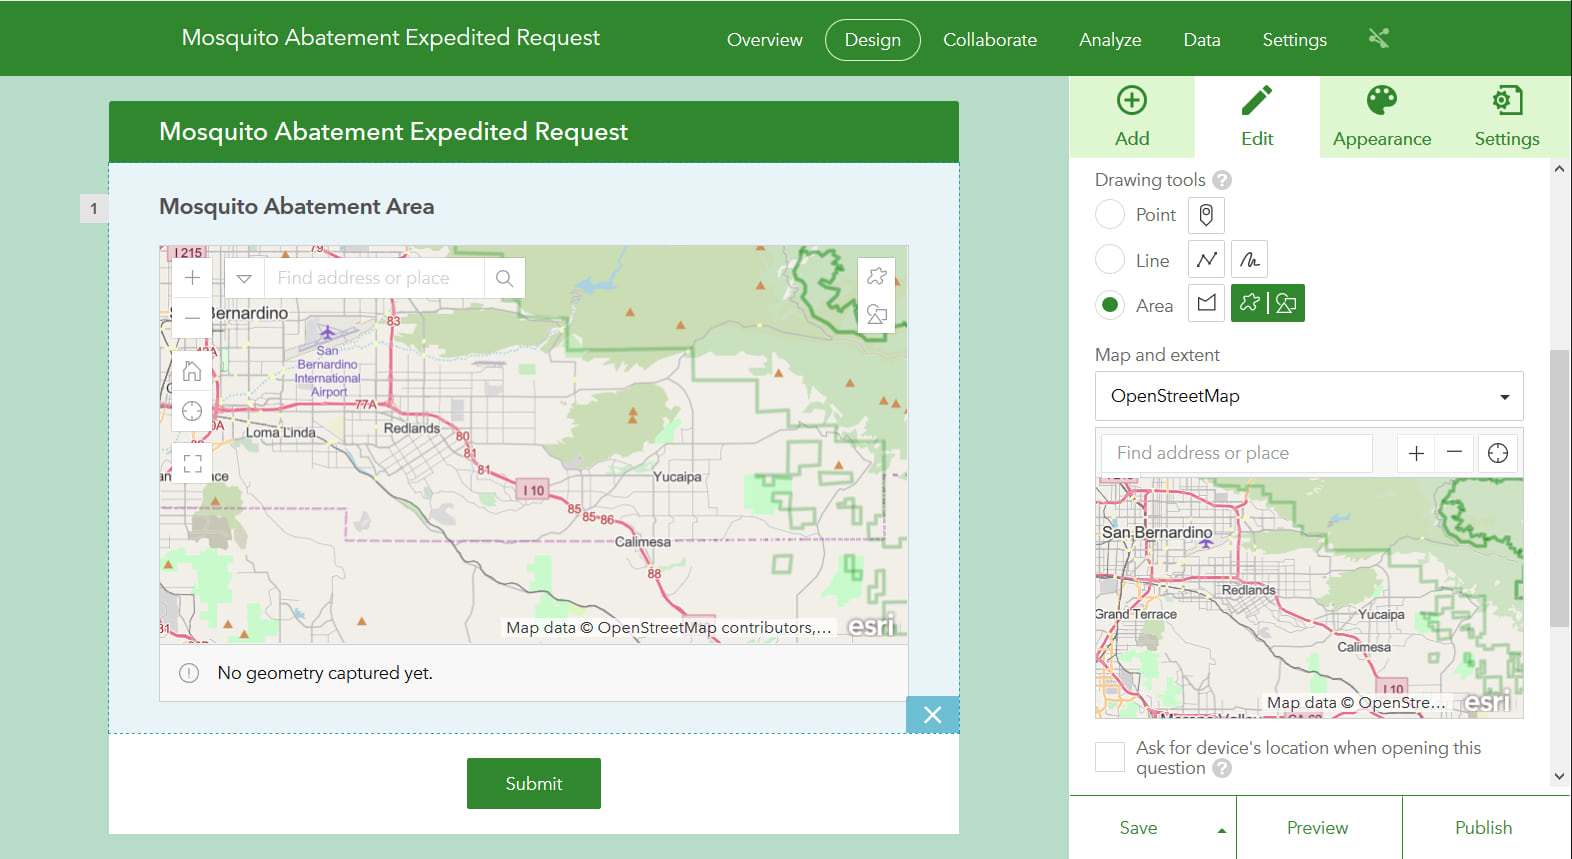
Many people love using the web designer because it is extremely easy to use and powerful. In this update we have added a new Map question type, replacing the geopoint question we had in previous releases. The new Map question lets you capture a location, like before, but it also includes options to capture either a line or a polygon from your form.
Select the Map question type, drag and drop into your design, then pick the drawing tool of choice: point, line or area… Simple!
Survey123 website links
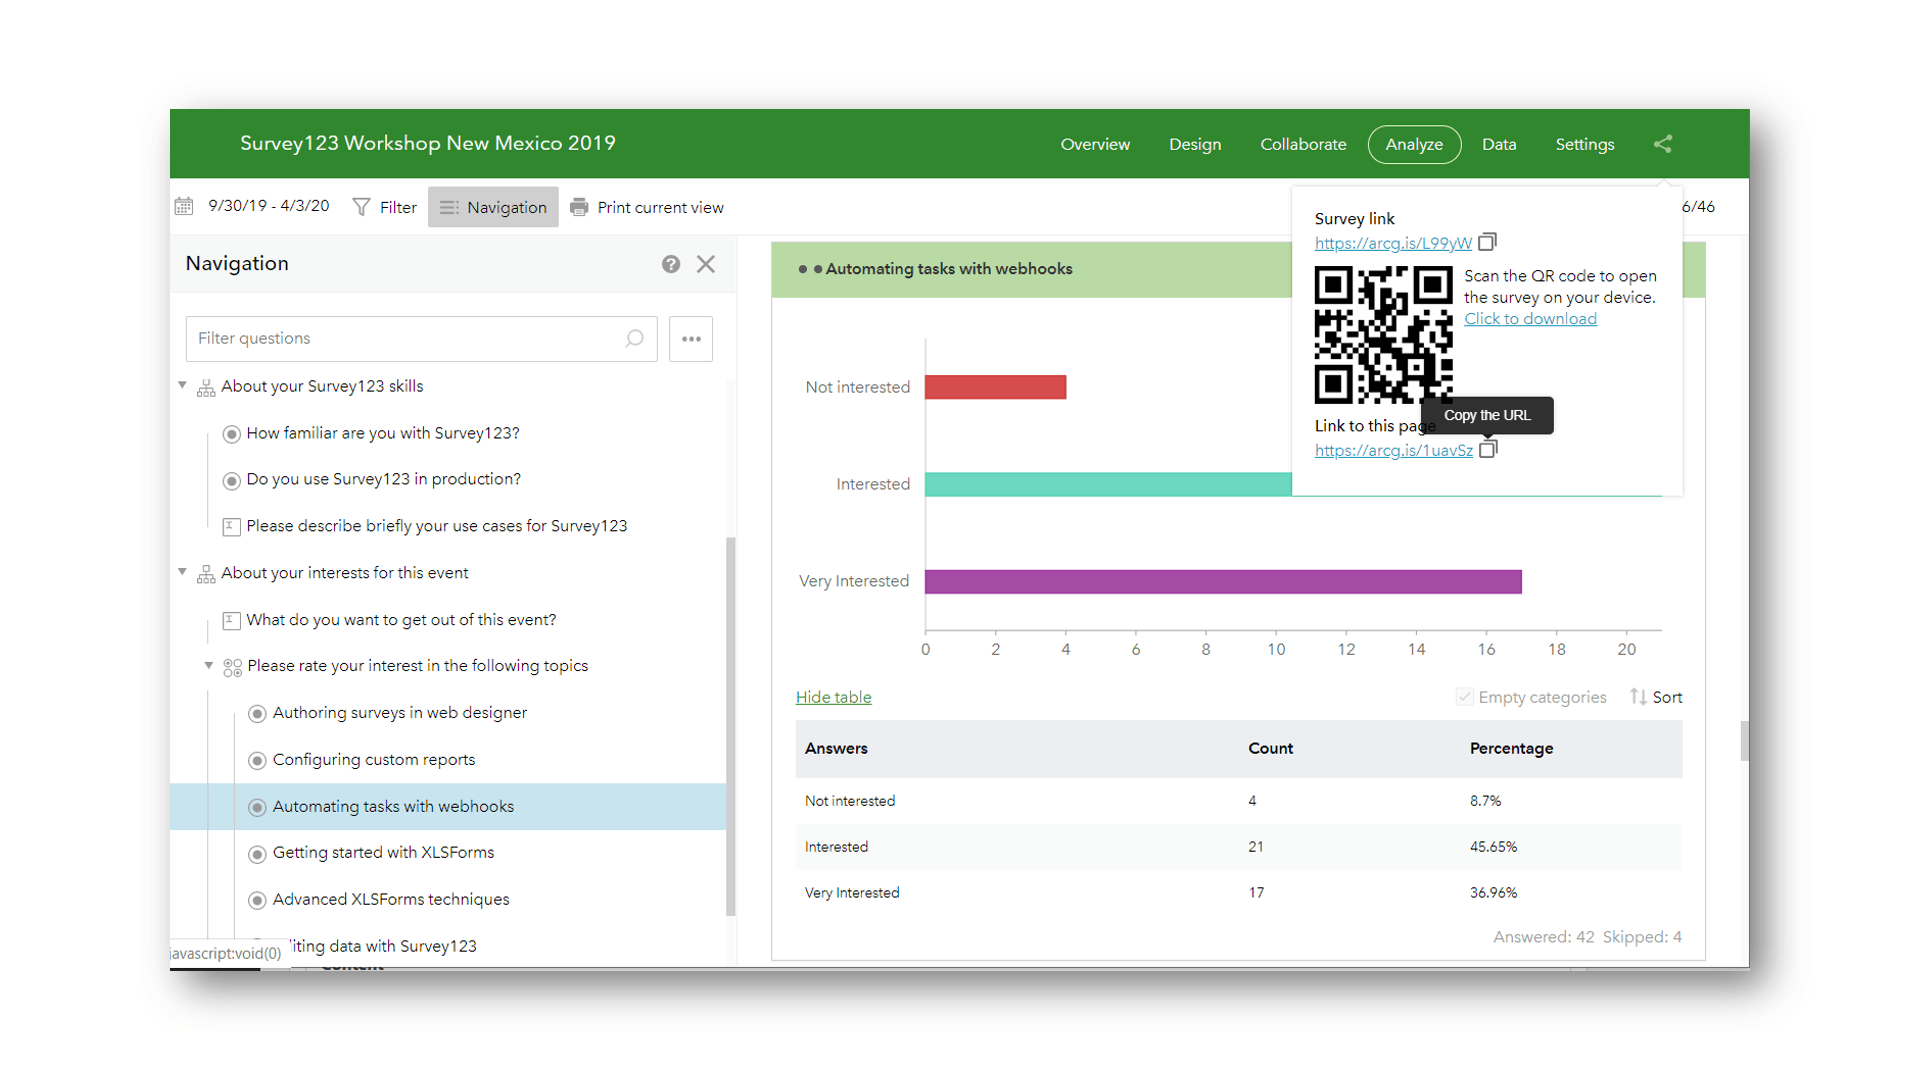
The Survey123 website includes great out of the box survey visualization and analysis tools. You can inspect survey records one by one and navigate all individual responses, you can filter survey records and visualize your data as a table, map or form. Through the Survey123 website you can also look at trends in your data, filtering and aggregating your survey results and choosing between different visualizations.
After your exploratory work, once you are into something, you can now take a snapshot of your survey result visualization as a link. Next, you can bookmark it or share the link with others. Next time the link is accessed, the Survey123 website will honor all your visualization settings and filters against the live data from your survey!
To learn more, read the Survey123 website links GeoNet post.
New Survey123 web app JavaScript API
The Survey123 web app JavaScript API is designed to help web developers more easily embed, style and interact with live Survey123 smart forms within their applications. It is a simple, yet powerful way to integrate Survey123 within larger business workflows. Through this API, you can choose at runtime what survey you want to display and how it will fit within your web application. You can bidirectionally send messages between your form and the web application.
To learn more about this API check the Introducing the Survey123 Web App JavaScript API blog post.
Other enhancements and fixes
Above I described 4 new features in this release but there is quite a bit more in it. To learn about them check out our 3.9 release announcement in GeoNet.


The new survey updates look great. However something seems to have happened to the notes questions within the web creator. I have notes that come up as a warning only when no is selected in the previous question. Now these notes are viewable before the previous question is answered. Yes it is faded to give it a somewhat hidden look, however because the warning notes are red and the rest of the text is black, it really stands out even as a faded red. I’ve checked my question rules and have created a test mimic of these questions and notes… Read more »
Hi Naomi. Thanks for your comment. I suggest you contact Technical Support from our local distributor in New Zealand at: https://www.eagle.co.nz/gis-solutions/gis-support This will help us diagnose the specifics of your issue. Thanks!