12 new lessons now available!
Evaluate Equitable Drinking Fountain Distribution
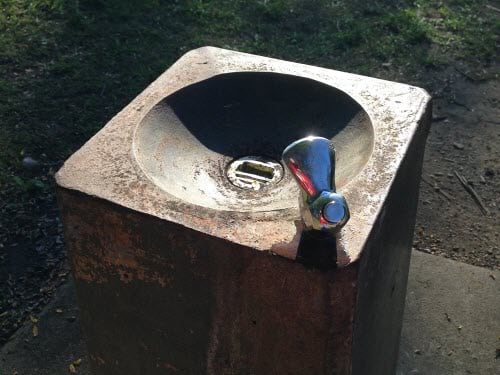
Collect drinking fountain locations with Collector for ArcGIS and analyze their condition.
About the Author: Charlotte Smith, PhD, is a teaching professor at the School of Public Health at University of California, Berkeley.
———————————————————
Update Real-Time Data with Python

Automate a Python feed routine to show the latest data on coral bleaching.
About the Author: Gonzalo Espinoza-Davalos is an expert on the integration of global and large datasets into applied research, especially in the fields of water resources and environmental engineering. He is part of the Living Atlas of the World team at Esri and has a keen interest in Web GIS, data science, and education.
———————————————————
Digitize Your Neighborhood with Community Maps

Use the Community Maps Editor to practice adding detail to basemaps.
———————————————————
How to Use Citizen Problem Reporter

Learn how government agencies can use Citizen Problem Reporter to collect non-emergency problem reports from the public.
———————————————————

Locate a proposed timber harvest and predict how it will change habitat conditions for ruffed grouse.
———————————————————

Use global elevation data to predict how storm surges will flood coastlines.
———————————————————
Find Areas at Risk from Aquifer Depletion

Find areas that are most reliant on the Ogallala Aquifer.
———————————————————
Estimate Access to Infrastructure

Measure how much of the rural population can reach all-season roads in Shikoku, Japan.
———————————————————
Share the Story of an Expedition

Build a StoryMap about a scientific expedition to a Guatemalan volcano.
———————————————————
Choose Test Markets for a Start-Up

Assess potential test markets for a new entrepreneurial bicycle service using spatial and visual analysis.
———————————————————
Capture Assets with Street Smart by CycloMedia™

Use 360-degree panoramic images to measure, collect, and update assets.
———————————————————
Making a “Top 10 Locations” Map with ArcGIS Maps for Adobe Creative Cloud

Turn a list of locations into an eye-catching map.

Commenting is not enabled for this article.