Learn ArcGIS published 14 new learning resources this month:
Getting Started Path for Teachers
Most educators ask: Where do I begin? Follow this beginner path to build your confidence with online mapping tools.
![Getting Started Path for Teachers Getting Started Path for Teachers](https://www.esri.com/arcgis-blog/wp-content/uploads/2018/12/teach-with-gis-starter-path-1.jpg)
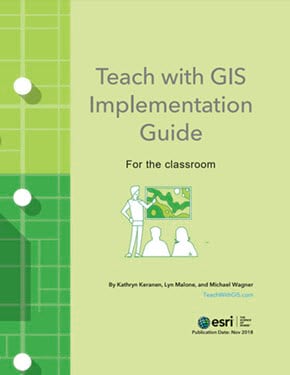
Implementation Guide for the Classroom 2nd Edition
New & improved design with updated content to reflect the latest release of ArcGIS Online
![Implementation Guide for the Classroom Implementation Guide for the Classroom](https://www.esri.com/arcgis-blog/wp-content/uploads/2018/12/implementation-guide-classroom-2.jpg)
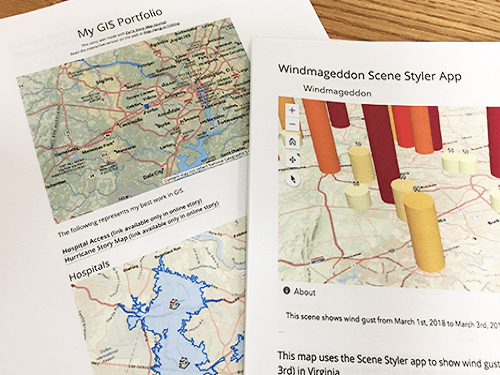
Assess Student Work in a Portfolio
Build a GIS Portfolio of maps and web applications to assess student work in online, printed, or PDF maps.
![Assess Student Work in a Portfolio Assess Student Work in a Portfolio](https://www.esri.com/arcgis-blog/wp-content/uploads/2018/12/Portfolio-1.png)
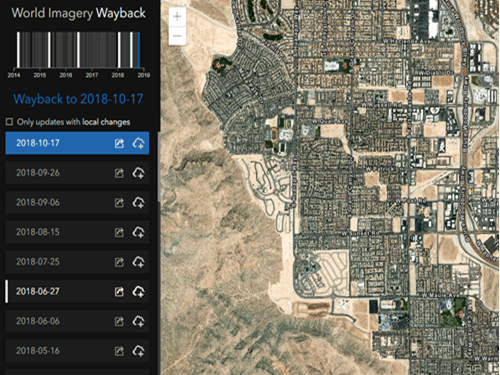
Wayback Imagery: Fluctuating Lakes
Use the Wayback Imagery app to study the fluctuation of water levels in selected world lakes.
![Wayback Imagery: Fluctuating Lakes Wayback Imagery: Fluctuating Lakes](https://www.esri.com/arcgis-blog/wp-content/uploads/2018/12/1-wayback-1.png)
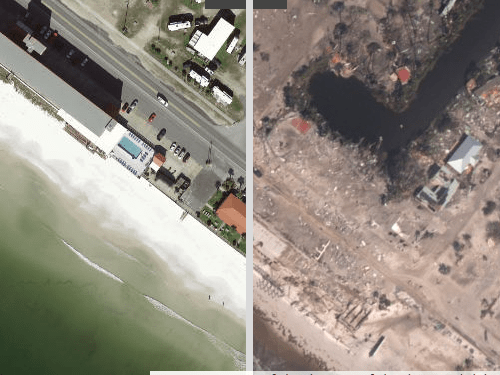
Hurricane Michael: Before and After Images of Destruction
Using a NOAA Web Map Tile Service to obtain and compare imagery of Mexico Beach, FL before and after Hurricane Michael.
![Hurricane Michael: Before and After Images of Destruction Hurricane Michael: Before and After Images of Destruction](https://www.esri.com/arcgis-blog/wp-content/uploads/2018/12/michael-1.png)
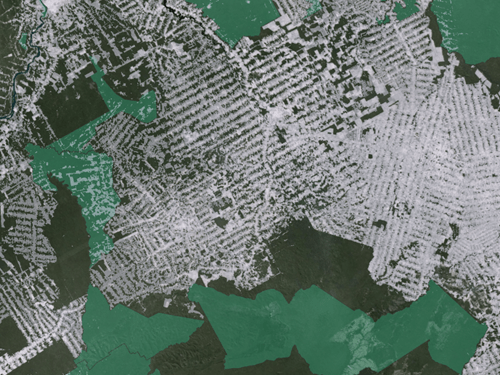
Get Started with ArcGIS Pro (New Scenario!)
Map the impact of roads on deforestation in the Amazon rainforest.
![Get Started with ArcGIS Pro Get Started with ArcGIS Pro](https://www.esri.com/arcgis-blog/wp-content/uploads/2018/12/2-card-1.png)
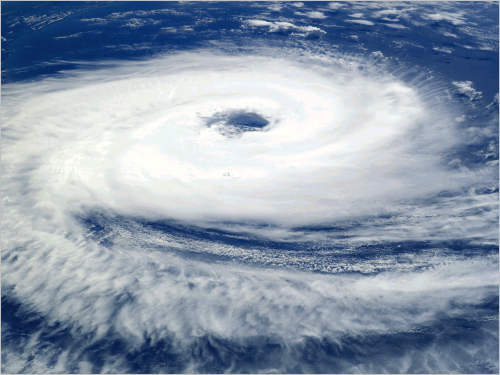
Predict Weather with Real-Time Data
Explore real-time weather data, make predictions, and interpolate surfaces.
![Predict Weather with Real-Time Data Predict Weather with Real-Time Data](https://www.esri.com/arcgis-blog/wp-content/uploads/2018/12/predict-weather-with-real-time-data-gallery-1.png)
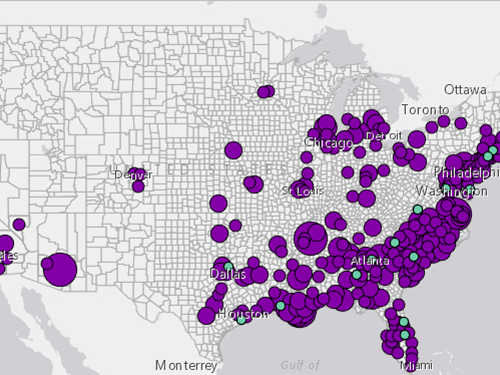
Map Breast Cancer Differences by Ethnicity
Learn about the disparity in breast cancer mortality rates.
![Map Breast Cancer Differences by Ethnicity Map Breast Cancer Differences by Ethnicity](https://www.esri.com/arcgis-blog/wp-content/uploads/2018/12/breast-cancer-thumbnail-1.png)
Policy Mapping – Improve Newborn Health
Identify counties in need of low birth weight intervention.
![Policy Mapping - Improve Newborn Health Policy Mapping - Improve Newborn Health](https://www.esri.com/arcgis-blog/wp-content/uploads/2018/12/policy-mapping-improve-newborn-health-gallery-1.png)
Visualize Predicted Economic Growth
Use a 3D image to show projected job and housing growth.
![Visualize Predicted Economic Growth Visualize Predicted Economic Growth](https://www.esri.com/arcgis-blog/wp-content/uploads/2018/12/card-2.png)
Try Collector for free – no account or setup required. Capture a digital version of your local park.

![Get Started with Collector Get Started with Collector](https://www.esri.com/arcgis-blog/wp-content/uploads/2018/12/IMG_0434-500x375.jpg)
Create your first map for data collection: use templates and make a layer, put it on a map, and collect data in the field using Collector.
![Make Your First Collector Map Make Your First Collector Map](https://www.esri.com/arcgis-blog/wp-content/uploads/2018/12/1-IMG_4994-500x375-1.jpg)
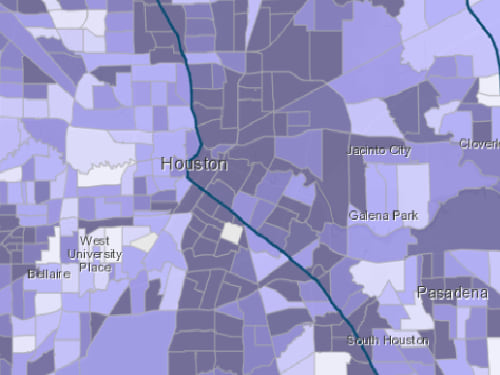
Get Started with ArcGIS Enterprise
Create and share an evacuation map to prepare for an incoming hurricane.
![Get Started with ArcGIS Enterprise Get Started with ArcGIS Enterprise](https://www.esri.com/arcgis-blog/wp-content/uploads/2018/12/GetStarted-1.png)
And finally, Learn ArcGIS lessons are now available as ArcGIS Online items!
Search the ArcGIS Learn Lessons group in the Learn Org to add items to your own Organizations.
Please feel free to share with teachers, friends, or colleagues!
Commenting is not enabled for this article.