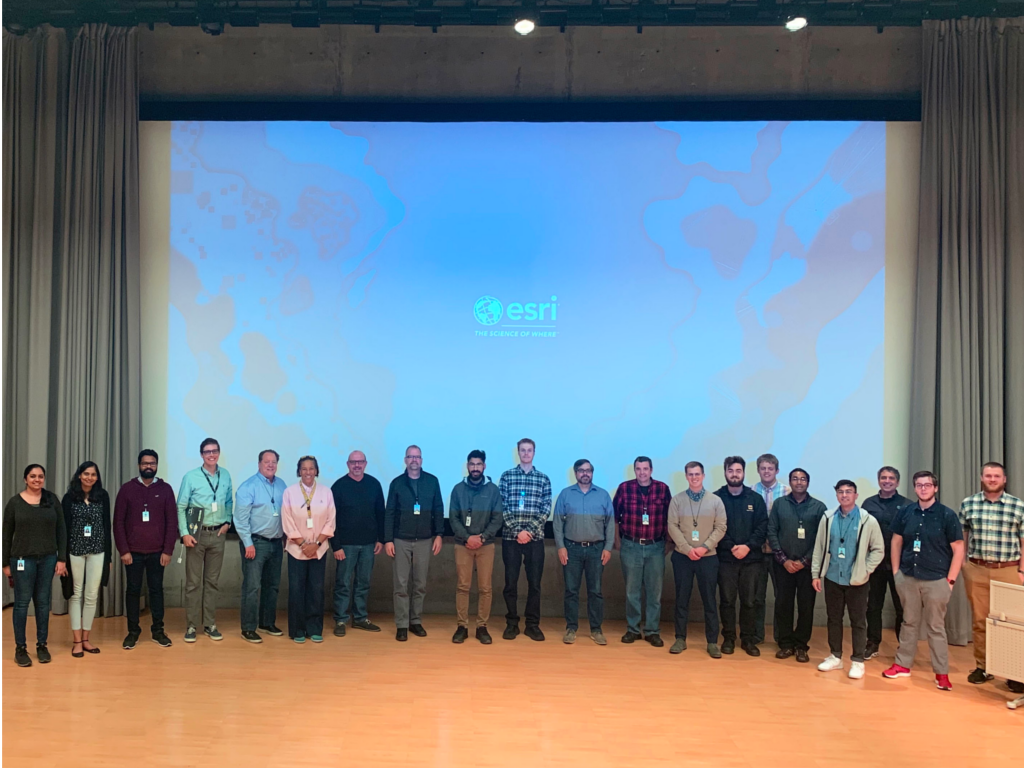
Esri sponsored its fourth annual internal Hack the Map hackathon on January 10-13, 2020. The hackers were set loose on the ArcGIS platform to create location-aware solutions that target one of three audiences: consumers, enterprise users, or civic governments and their constituents. This is a global event that is an opportunity for internal staff, distributors, and partners to take a step back from their daily work routine and use the SDKs and APIs we work on to build the app of their dreams.
This year’s event had 25 participants organized into 6 teams. After the hacking period concluded, each team prepared a 5-minute presentation to demonstrate their app and solution to the judges. The judging panel included Clint Brown, Jim Herries, Jim McKinney, and Dawn Wright. A trophy was awarded to the overall winning team and lots of Esri swag was won by the category winners.
Our incentive for the hackathon is to use our APIs and services as our users do. This helps us identify issues while exercising our APIs in new ways. We reuse these projects as sample code, demos, open source projects, and maybe even the start of a new product. Following is a short summary of this year’s projects. These are all open source projects. If you find an interesting or useful project, contact the winners and inquire about their solution. For more information visit the hackathon website.
Sonderfly
Overall winner
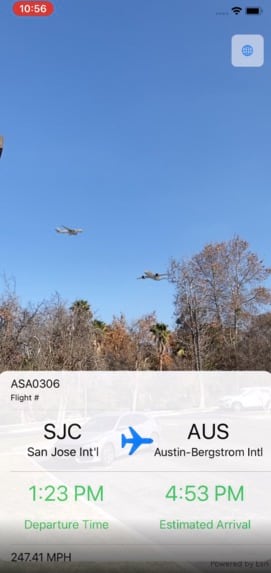
Many of us look up at the sky and wish we had the power to know more about each plane we see. Sonderfly is an augmented-reality mobile app to help us do just that. Sonderfly gives users a real-time AR view of nearby aircraft. It allows them to view information about each aircraft, such as its flight number, airports of departure and arrival, velocity, and altitude. With Sonderfly, we are using the power of ArcGIS and augmented reality to inform, inspire, and indulge our natural curiosity about what’s above us.
The tech: ArcGIS Runtime SDK, AR Toolkit, ArcGIS Enterprise, ArcGIS Notebook Server
The team: Zack Allen, Ed Carroll, Nathan Castle, Olivia Iannone, Scott MacDonald, Matthew Nelson
Evolution of Life
1st place, consumer
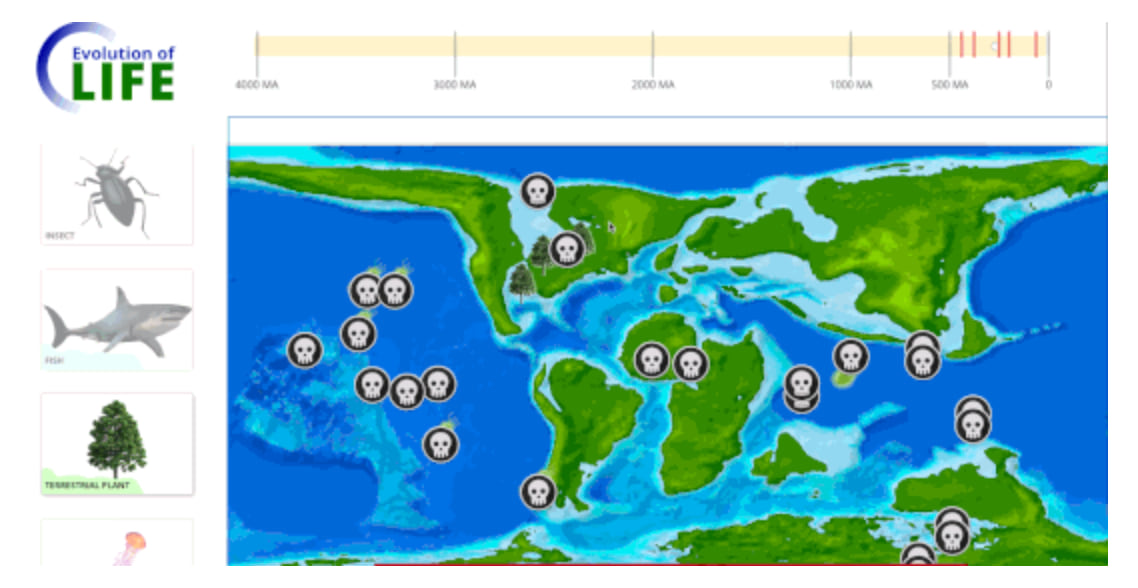
An interactive and educational experience that gets people to think about the magnitude of Earth time scales, the evolution of life, and the human impact towards the ongoing sixth mass extinction. This interactive web page walks users through the 4 billion year history of Earth by allowing them to populate the Earth with new life as it evolves. Users gain insight into concepts such as continental drift, historic mass extinctions, and timescale.
The tech: ArcGIS API for JavaScript, ArcGIS Image Services
The team: Indhu Kamala Kumar, Amoli Mehta, Nimish Pawar, David Vitale
ArcBoomer
1st place, civic
Older populations in the U.S. are growing. We rely on paid caregivers to watch over our elders. However, the costs for long-term care are expensive. ArcBoomer provides two solutions to help address the growing population of elderly who need long-term care: 1. create maps for policy makers to determine how to subsidize costs of long-term care, and 2. help people find affordable insurance plans.
The tech: ArcGIS Experience Builder, ArcGIS Online, ArcGIS Pro, React, TypeScript, Medicare Marketplace API
The team: Amit Sen
GeoBucketlist
2nd place, consumer
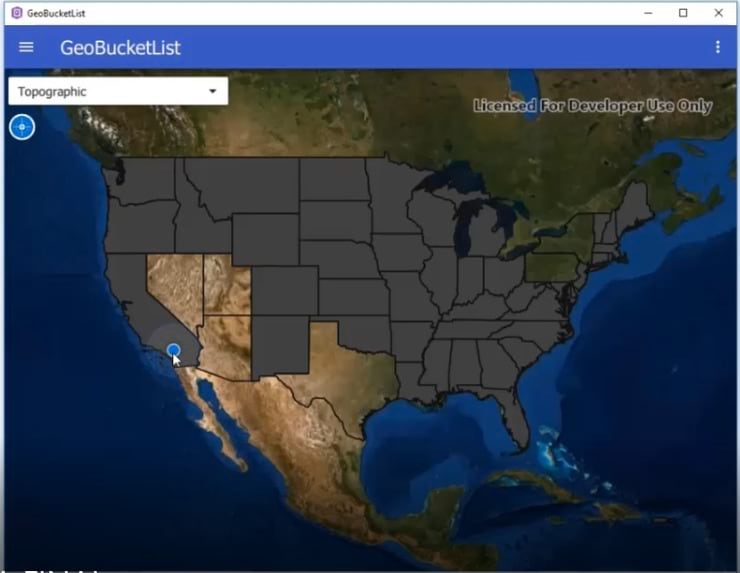
The GeoBucketList is a mobile application to track your geography “bucket list” – where you have been and where you want to go. The GeoBucketList becomes an electronic journal to record the experiences of places that you have been. Initially, the bucket list geographies are masked (kind of like a scratchers game) to obscure the basemap layer below. As you visit each location, you mark that you have now seen that place, upload a picture that demonstrates that you were there, and the date of your visit. After you have recorded your geographic journal entry, you can later return to any geography to see when you were there, the exact coordinate location, and photographic memory you captured.
The tech: AppStudio for ArcGIS, QML, JavaScript, ArcGIS Online
The team: Brandon Brooks, Don Kemlage
Team Medalus
1st place, enterprise
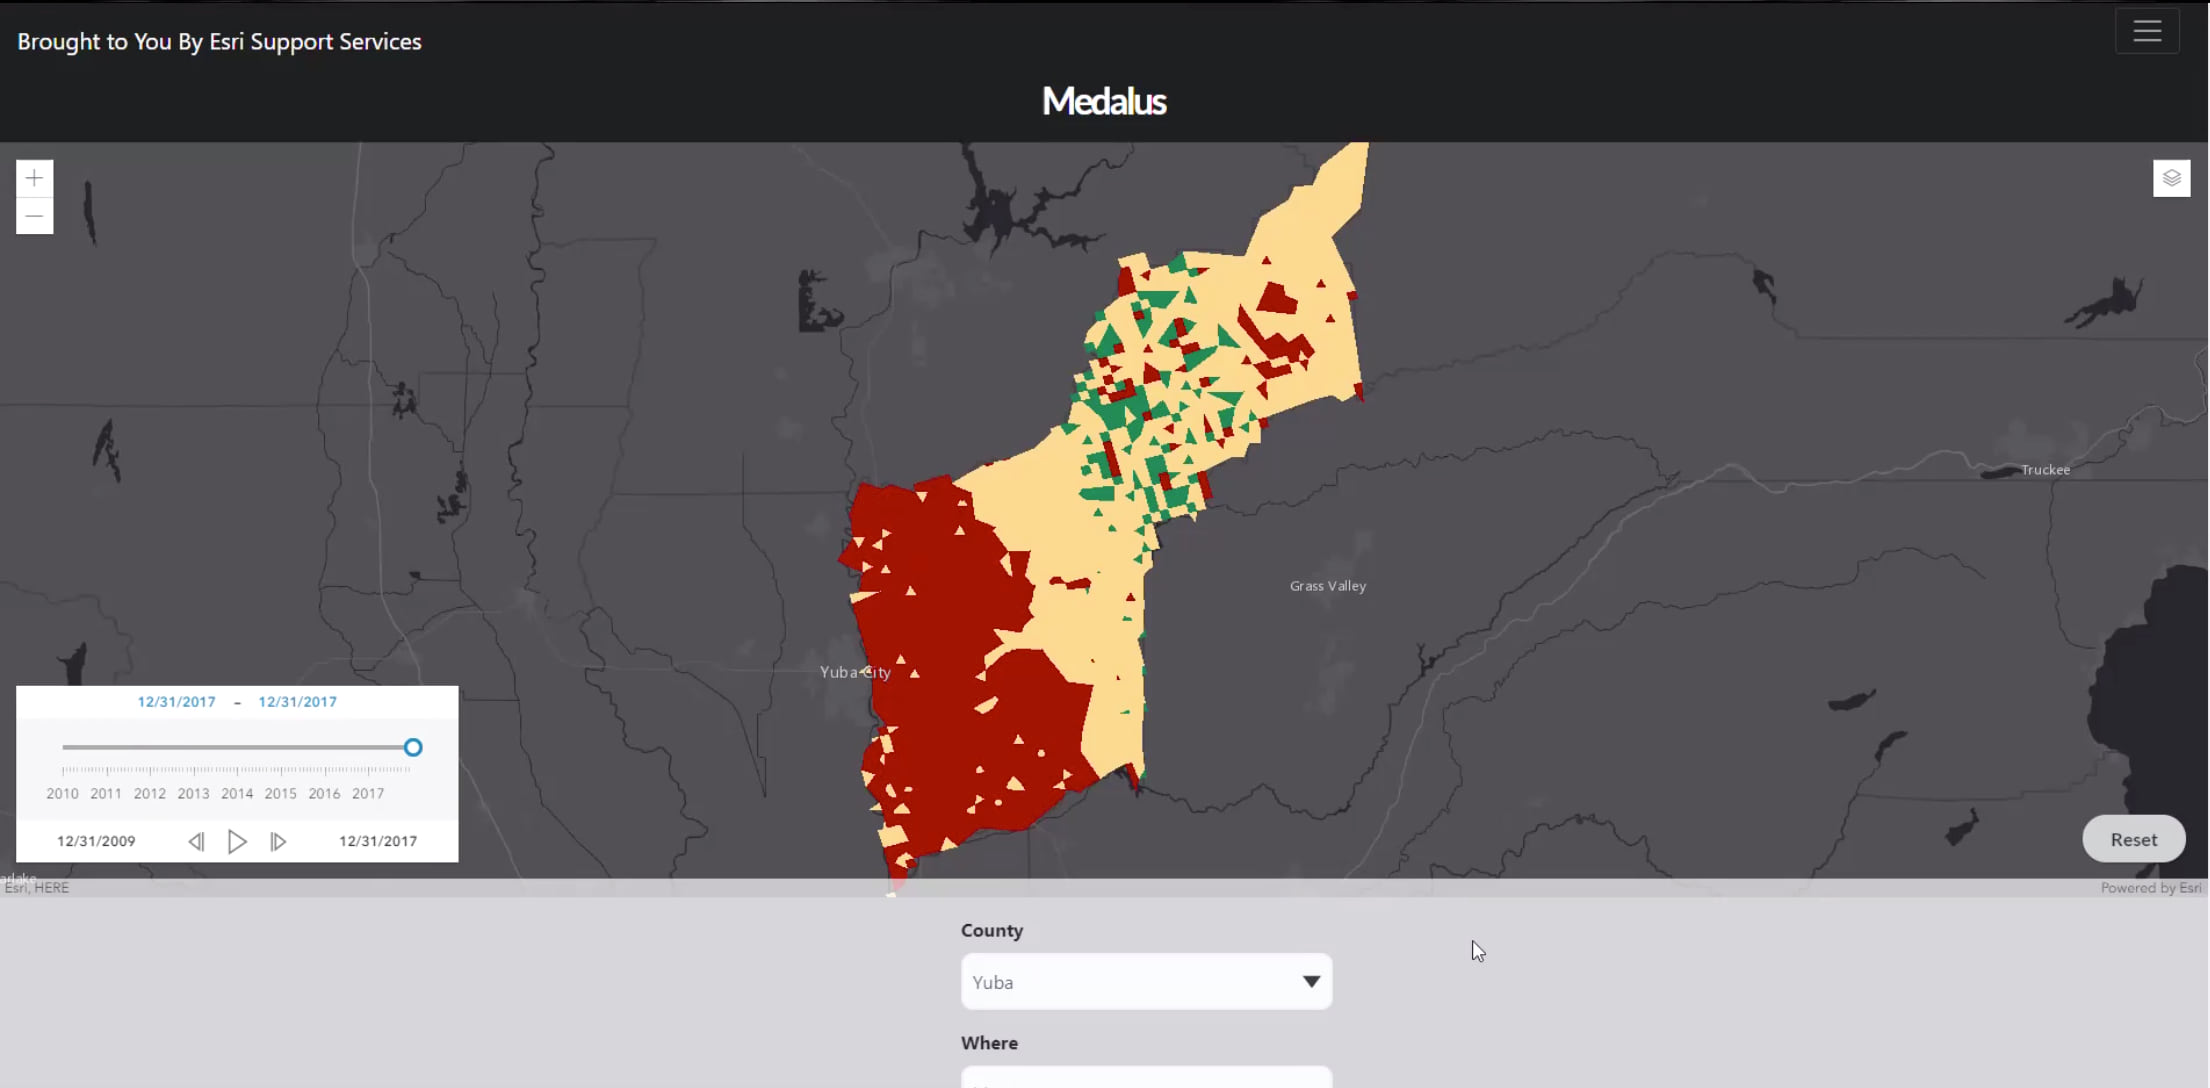
Climate change is a burning topic and most of the focus is on natural disasters, rising sea levels, and drinking water scarcity. However, desertification has been overlooked. We heard about California drought, fire, as well as the current Australian fire, but these directly correlate with desertification. Desertification refers to land degradation caused by climate change and human activity in arid, semi-arid, and dry sub-humid areas. The aim of this application is to map desertification-sensitive areas. The Mediterranean desertification and land use (MEDALUS) approach identifies environmentally sensitive areas (ESAs) through the Environmentally Sensitive Area Index (ESAI).
The tech: ArcGIS JavaScript API, esri-loader, React, Node, Express, MobX, Reactstrap, Formik, ArcGIS Pro, ArcPy, GeoJSON
The team: Jose Banuelos, Ben Elan, Kavish Ghime, Tarun Jaiswal, Biraja Nayak
Planet of Sound
3rd place, consumer
Explore maps of your favorite music artists. Find out where they’re from and when they’re coming to play your town. Explore regions with distinctive sounds and learn the history and bands that put that region on the musical map. Choose an artist and get a map of their current tour (if any) or any shows they’ve played in their gigology. Or, if you’re not picky, just see who’s coming to your area in the near future.
The tech: ArcGIS Runtime SDK for .NET, C#, ArcGIS JavaScript API, ArcGIS Online, Spotify API
The team: Thad Tilton

Commenting is not enabled for this article.