This blog describes the use of Geoprocessing tools including the Solar Radiation Graphics tool in the Spatial Analyst extension for evaluating poor performing weather stations that both, recorded and, were powered by solar radiation.
Overview
In order to stimulate economic development in the agricultural sector, the Community Business Development Corporations (CBDC), responsible for the five western-most counties (Shelburne, Queens, Lunenburg, Yarmouth and Digby) in South West Nova Scotia (SWNS), assembled the funding to start an Agriculture Climate Data Project in 2011. The objective of this project was to measure, record, and share temperature and solar radiation observations to maximize crop production and stimulate economic development in the agricultural sector of SWNS.
The Applied Geomatics Research Group (AGRG) in Middleton have been monitoring the meteorological conditions in the Annapolis Valley for almost a decade and were approached by the CBDC, during the launch of the Agriculture Climate Data Project in 2011, to expand their study area to encompass all of South West Nova Scotia, Canada. Today the AGRG has seventy-four (74) monitoring stations deployed across SWNS. The weather stations collect temperature and solar radiation every five minutes which are downloaded to a SQL Server database, either automatically or manually depending on the weather station.
In addition to this meteorological data, LiDAR and aerial photography for the station locations were collected in 2011. These data provide a high-resolution description of the surrounding landscape for each station.
It quickly became obvious to the AGRG that the solar radiation data contained some errors. Although the AGRG had installed weather stations in open areas, some weather stations were recording little to no solar radiation at times when high values were expected. This suggested that these weather stations were obstructed from the sun.
Furthermore, the weather stations are powerd by solar radiation. Limited solar radiation exposure, especially during the low light winter months, could compromise the power source of the weather station, which in turn could compromise data collection.
It was important to identify any weather stations that may be obstructed, for example by buildings, trees, mountains, hills, etc. A 360 degree obstruction analysis was, therefore, performed on the SWNS weather stations using 2011 LiDAR data, a point feature shapefile of the weather stations and a series of ArcGIS 10 geoprocessing tools. This process was automated for all 74 weather stations using ArcPy.
Data
LiDAR data was critical for this analysis, providing up-to-date and accurate elevation data that included ground cover, such as buildings and vegetation, which are the main causes of obstruction on the micro scale. The LiDAR data used for this project had been previously processed into a 1 meter Digital Surface Model (DSM).
Also, a shapefile including all weather station locations was used.
Note: The LiDAR data was collected in July 2011 and therefore, only represented leaf-on vegetation. Since vegetation volume differs by season, it is normal to expect different obstruction impacts between leaf-on (summer) months and leaf-off (winter) months.
Methodology
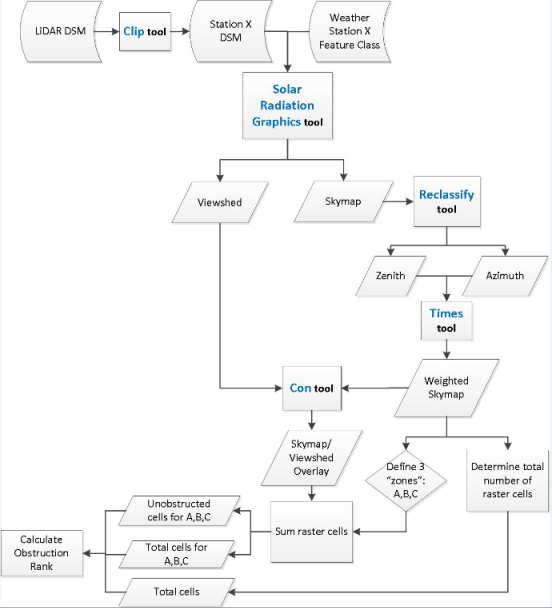
For each weather station, the Digital Surface Models (DSM) was clipped using a 2000 meter buffer around the station’s point feature. The initial DSM needed to be clipped because it was too large to be used as an input and since we were interested in local obstructions, expanding to 2000m was considered enough to cover all local variations.
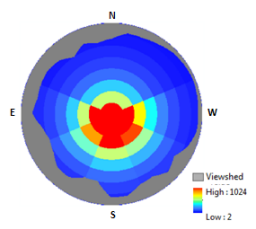
The Solar Radiation Graphics tool in ArcGIS 10 Spatial Analyst extension was the main geoprocessing tool used for this analysis. The viewshed (Figure 1) and skymap results from the Solar Radiation Graphics tool were used to delineate obstruction and weight sky sectors, depending on their solar radiation potential (i.e. sky sectors closer to the middle of the skymap have a higher solar radiation potential and vice versa).
Figure 1. Illustration of how the viewshed derived from the Solar Radiation Graphics tool represents a hemispherical view of the surrounding topography from that point
The clipped DSM was used as the Input raster, the weather station point feature class as the Input Point Features and Height offset of 2.5 meters was specified to account for the height of the weather stations. A Sky Size of 300 was used because a DSM was used as an Input Raster and eight (8) Zenith and Azimuth divisions were specified for the skymap to the future weighting process of sky sectors simple.
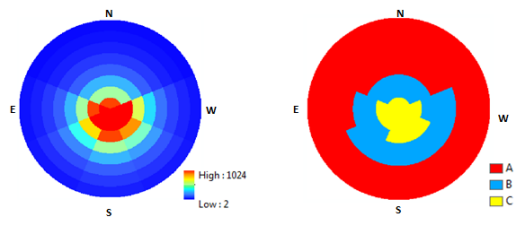
Using the output skymap, weighted skymaps were created to represent the varying solar radiation potential throughout the skymap. The first was weighted on zenith positions and the second on azimuth positions using Reclassify (Spatial Analyst). Then, these two were combined into a general weighted skymap (Figure 2).

Figure 2. Weighted Skymap illustrating solar radiation Figure 3. Solar Radiation Zones (A: lower solar radiation potential; C: higher solar radiation potential)
The weighted sky sectors (Figure 2) were configured into different solar radiation zones (Figure 3). The total number of raster cells was determined for each zone (Total Area).
Then, the viewshed was overlayed onto the weighted skymap (Figure 4) using Con (Spatial Analyst) and for each zone (Figure 3), the total number of unobstructed raster cells was found (Unobstructed Area).
Figure 4. Viewshed for station WE1 overlayed on top of the Weighted Skymap
Then, for each of the zones illustrated in Figure 3, the proportion of unobstructed cells was determined and a normalized obstruction rank was calculated for each weather station using the following equations:
Note: This example uses 3 zones (A, B & C) where C has the highest solar radiation potential and A, the lowest. This was done to minimize processing time, but each sky sector could have been its own “zone” as it had been previously weighted.
Results
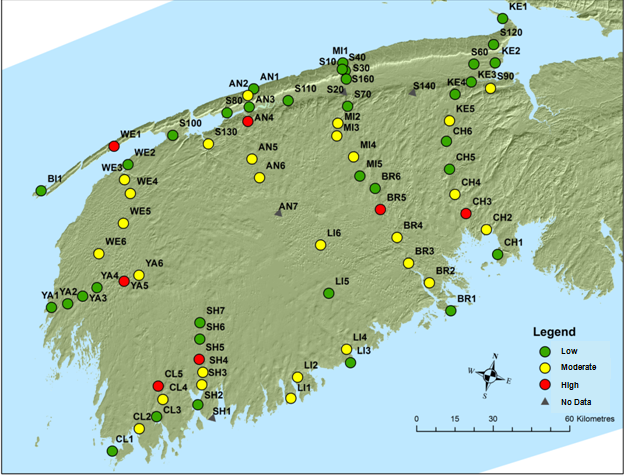
Results were written to a .csv file which was joined (using Join) to the weather station point feature class in ArcMap 10 and symbolized using a Natural Breaks classification with 3 classes to help identify weather stations with higher obstruction. The location of weather stations with higher obstruction, symbolized in red, should be re-evaluated. The weather stations with little to no obstruction are symbolized in yellow and green (Figure 5).
This analysis allowed to AGRG to identify weather stations that were more at risk of not collecting any solar radiation data or having insufficient solar power to stay on due to surrounding obstruction. Furthermore, AGRG were able to assess if any of the weather stations needed to be relocated.
Figure 5 – SWNS Weather Stations ranked by obstruction
This post was contributed by Pascale Robichaud, an intern on the analysis and geoprocessing team.


Article Discussion: