ArcGIS for Power BI offers a great deal of content out-of-the-box for both Standard and ArcGIS users. Some of this content lives within the Living Atlas and is imported into our visual through the Reference layer tool. To keep up with current trends and information, some of this data is deprecated and removed over time. While some historical or vintage information is important, these particular layers become outdated quickly as the years go on. For that reason, the 2016 U.S. Demographic layers have been removed from the visual. As a reference, these layers were officially removed from the Living Atlas catalog earlier in 2021: U.S. and Canada 2016 Demographic Maps to be Retired.
Moving forward, items that are pending removal will be marked as deprecated and then removed at the start of the following year. This will help us stay current with population trends, demographic information, and socioeconomic content.
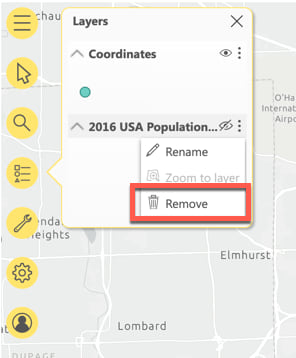
Removing a retired layer from the map
If you happen to have a 2016 layer on your map, you might notice that it no longer loads, but appears in the Table of Contents. To remove the layer, do the following:
- Navigate to the Table of Contents from the Map tools icon
- Find the 2016 layer in the list
- Click on the Layer options button and then select “Remove layer”
Add an updated U.S. Demographic layer
To replace the 2016 layer that was removed (or if one hadn’t existed on the map previously), do the following:
- Navigate to the Map tools icon
- Expand the Analysis tools menu and select Reference layers
- In the Reference layer widget, select a new 2020 U.S. Demographic layer from the list

I may have missed it, but is there a way to convert existing custom classic reports to the new infographic report standard?
Hi, Shaun! Thank you for the question. There are step-by-step instructions to convert an existing classic report to a tabular infographic in this blog article: https://www.esri.com/arcgis-blog/products/bus-analyst/analytics/build-tabular-infographics-from-scratch-in-arcgis-business-analyst-web-app/. We suggest that you create a new blank infographic and copy the table formatting from an existing tabular infographic (such as Retail Demand by Industry). Then select the content from your classic report, copy the variables, and paste them into your blank tabular infographic panel.