On Monday July 9th, at the 2018 Esri User Conference, over 17,000 people came together for a week of learning about ArcGIS and sharing experiences with each other. For our Dashboard development team, this was an opportunity to present our new tech and a very humbling experience as we witnessed so many customers present Dashboards throughout the conference.
National Security and Public Safety Summit (July 7th – July 8th)
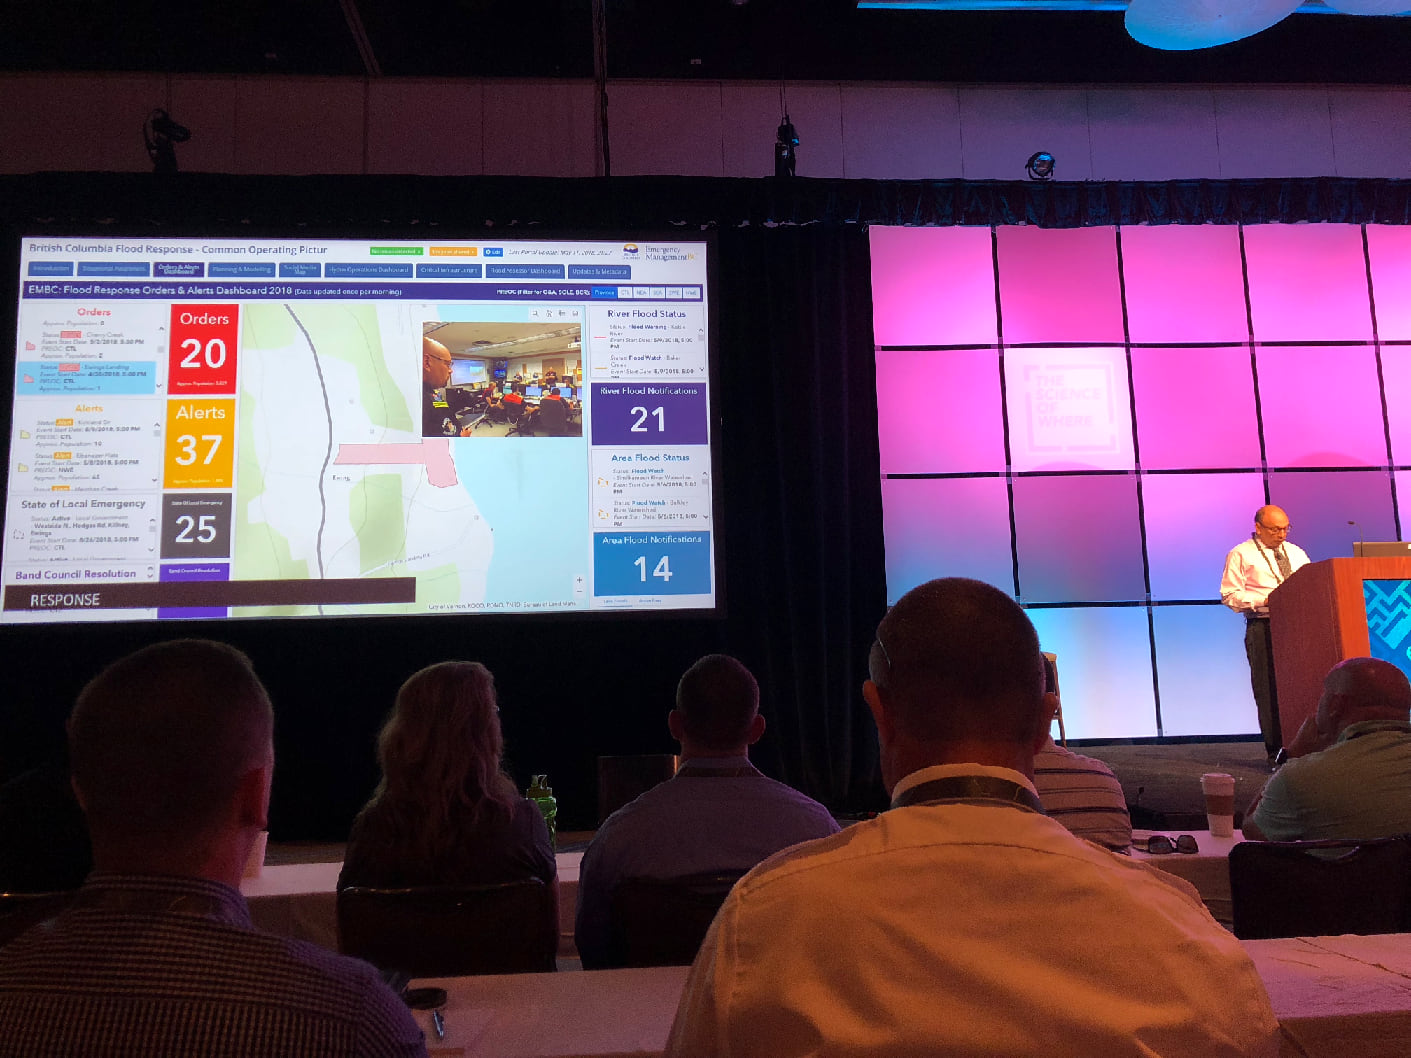
Starting with the plenary on Saturday morning, FEMA, CalOES, GeoBC, American Red Cross and Esri’s Public Safety team demonstrated how Dashboards can provide situational awareness for event planning, response and recovery efforts. This was followed by many presentations through the rest of the weekend. Below is a picture of Gurdeep Singh, a geospatial leader within the British Columbia Provincial Government, presenting a Flood Response Dashboard used to monitor flood hazards on the Frazer river.

These wonderful presentations were followed by a number of technical workshops given throughout the weekend.
User Conference Plenary
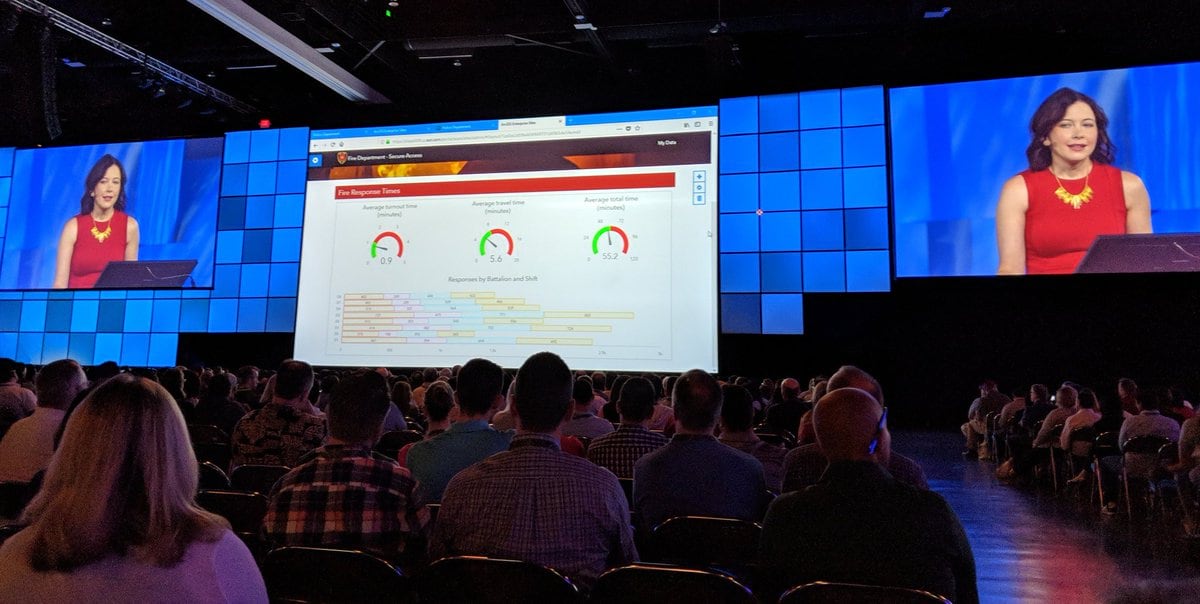
During the plenary, a number of customer presentations demonstrated the use of Dashboards within their organization.
J.D. Irving used a Dashboard to presented a supervisor’s view of moving forest products, and Cobb County Government, demonstrated Dashboard for the monitoring of real-time traffic incidents (after joining the Waze Connected Citizen Program) and making decisions on signal timing to manage pedestrian volume during events.
Likewise, our own Shannon Kalisky from the ArcGIS Enterprise team demonstrated how you can embed Dashboards within an ArcGIS Enterprise Site (new for the 10.6.1 release).

User Conference Technical Workshops and Envisioning Workshops
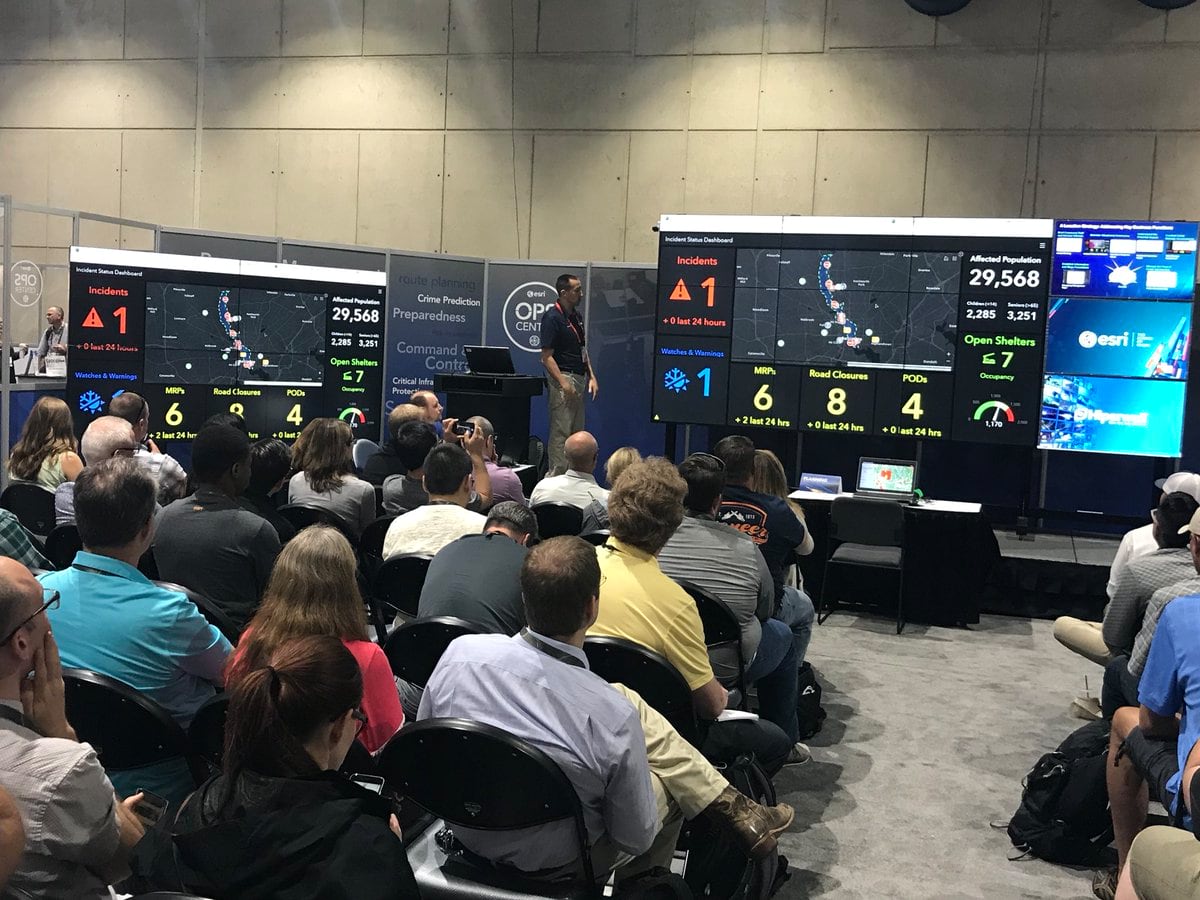
Throughout the week, our Solutions and Industry teams presented on the capabilities of Operations Dashboard during envisioning workshops at their respective areas within the Expo.

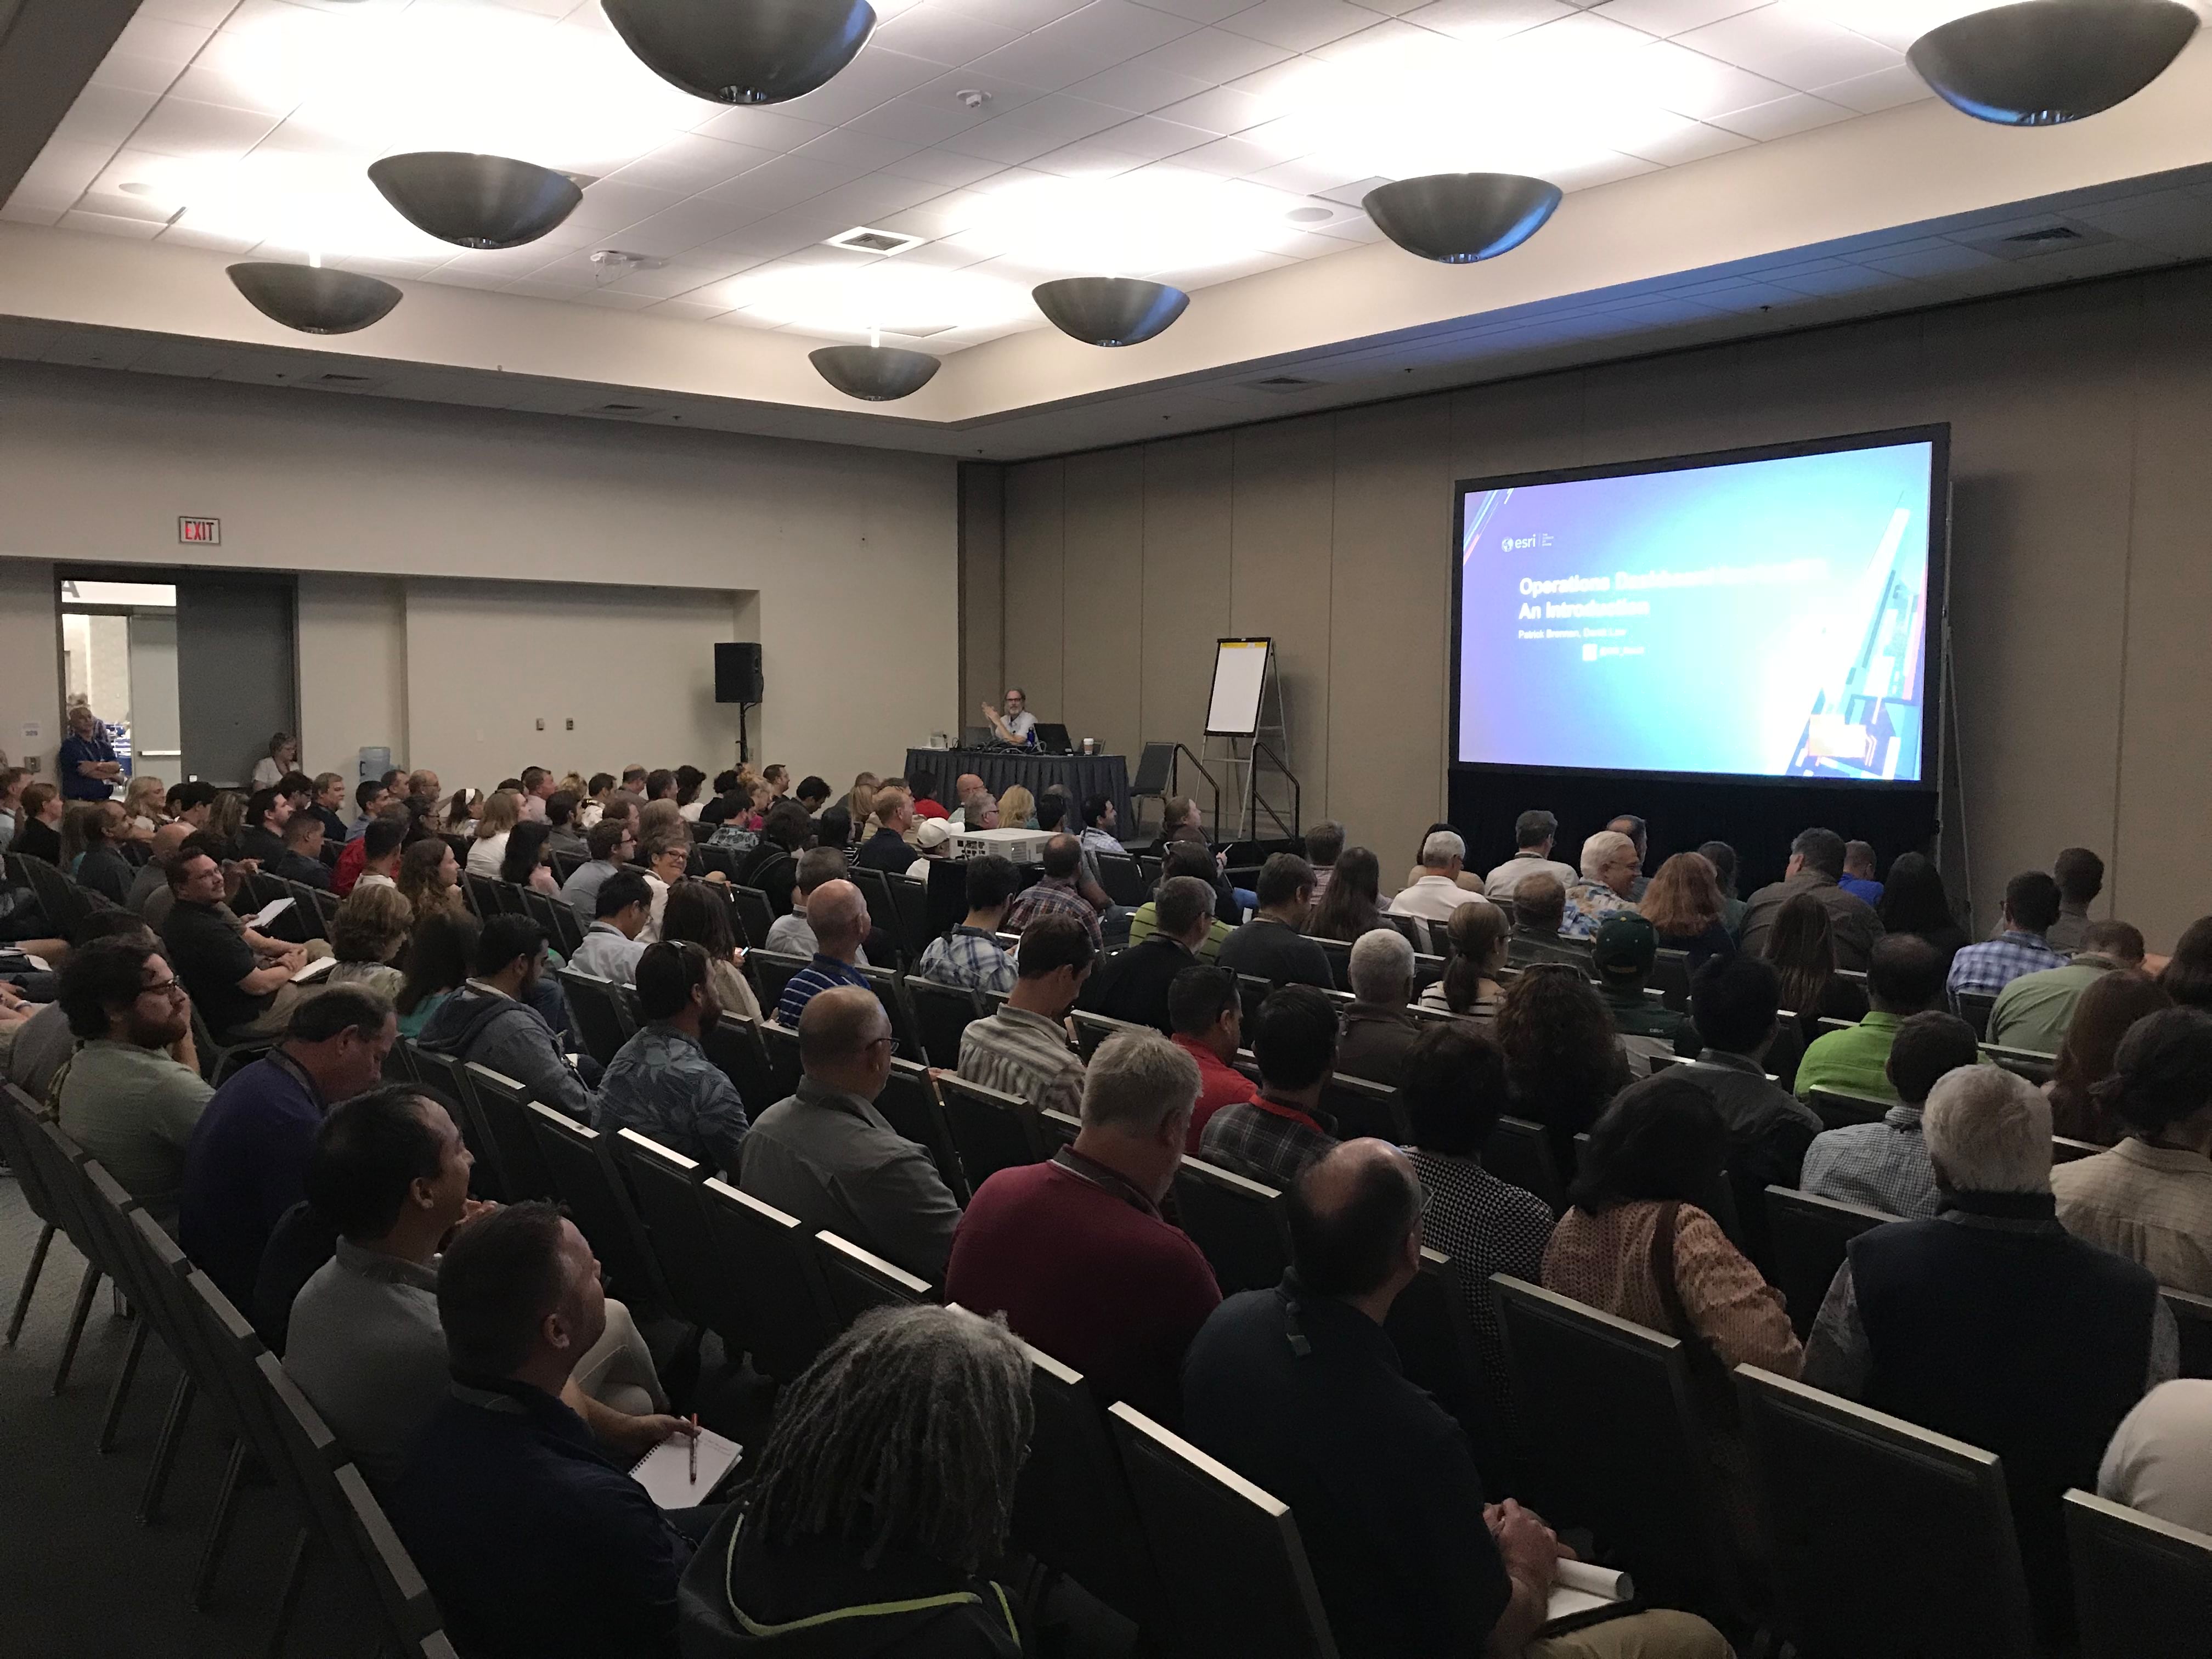
Our own development team held several technical workshops and demo theatres that showcased the capabilities as well as best practices for building Dashboards as well. The sessions were jam packed and we received a lot of wonderful feedback throughout the week.

Here is a recap of the past 2 releases:
- June Release – New settings, Follow Feature, Smartphone support (see our blog on best practices).
- April Release – Chart Selection, Embedded Content, Sharing
NOTE: With the ArcGIS Enterprise 10.6.1 release, Dashboard is now included within the ArcGIS Enterprise setups. You do not need to download a separate installer. The content we released in the April update to ArcGIS Online is included in 10.6.1 and the content released in June will be included in the next release of ArcGIS Enterprise.
Energized coming out of our event last week, the team is now focused on what’s next. Here are key enhancements on our roadmap but please understand that this list is subject to change:
- New layout options for data visualizations
- More control over theming your dashboards
- Dashboard actions using URL parameters so that you can control their behavior when opening them
- TV-ready dashboards that autoplay tabs, lists, selectors when monitoring events
- Moving to the 4.x JS API to improve performance, size, reap the benefits of 4.x and support 3D.
- Improved support for IoT Dashboards that push content to visualizations
As always, we really want to hear what you would like us to focus on. Please talk to us on the GeoNet site, and/or email us directly at Dashboard4ArcGIS@esri.com.
Commenting is not enabled for this article.