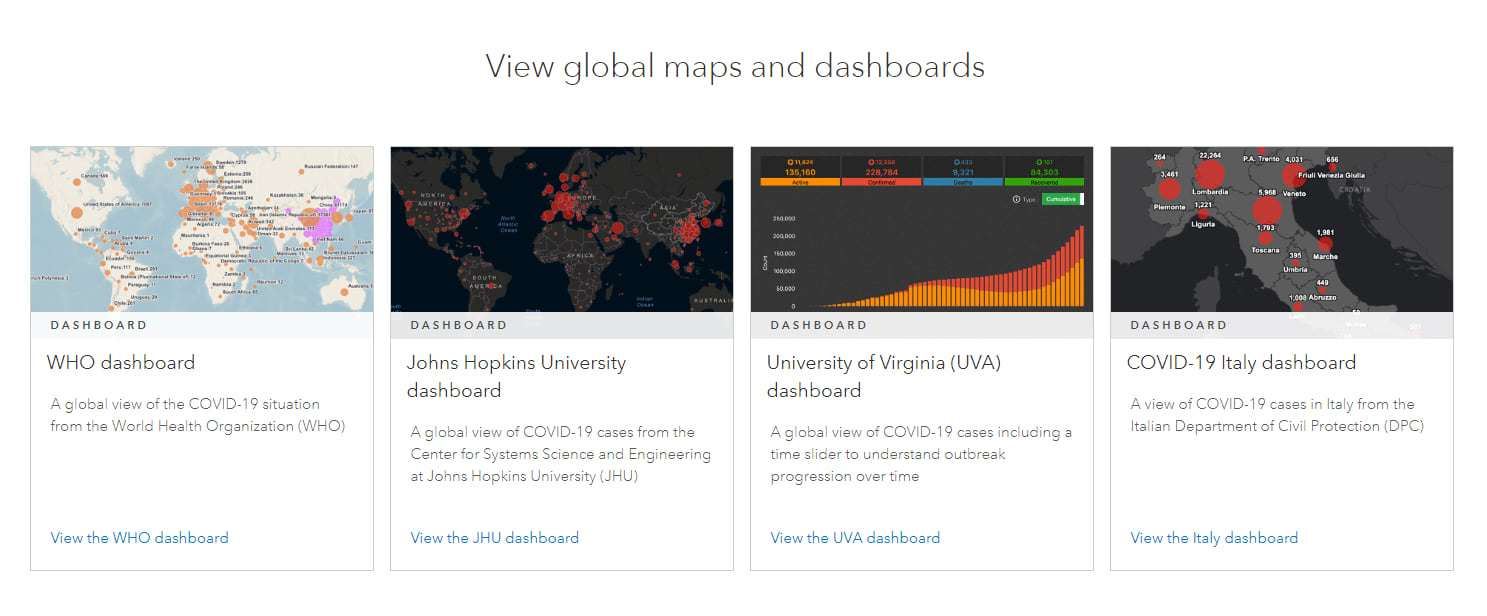
With the current COVID-19 situation across the world, there’s been a proliferation of corona virus themed dashboards emerging over the last few weeks in ArcGIS Online. Many of these were created with ArcGIS Dashboards, which enables users to convey information by presenting location-based analytics using intuitive and interactive data visualizations on a single screen. A gallery of COVID-19 dashboards can be accessed from the esri COVID-19 resources Hub.

If you or your organization is interested in creating your own dashboard(s) to help support COVID-19 related use cases, there are several options to help you get started:
1. Solution templates by the ArcGIS Solutions team

2. Tutorial blog: Create your first dashboard using ArcGIS Dashboards
3. Learn ArcGIS lesson: Monitoring COVID-19: A Dashboard Lesson
We’ve had many users request additional training materials to go more in-depth with ArcGIS dashboards. They want to better understand the different data visualization options and how to configure their own interactive dashboards. We just released a video series that helps new users learn about creating dashboards from the ground up with ArcGIS Dashboards.
Checkout this Esri Academy learning plan to learn more, ArcGIS Dashboards Workshop for COVID-19.

We hope you find these videos helpful.
Another good resource to learn more about dashboards: ArcGIS Dashboards – Useful Links blog.
FYI, there’s also a GeoNet forum Coronavirus disease 2019 (COVID-19), where you can post questions for additional support.
Stay safe,


Thanks, great blog!