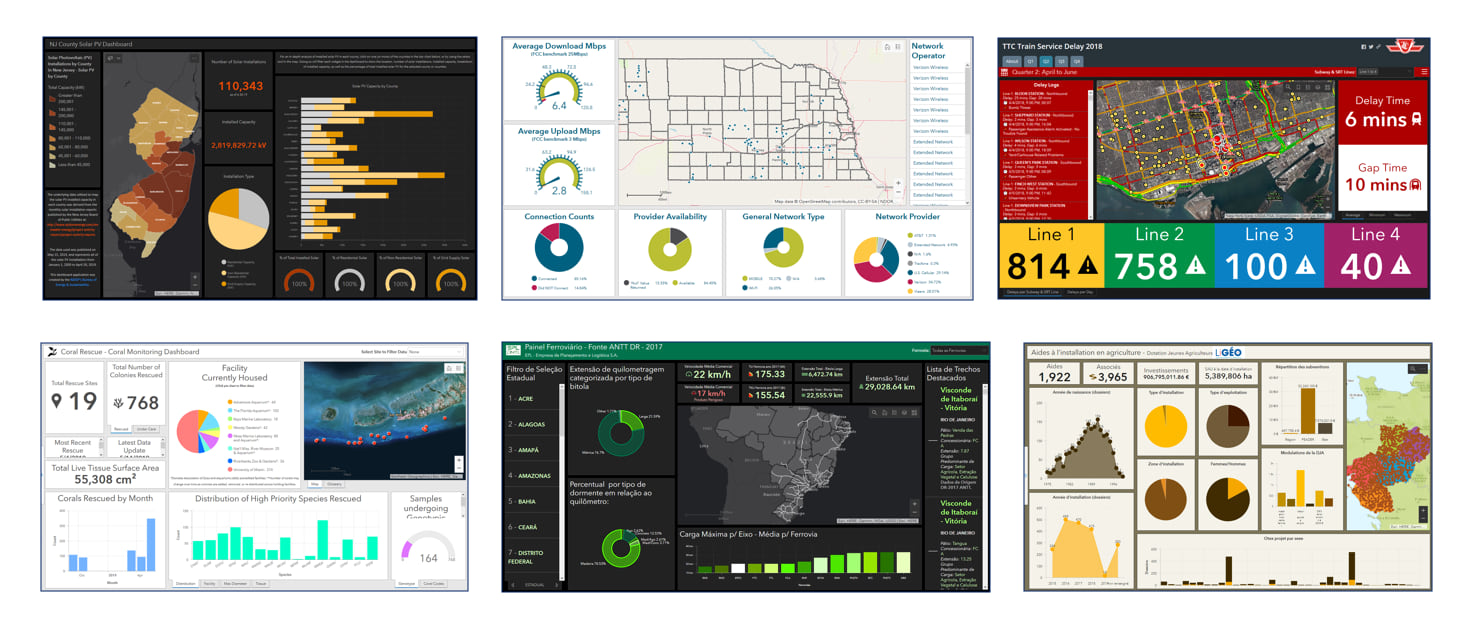
It’s that time of year again, the Esri 2019 international user conference starts next week in San Diego, CA. This blog is a short guide to activities at the conference related to Operations Dashboard for ArcGIS, the configurable web app that provides location-aware data visualization and analytics for a real-time view of people, services, assets, and events.
“Dashboards are one of the most impactful apps you can deploy, because it turns managers and executives into GIS users” – Adam Carnow, Esri Community Evangelist, @SpatialAce

UC Expo
The UC Expo area is located on the first floor of the San Diego Convention Center (SDCC) and is where you will find Esri industry neighborhoods, ArcGIS software product islands, partner booths, demo theaters, and booths for technical support, training services, and much more.
Members of the Operations Dashboard Dev team will be working at the ArcGIS Online area at the Expo. We’re excited to meet and hear your feedback, learn about your workflows, and help answer your questions.
We also suggest visiting the various Esri Industry Neighborhoods where you’ll be able to see many Dashboard examples in action for example at: ArcGIS Solutions for State and Local Government, ArcGIS Solutions for Natural Resources, ArcGIS Solutions for Health and Human Services and ArcGIS Solutions for Emergency Management.

Technical sessions and Demo Theaters
You can also learn about Operations Dashboard by attending Technical workshops and demo theaters. These will be presented by members of the Dev team and Solution Engineers from various industries.
Operations Dashboard for ArcGIS: An Introduction
Tues, July 09, 1:00 pm – 2:00 pm – SDCC Ballroom 6E
Thurs, July 11, 10:00 am – 11:00 am – SDCC Ballroom 6F
Operations Dashboard for ArcGIS: Monitoring Field Edits
Tues, July 09, 10:00 am – 10:45 am – Expo Demo Theater 7
What’s Next in GIS for Crime Analysis
Tues, July 09, 1:15 pm – 2:00 pm – Expo OPS Center
Thurs, July 11, 12:15 pm – 1:00 pm – Expo OPS Center
Valuation Workflows Within ArcGIS
Tues, July 09, 2:30 pm – 3:15 pm – Expo Envisioning Center 2
Wed, July 10, 12:15 pm – 1:00 pm – Expo Envisioning Center 2
Leveraging ArcGIS Web Apps
Wed, July 10, 8:30 am – 9:30 am – SDCC Room 17 B
Performance Management: Improving Confidence in Government
Wed, July 10, 10:00 am – 10:45 am – Expo Demo Theater 13
GIS for Public Works Professionals
Wed, July 10, 4:00 pm – 4:45 pm – Expo Demo Theater 13
Thurs, July 11, 10:00 am – 10:45 am – Expo Demo Theater 13
Advanced Mobile Workflows for Public Safety
Thurs, July 11, 11:15 am – 12:00 pm – Expo Demo Theater 16
And we highly recommend you attend this session to learn “tips & tricks” and design strategies for creating great Dashboards,
Operations Dashboard: Designing Effective Dashboards
Thurs, July 11, 1:00 pm – 2:00 pm – SDCC Ballroom 6B
User sessions
These are presentations given by users and are a great way to learn how colleagues implemented and deployed Operations Dashboard to support their business workflows.
Creating Impactful Applications
Tues, July 09, 1:00 pm – 2:00 pm – SDCC Room 25C
Using Operations Dashboard for Law Enforcement and Special Event Management
Thurs, July 11, 10:00 am – 11:00 am – SDCC Room 28B
To learn more about the Esri conference, please review the Esri conference agenda or download the Esri Events mobile app.
FYI, a great resource to learn more about Operations Dashboard is this GeoNet blog, Operations Dashboard for ArcGIS – Useful Links. There are many great customer Dashboard examples shown at the end of the blog.
Safe travels coming out and we hope you have a great time at UC!!
Sincerely,
The Operations Dashboard Dev team


Commenting is not enabled for this article.