One thing that often comes up in our discussions with our customers is data. That is, how can you take the best advantage of your organization’s data in dashboards and avoid the feeling of something being left ‘on the table’. To help you with this, we are assembling topics for a series of blog articles that discuss strategies, tips and tricks for getting the most out of your data in dashboards. In this first article, we’ll outline the usefulness and power of query layers in dashboards.
What is a query layer?
A query layer is a layer or stand-alone table that is defined by an SQL query. Query layers allow both spatial and non-spatial information stored in your enterprise databases to be easily integrated into your GIS projects, including dashboards. The data used by a query layer is not required to be in a geodatabase (although it certainly can be).
To create a query layer, you need access to ArcGIS Desktop (either ArcMap or ArcGIS Pro) to get started. You also need access to an ArcGIS Server that you can share web layers or web maps to.
Tip: ArcGIS Pro allows a larger subset of SQL to be included in a query layer’s definition.
Queries for query layers should be constructed using the target database’s implementation of SQL. In the case of a Microsoft SQL Server database for example, the query would be written in Transact-SQL (T-SQL).
Tip: To be used in a shared web map or web layer, your enterprise database must first be registered with your ArcGIS Server.
How to define a query layer
Defining a query layer is a two-step process. In the first step, you define the SQL query itself. In their simplest form, query layers select a list of fields from a single table that adhere to some criteria. In the following example, a table of service calls is queried for all tickets created in the year 2018.
Tip: Avoid unnecessary network traffic by constructing queries to only include the data required in your dashboard. This applies to both the fields requested, and the number of rows returned.
The second step when defining a query layer is to choose the unique identifier field(s) and set the spatial properties (if applicable). It’s important to set the unique identifier field(s) because ArcGIS expects there an ObjectID field to be available (whether the table is registered/stored in a geodatabase or not). An ObjectID is simply a unique, not null integer. It is used by ArcGIS to uniquely identify the rows.
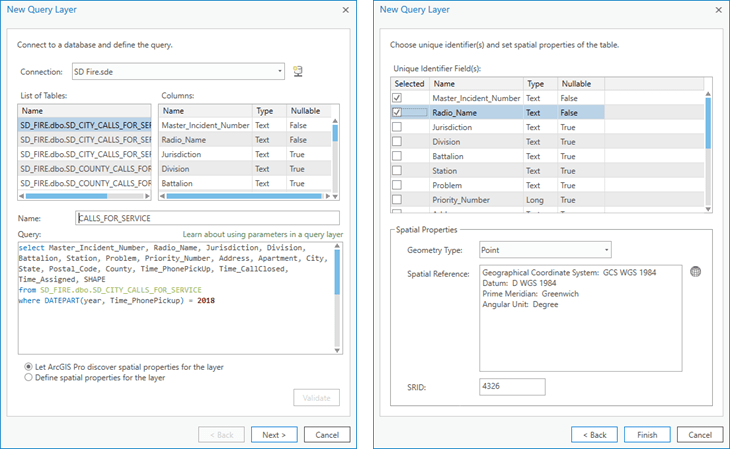
Ideally, your query layer definition will have an integer field that you can use as the ObjectID field. The field does not need to be named ObjectID. It just needs to store not null integers. If there is no integer field available, you are provided the option to choose one or more fields to indicate uniqueness of the rows. In this case, ArcGIS will create a virtual ObjectID field named ESRI_OID. In the calls for service example above, there is no single field to create uniqueness. Uniqueness of rows is determined by a combination of Master_Incident_Number and Radio_Name.
Once a query layer has been created, it can be shared as a web layer or as part of a web map and used in a dashboard as a data source.
Query layer troubleshooting
In a perfect world, this article would end here. Everything would ‘just work’. There is, however, more you need to know about using query layers as data sources in dashboards.
When configuring dashboards using data sources based on query layers, you will sometimes see a ‘Cannot Access Data’ warning message. There can be a few reasons for this message, but in the case of data sources based on query layers, the culprit is often that a query has failed to return any data.
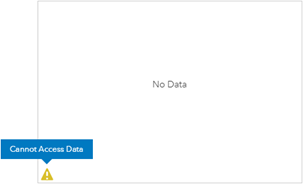
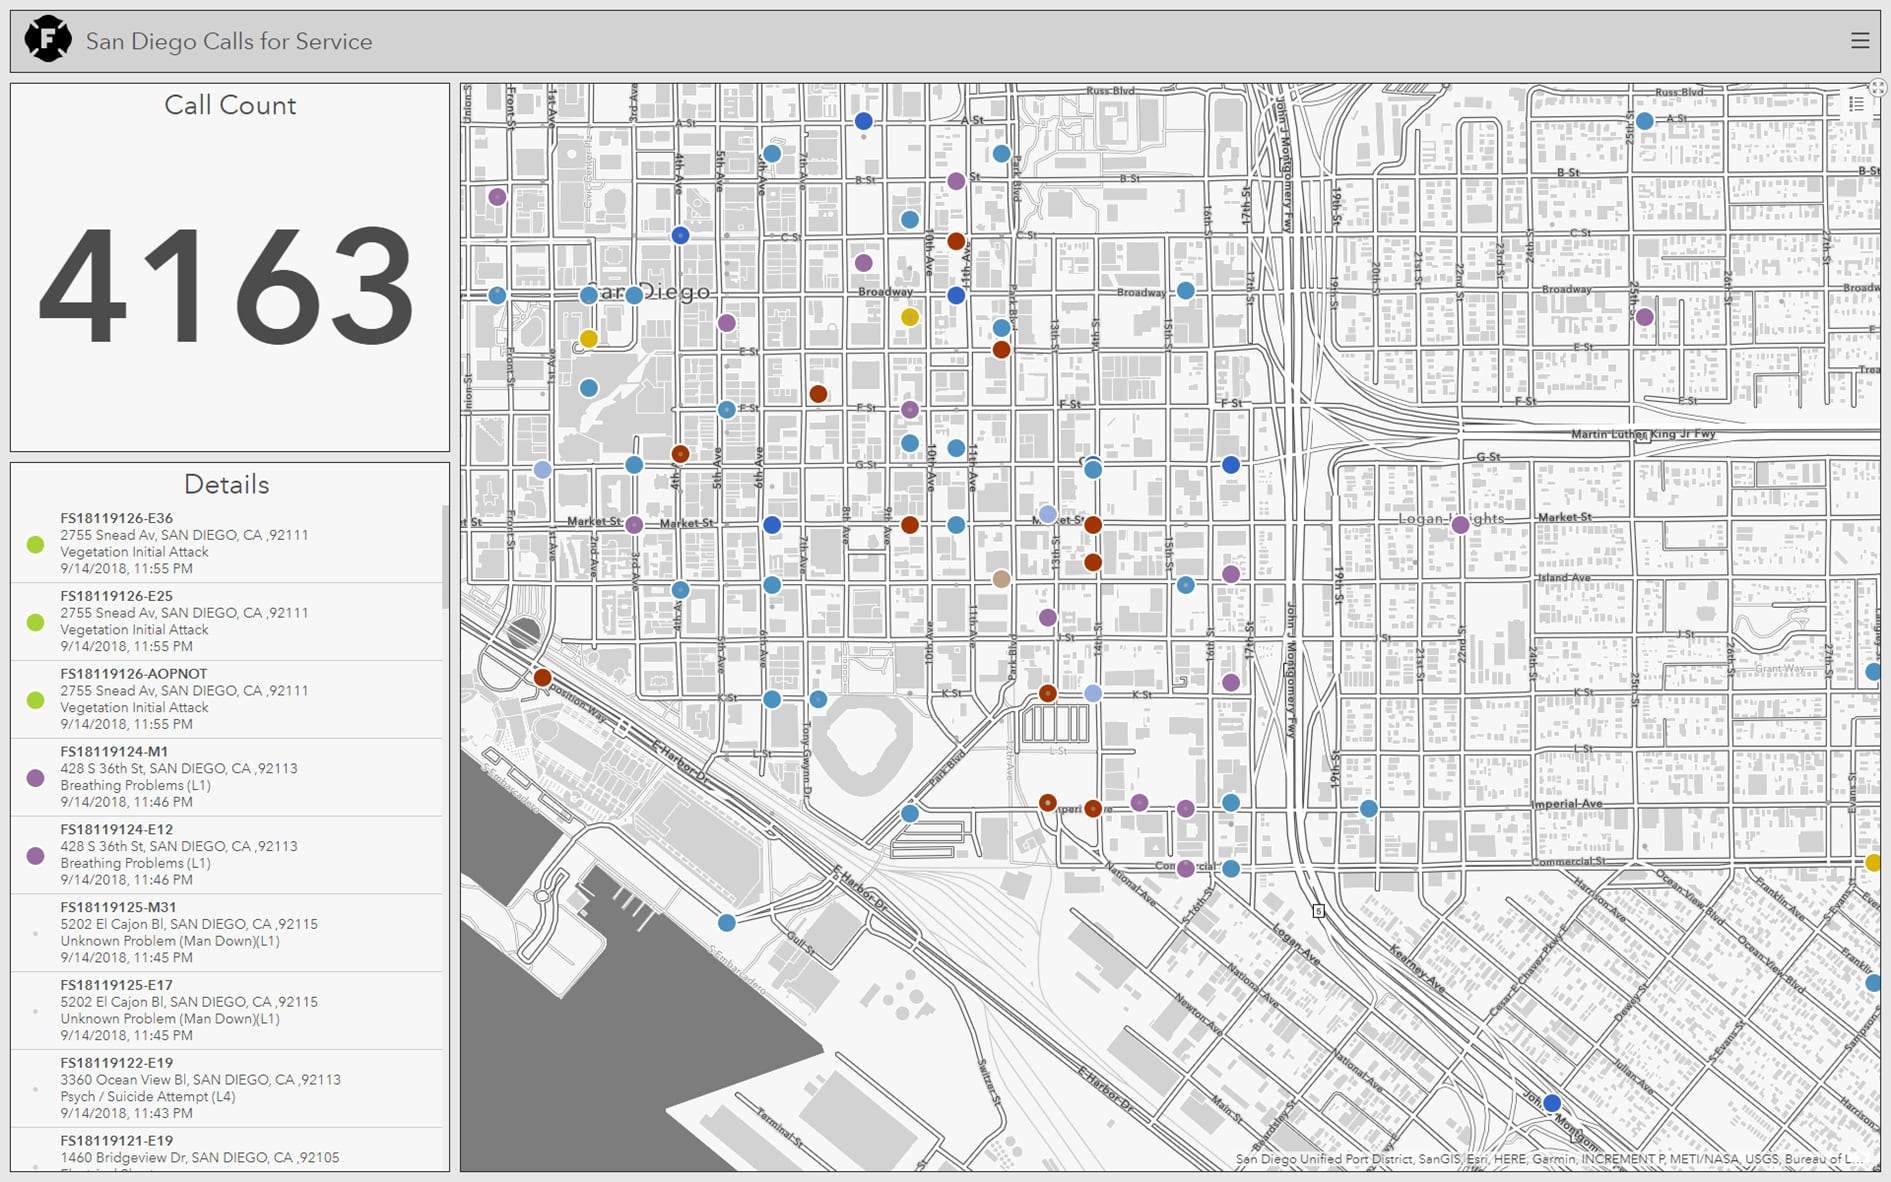
This can be confusing because not all visualizations based on the same data source will show the warning. In the following example, a simple dashboard was constructed to show the calls for service query layer configured above. In the dashboard, the map, list and indicator all use the same layers as a data source. The map and the list display just fine, but the indicator shows a warning.
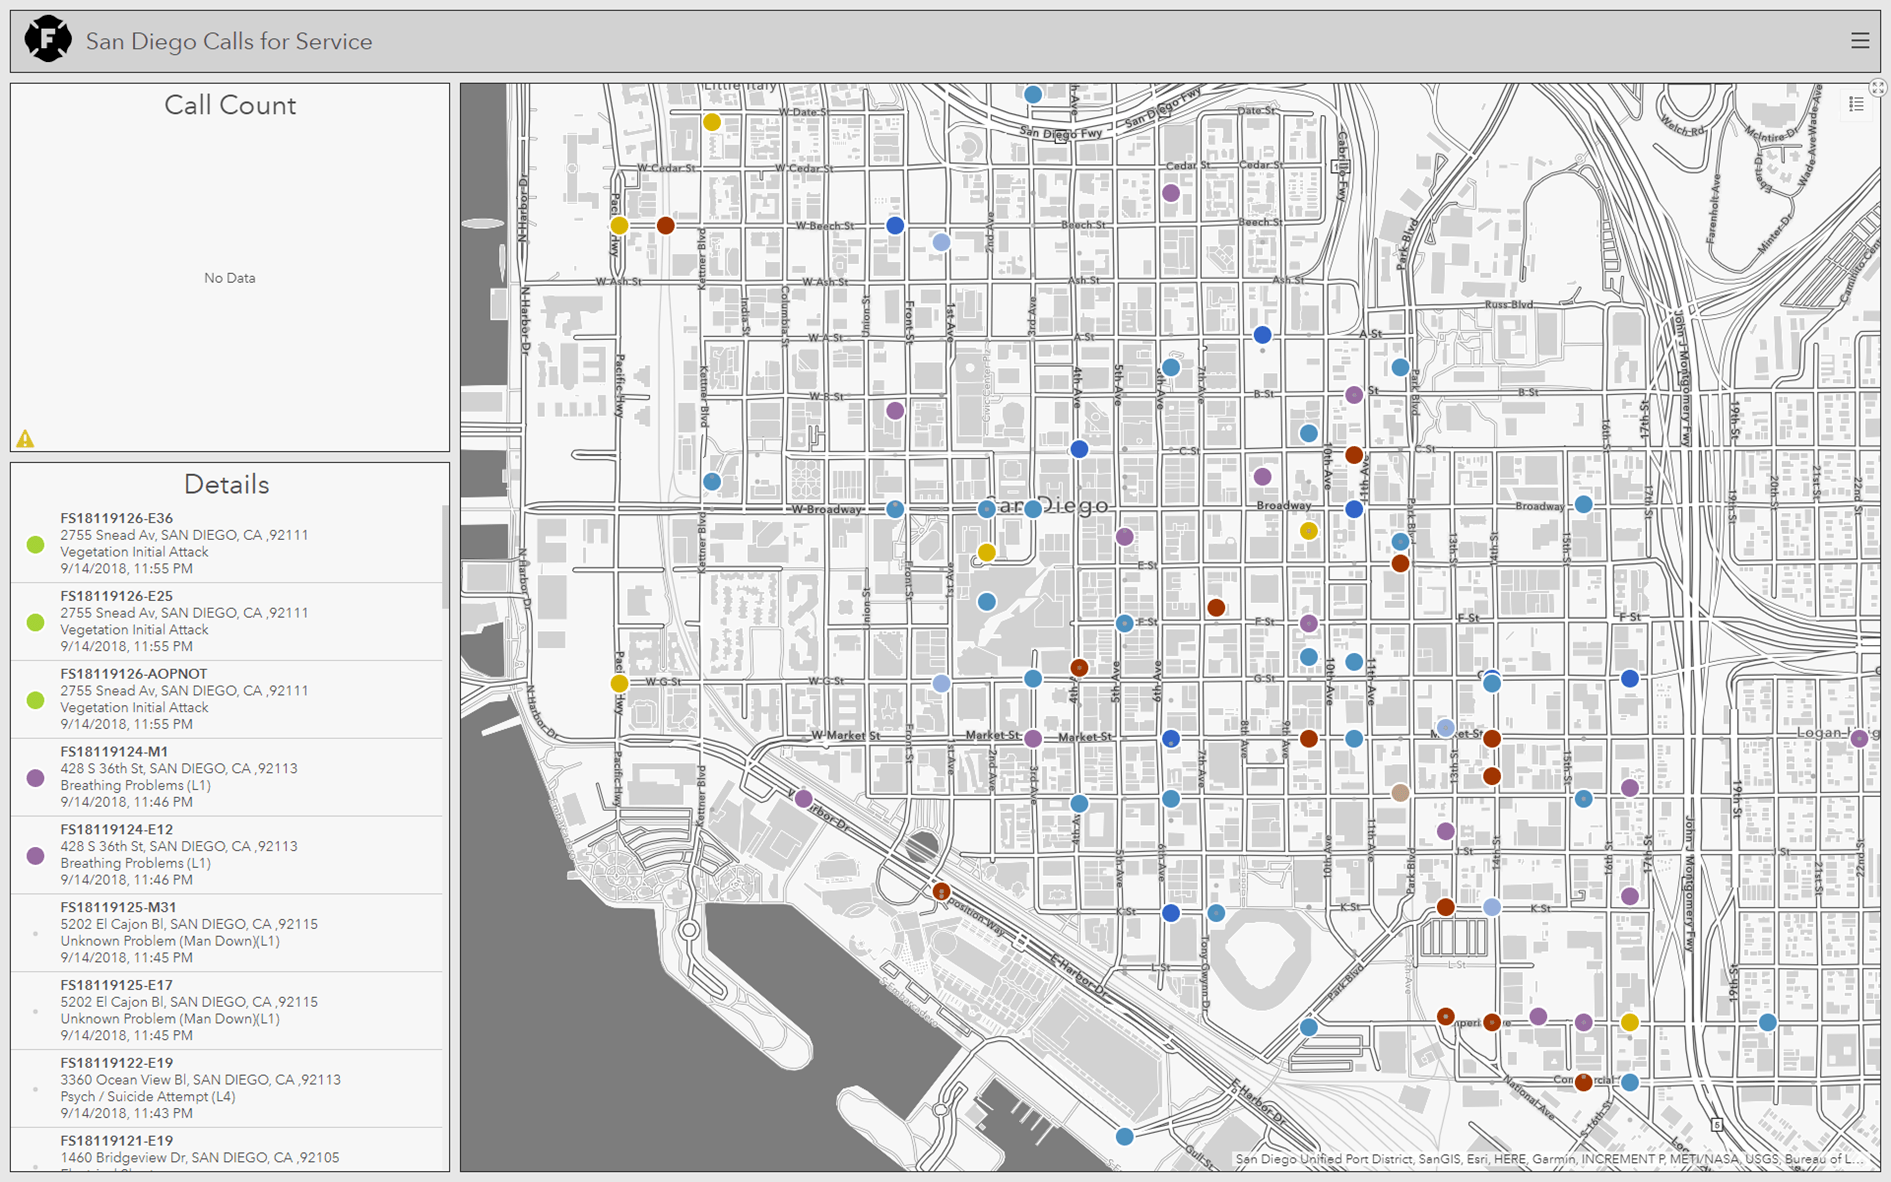
In a dashboard, elements such as indicator, gauge, pie chart and serial chart often rely on the underlying data source’s ability to generate summary statistics when being queried. The supported statistics include count, sum, average, minimum, and maximum.
In our example, the cause of the Cannot Access Data warning is the virtual ObjectID field in the query layer. Some service back ends simply don’t like virtual ObjectIDs when generating summary statistics. To work around the problem, the query layer needs a better ObjectID.
Tip: In addition to requesting summary statistics, pie charts, serial charts, gauges and indicators all have options to generate values ‘by feature’. When configured this way, these elements do not request summary statistics, and will render as expected (that is, no ‘Cannot Access Data’ warning). When you do need a summary statistic, however, follow the advice below.
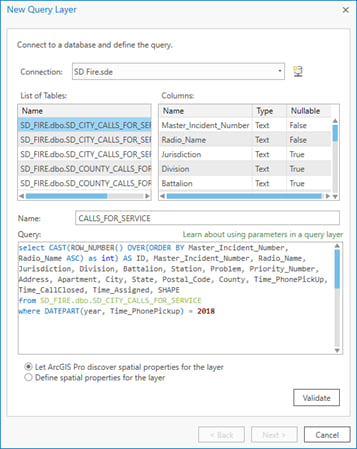
As mentioned previously, your query layer would ideally have an integer field that can be used as the ObjectID. If this is not possible (like with the calls for service data), there are SQL techniques that can be used. For example, ROW_NUMBER is a function supported by many database vendors, and it can be used to generate a serial number for a given record set. When using ROW_NUMBER, you always specify an ORDER BY clause so that the numbers will be assigned in the specified order.
The following shows a slightly different approach to the calls for service query layer. Here, the ROW_NUMBER function is used to create a field named ID, and the Master_Incident_Number and Radio_Names fields are being used for sorting. Because the data is stored in Microsoft SQL Server, the CAST function is used to turn bigint values returned by ROW_NUMBER into the integer values ArcGIS wants for ObjectIDs.
Tip: ROW_NUMBER is a non-deterministic function, which means the values it returns can change between executions. To ensure deterministic results, the fields specified for the ORDER BY clause must provide uniqueness.
Once the query layer has been re-shared with the integer-based ObjectID field, the Cannot Access Data warning in our dashboard is gone. All elements display as expected.
And there you have it: a quick introduction to query layers for dashboards. Look for future blog articles with more tips and tricks for getting the most out of your data.
As always, we’d love to hear from you. We can be reached via our GeoNet community or directly at dashboard4arcgis@esri.com.

Commenting is not enabled for this article.