The June 2024 update for ArcGIS Dashboards introduces several exciting enhancements, bug fixes, and performance improvements.
This blog post provides a detailed overview of the new features and enhancements available when creating or editing a dashboard in ArcGIS Online.
Let’s dive straight in!
____________
Theme Improvements
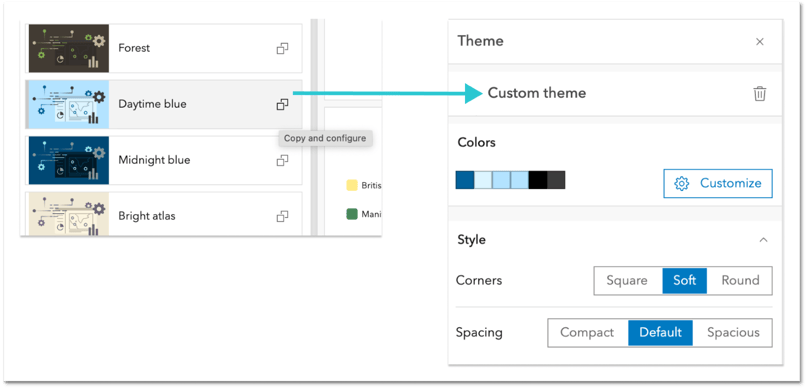
In this update (June 2024), we have introduced new theme capabilities, significantly enhancing the ease of creating visually compelling dashboards. Seven new themes have been added to the themes panel of ArcGIS Dashboards and, can be applied with a single click.
For those working within specific organizational brand guidelines and needing to incorporate certain colors, custom themes provide a solution to align with these requirements seamlessly.
Check out this blog and learn how to utilize these themes effectively in your dashboard to harness the powerful new styling capabilities.

____________
Attribute Updating
In this update (June 2024) of ArcGIS Dashboards, updating feature attributes directly from within a dashboard is now possible.
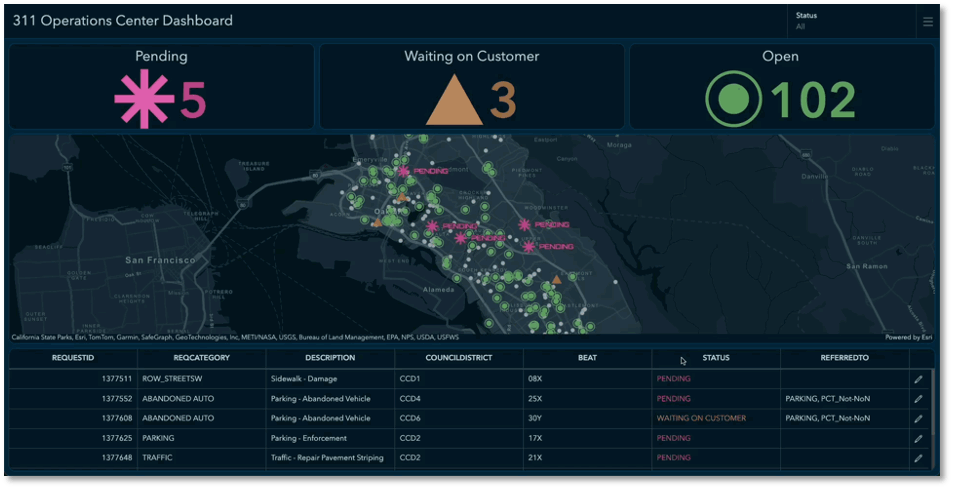
The new dashboard functionality eliminates the need for integrating multiple applications. Now, you can carry out tasks directly within the dashboard, freeing up space for data visualizations.
Additionally, the update introduces advanced forms featuring conditional visibility and calculated default values, all presented in an attractive dialog that harmonizes with your selected dashboard theme.
Check out this blog for a deeper dive into how you can enable and use updating feature attributes in dashboards.

____________
Charting Improvements
ArcGIS Dashboards has undergone significant changes in recent releases to enhance data visualization capabilities. In the June 2024 update, these improvements will be fully realized, enabling the introduction of a wider variety of chart types and features than ever before.
As part of this effort, we have introduced the following new improvements:
- Chart Legend Placement
- Chart Actions in Mobile View
- Keyboard Navigation
- New Chart Defaults
Get ready to explore all the exciting updates and improvements coming to Charts in ArcGIS Dashboards!
Check out this blog to find out what’s in store.
____________
3D Improvements
At the October 2023 update, we introduced the support for 3D Scenes as Data Sources in ArcGIS Dashboards. This allowed our users to include 3D content, which enhances their ability to create a visual narrative that promotes understanding, collaboration, and consensus among stakeholders.
In this update (June 2024), dashboard authors can now select features interactively from a web scene and trigger actions by clicking on the features. This feature is accessible through layer actions.
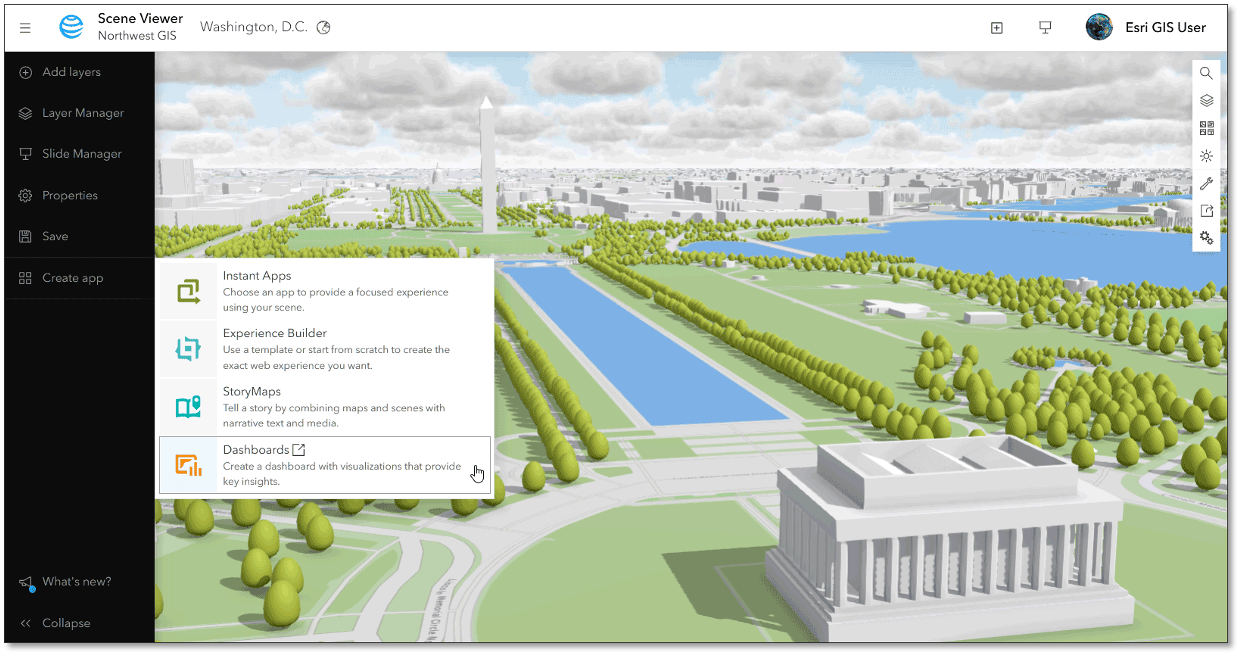
You can also create dashboards directly from Scene Viewer.

____________
Dashboard Accessibility Improvements
In this update, Esri continues improving the A11Y capabilities in its software.
Dashboard viewers can now navigate a chart using the Tab key on a keyboard. Viewers can also use the Enter key to trigger actions on a chart that is a source of actions.
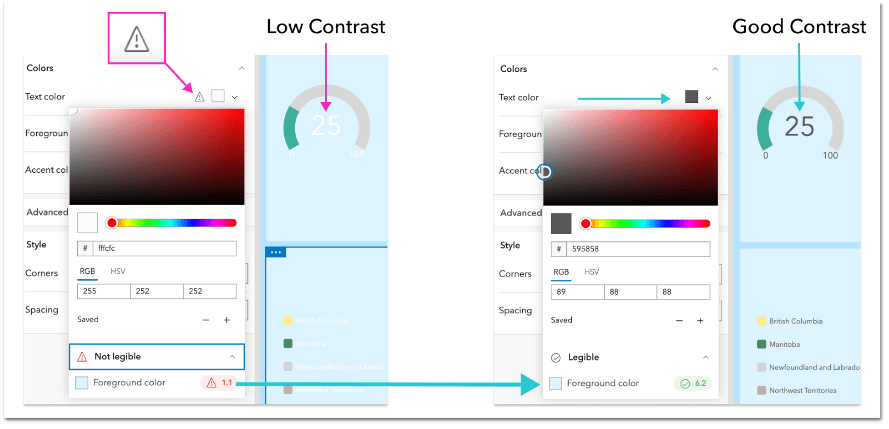
Having an appropriate contrast ratio in a dashboard is crucial for accessibility. It helps people with low vision or color blindness and improves visibility in bright conditions. You can use a built-in contrast checker based on the Web Content Accessibility Guidelines (WCAG) to ensure a good ratio.


Article Discussion: