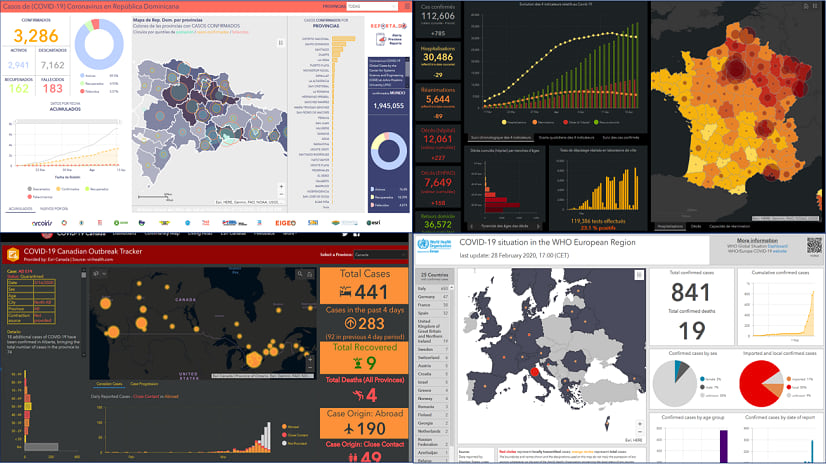
The 2020 Esri User Conference is going virtual and the ArcGIS Dashboards team has prepared a number of presentations to keep you updated on the latest innovations in dashboards. The use of dashboards is at an all-time high, and the use cases are wide-ranging. Anybody can build a dashboard using ArcGIS Dashboards and a variety of audiences can consume them. Learn more at the sessions listed below.

ArcGIS Dashboards
Learn more about ArcGIS Dashboards in the following on-demand sessions, available at anytime throughout the virtual conference.
ArcGIS Dashboards: Designing Effective Dashboards (Tech Session)
Get the most out of the dashboards that you create by learning best practices and discovering essential tips and tricks that will help you build both stunning and effective dashboards. This session will cover simple and advanced strategies for configuring a dashboard’s data visualizations, and will empower you with the knowledge to provide the right information to your audience, the right way.
Using Real-Time Data in ArcGIS Dashboards (Demo Theater)
What are the possibilities of using real-time data with ArcGIS Dashboards? In this presentation, we will explore different scenarios in which real-time data is used with ArcGIS Dashboards. Then we will walk through a specific scenario involving preparing your data, configuring it for online use, preparing the web map, and configuring ArcGIS Dashboards with various widgets to visualize your data.
Dashboards that Matter (User Presentation)
A common tool for optimizing the understanding of locational data is the operational dashboard. Operational dashboards are an amazing tool to communicate location intelligent information through a graphical user interface that can be monitored and managed to provide rapid insights for decision making, monitor KPIs (key performance indicators), reduce operating expense, maximize revenue, and create an optimal end-user experience. Dashboards bring special insights into the realm of data analytics. This is especially true for location information in a GIS.
ArcGIS Dashboards Beta

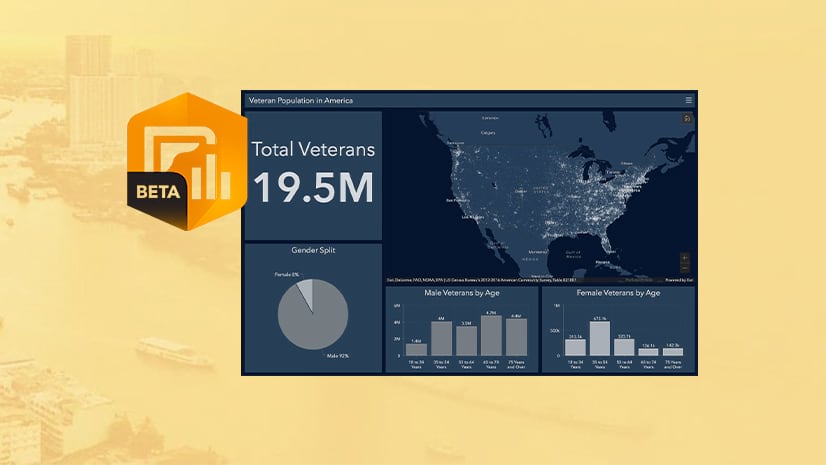
Earlier this year, we launched the ArcGIS Dashboards Beta, a new version of the product built on the ArcGIS API for JavaScript 4.0. The new version brings a number of enhancements and new features, including the ability to use Arcade in dashboards. The following on-demand sessions will highlight more about the beta.
Getting to Know ArcGIS Dashboards (Beta Version) (Demo Theater)
ArcGIS Dashboards Beta is the next version of ArcGIS Dashboards, and includes some exciting new features, additional configuration options and overall improved performance. In this session, we will highlight these improvements as you learn how to create a dashboard, configure different data visualizations and add interactivity through dashboard actions.
ArcGIS Dashboards: Using Arcade (Demo Theater)
Enhanced support for Arcade is an exciting new feature of Operations Dashboards. In this session, you will learn how dashboard authors can effectively leverage Arcade in map styles, labels and pop-ups. You will also learn how Arcade can be used to improve the explanatory value of other dashboard elements via logic-based conditional formatting, mathematical calculations, text manipulation, and so on.
In addition, you can learn more about the future of ArcGIS Dashboards in the following ArcGIS Online streaming live session:
Tuesday, July 14, 7:30 am – 8:30 am PDT
In this session, the ArcGIS Online team will share release plans and demo new capabilities coming in future releases of ArcGIS Online.
ArcGIS Dashboards in the Expo
Find additional resources on ArcGIS Dashboards and chat directly with the team in the virtual expo, available Monday through Wednesday. ArcGIS Dashboards is featured within the ArcGIS Online area. Get more details on expo hours via the online agenda.
Join the ArcGIS Dashboards showcase area here.


Article Discussion: