ArcGIS Monitor collects metrics on the health, performance, and usage of your Enterprise GIS to optimize your GIS and IT investment. It is designed to help administrators ensure their ArcGIS Enterprise deployments are working efficiently by reducing and preventing system downtime; resulting in operational cost savings. Monitor supports the observability pillar of the ArcGIS Architecture Center.
ArcGIS Monitor 2024.1 includes several new enhancements that will help administrators better manage their enterprise GIS deployments. Some of the highlights:
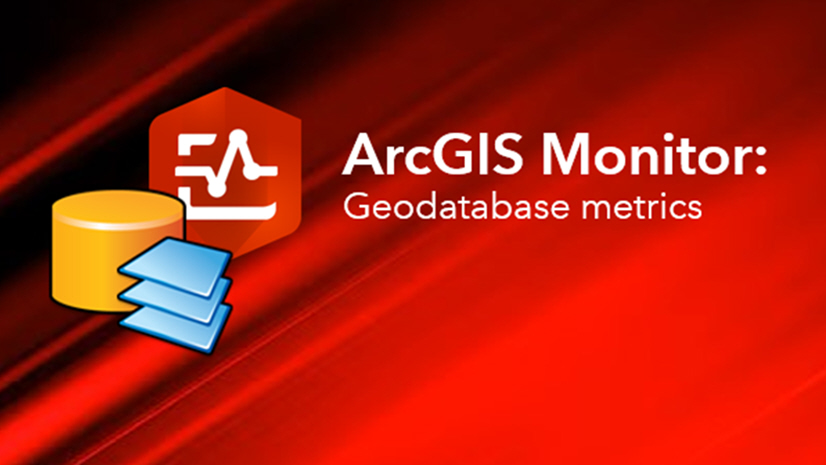
- ArcGIS Monitor can register and collect metrics on the ArcGIS Data Store (relational)
- Export/import of analysis views
- New Table and Rich text elements in analysis views
- New Check-Service user configured observer
- Improved email notifications
- Support for the ArcGIS Web Adaptor (available with ArcGIS Enterprise 11.4)
UPDATE: ArcGIS Monitor 2024.1.1 is now available and it contains several bug fixes found in the 2024.1 release.
ArcGIS Monitor can register and collect metrics on the ArcGIS Data Store (relational)
An ArcGIS Enterprise base deployment consists of an enterprise portal, an ArcGIS Server site (that serves as the hosting server), the ArcGIS Data Store, and two ArcGIS Web Adaptors, see Figure 1.
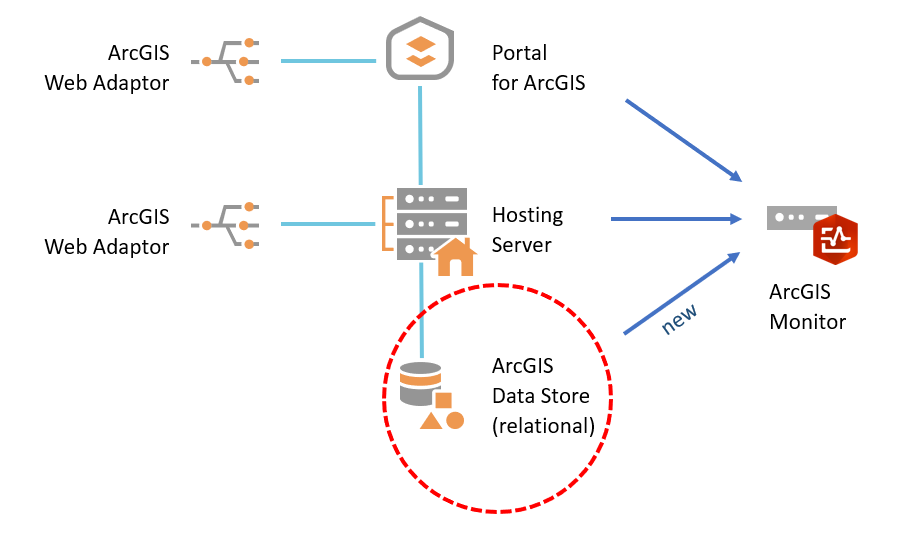
Figure 1: ArcGIS Enterprise base deployment conceptual diagram.
With the ArcGIS Monitor 2024.1 release, administrators can now register the relational ArcGIS Data Store as a new component and collect metrics. Metrics reported include: total number of connections, total number of datasets, storage used, system mode, and the last time a backup was made. The ArcGIS Data Store appears as a new component type on the Monitoring > Components page, see Figure 2. With the addition of this functionality, Monitor now reports metrics on the complete ArcGIS Enterprise stack enabling administrators to better understand the health and performance of their enterprise GIS deployments.
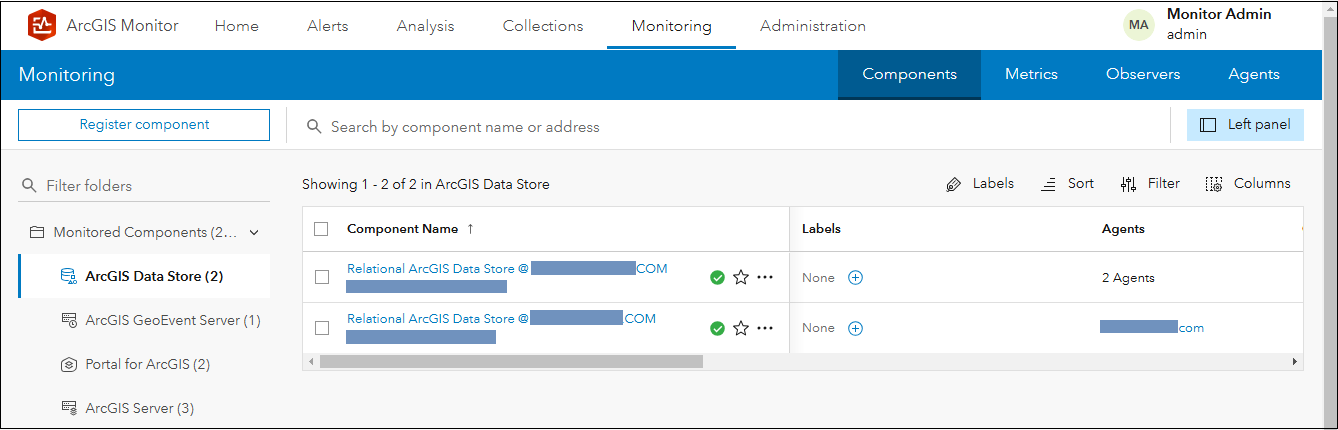
Figure 2: Several ArcGIS Data Stores (relational) registered with ArcGIS Monitor.
Registering an ArcGIS Data Store also adds a new child component type called Dataset, where each dataset component represents a table within the Data Store. If you select an ArcGIS Data Store in the components table, then click the Catalog subtab, you can view all of its dataset components. By default, Monitor will display all tables – to only show a list of hosted feature classes stored in the ArcGIS Data Store, you can apply a filter on the components table (e.g., Subtype is Feature Class), see Figure 3. Selecting a dataset component in the components table will display its geometry type and its metrics: rows total and storage used.
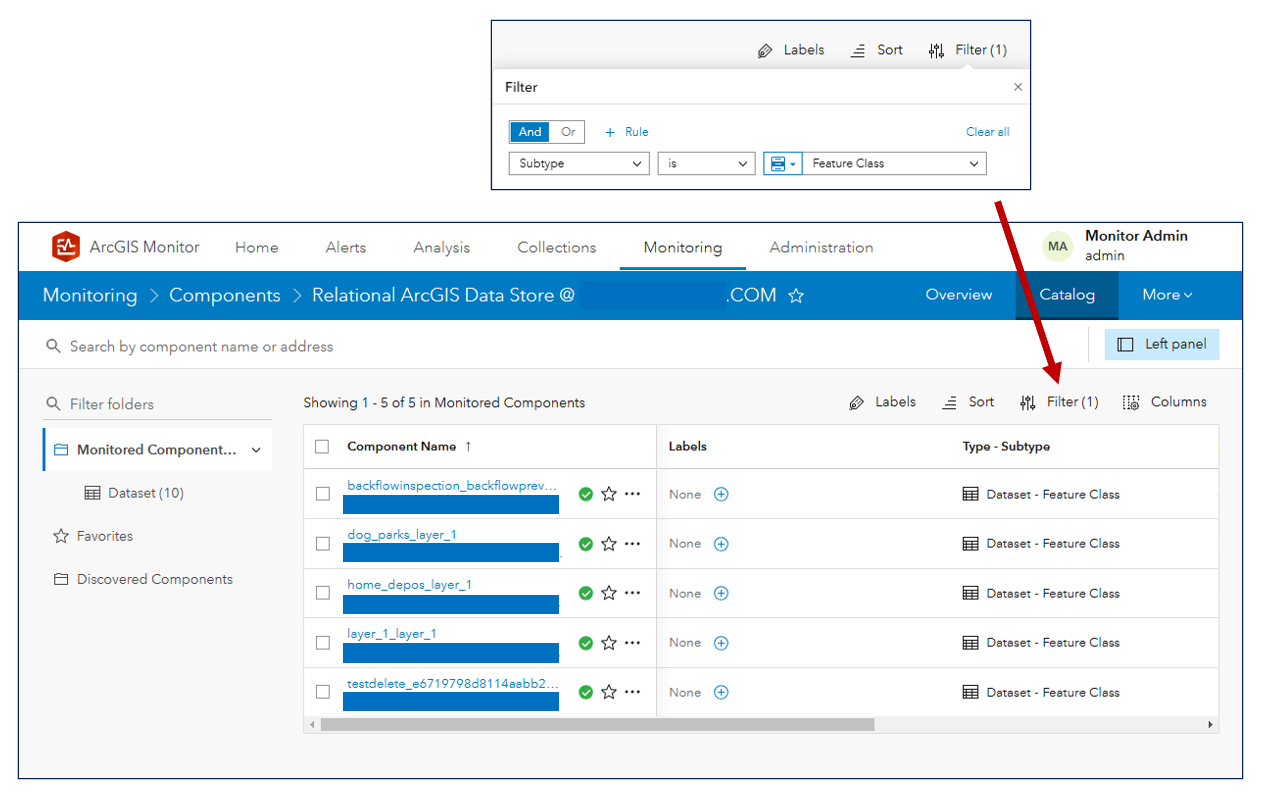
Figure 3: Several dataset components in an ArcGIS Data Store.
By default, Monitor will query the inventory of the ArcGIS Data Store every 15 minutes and check the status of each dataset every 5 minutes. Alerts can be set for the individual metrics reported for both the ArcGIS Data Store and its datasets. For example, you could set an alert for the ArcGIS Data Store when the storage used exceeds a threshold value – to prevent it from automatically switching to read-only mode. Learn more about registering the relational ArcGIS Data Store with Monitor in this help topic.
Export/import of analysis views
Analysis views in ArcGIS Monitor provides reporting of metrics and can help identify patterns on the health, performance, and usage of your enterprise GIS. Configuring them requires an understanding of defining the correct dataview queries to display the appropriate data.
One of the most requested enhancements is the ability to take an analysis view and share it with others. In Monitor 2024.1, you can now export an analysis view as a JSON file. Next, in a separate ArcGIS Monitor instance, you can import the JSON file and deploy as a new analysis view, see Figure 4. This makes the sharing of analysis views much easier. Experienced admins can share their reports with other admins, to help them examine important performance indicators to better manage their enterprise GIS deployments.
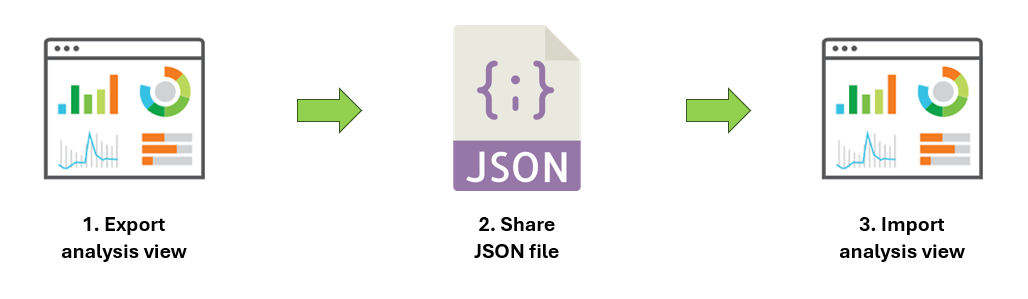
Figure 4: Conceptual diagram of export/import workflow for sharing analysis views.
A new Export button is located in the upper right corner of every analysis view layout in Monitor 2024.1. When selected, the analysis view configuration will be exported as a JSON file, which will take the name of the analysis view with a .json extension. The JSON file will be saved in your web browser’s default download location. Learn more about exporting analysis views.
To utilize the analysis view JSON file in a separate ArcGIS Monitor instance, under the Analysis tab, when you select Create analysis, an option to Import analysis is available (via a dropdown). Selecting this option will prompt you to specify the analysis view JSON file you wish to import. You can specify a new name and description, then click Import analysis. Learn more about importing analysis views.
Some guidelines for configuring analysis views that you plan to share with others:
- Do not define dataview expressions based on component IDs – these will be unique to your ArcGIS Monitor instance and will be different in other Monitor instances.
- If your dataview expressions use labels or component names – these will also need to be defined in the other Monitor instances so the expressions will be valid.
- Do not create dataview expressions based on a collection, because the other Monitor instances might not have the same collection (nor contain the same components).
New Table and Rich text elements in analysis views
To help make analysis views more informative, two new element types were added in Monitor 2024.1. The Table element enables you to display tabular data and the Rich text element displays text in the layout with formatting options. Both can help augment the information conveyed in analysis views.
For the Table element, after configuring the dataview expression – you can choose which fields are displayed in the table. It must contain at least one field. You can also order the data shown based on a particular field. Figure 5 shows an example Table element in Monitor.
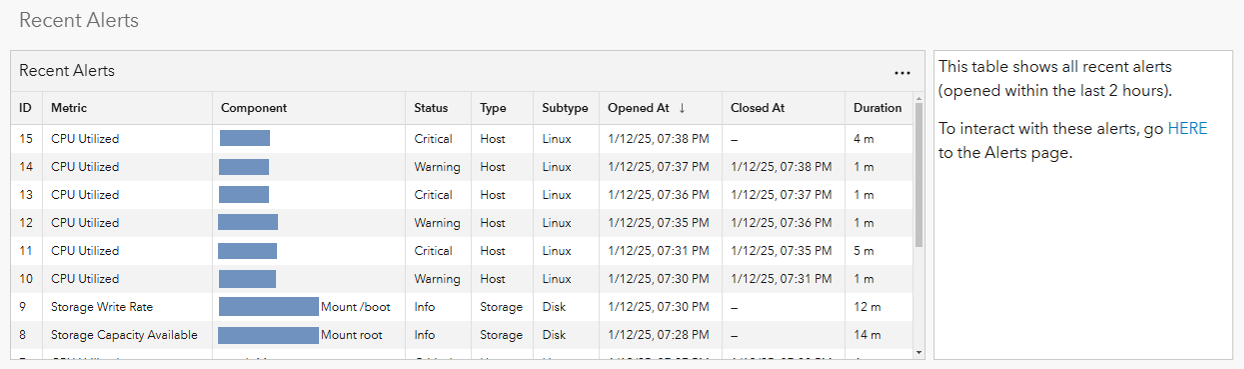
Figure 5: Example Table and Rich text elements in ArcGIS Monitor 2024.1.
For the Rich text element, you can input text, then configure its display properties like color, size, and styles. Adding hyperlinks and images are also supported. The element configuration preview display offers a WYSIWYG user experience. Figure 5 also shows an example Rich text element in Monitor.
New Check-Service user configured observer
Every component in ArcGIS Monitor has observers which are responsible for collecting attribute and metric information about the component. Each component type has a unique set of observers that run at specified intervals. You can view the observers for a component by selecting the component on the Monitoring page > Observers subtab. For example, an ArcGIS Server component has three observers: inventory, logs, and metrics – see Figure 6.
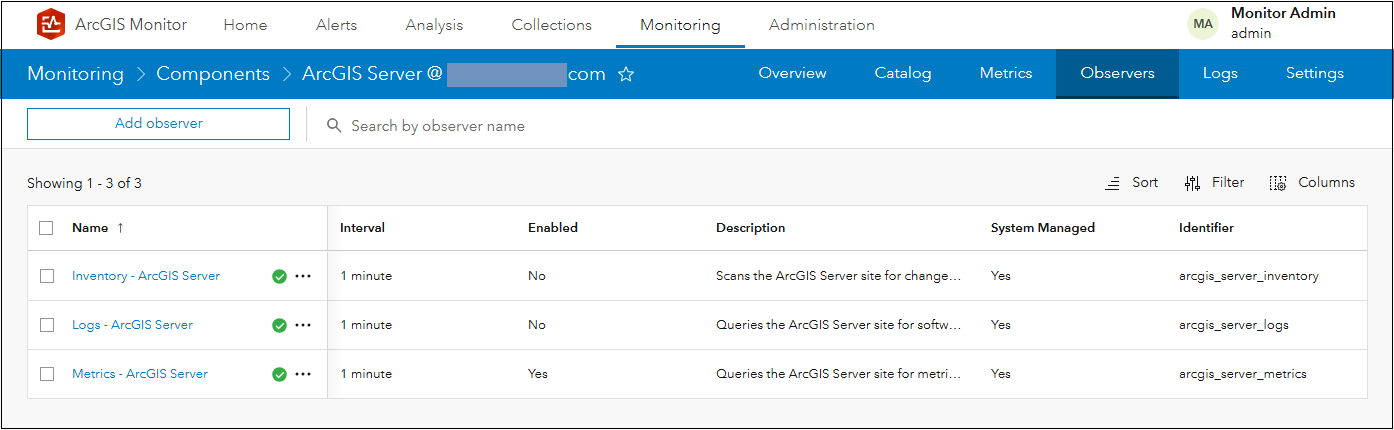
Figure 6: The observers for an ArcGIS Server component.
In Monitor 2024.1, it is now possible to add the new Check-Service observer to any service component registered with Monitor. Once configured, the observer will send an HTTP request to the service and collect information about the HTTP response such as: response time, response size, and HTTP code. When configuring this observer, you can define a “response check” which will be used to validate the content of the response body. For example, you can specify a string value to search in the response and the number of matches of the string will be reported back. This observer helps admins check that the service is working properly.
This is enabled under Monitoring > select an ArcGIS Server component > Catalog subtab > select a web service (to apply the Check-Service observer) > Observers subtab > then click Add observer. This will display the Add observer panel as shown in Figure 7. Learn more about working with the Check-Service observer in this help topic.
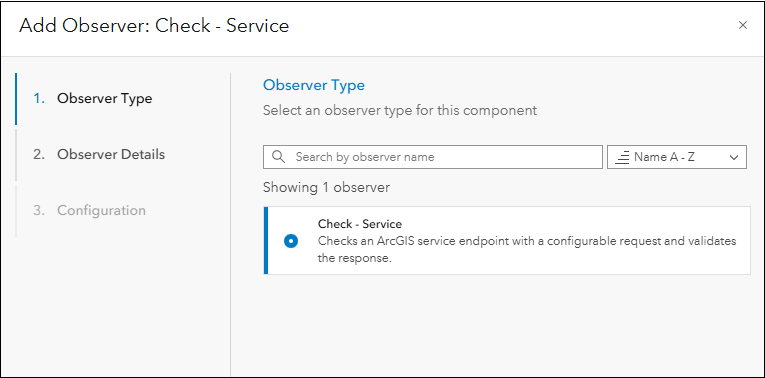
Figure 7: The Add Observer panel in ArcGIS Monitor 2024.1.
Improved email notifications
In Monitor 2024.1, improvements have been made to notification emails sent by Monitor. Emails now include specific information about the event that triggered the notification. Emails can also be configured with a custom subject line. These enhancements are part of an ongoing effort to make it easier for admins to understand the cause of the notification when they check the email. Figure 8 shows an example email notification.
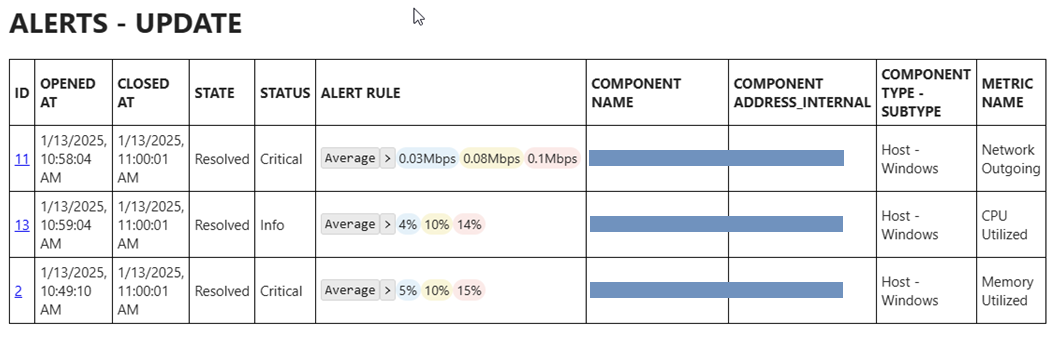
Figure 8: Example email notification of alerts updates in ArcGIS Monitor 2024.1.
Support for the ArcGIS Web Adaptor (available with ArcGIS Enterprise 11.4)
A frequently requested deployment pattern is for ArcGIS Monitor to support a reverse proxy connection to access the Monitor web app. A reverse proxy server is typically deployed in a demilitarized zone (DMZ) and handles requests by forwarding them to machines in your internal network. By forwarding requests, the reverse proxy server masks the identity of the machines behind your organization’s firewall, in this instance ArcGIS Monitor Server, thus protecting it from being attacked directly by internet users.
Starting at Monitor 2024.1, ArcGIS Web Adaptor 11.4 can be configured to proxy requests to ArcGIS Monitor. When setting up the ArcGIS Web Adaptor, one of the options is to configure it to work with ArcGIS Monitor, see Figure 9. This can help provide better security for accessing the Monitor web app. Learn more in this help topic.
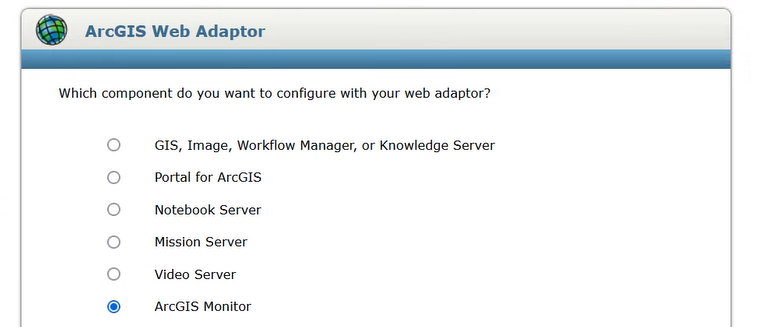
Figure 9: ArcGIS Web Adaptor 11.4 configuration wizard showing ArcGIS Monitor.
This release includes many other enhancements such as: additional metrics collected for the ArcGIS Server and the ArcGIS GeoEvent Server components, and the display of CA certificate and software license expirations on the Monitoring page. A complete list of updates are listed in the ArcGIS Monitor 2024.1 release notes.
To learn more and connect with us about ArcGIS Monitor 2024.1, please visit:
- Product Page
- ArcGIS Monitor help documentation
- ArcGIS Monitor: An Overview – Esri UC 2024 tech session video
- ArcGIS Monitor: Techniques for Analyzing Common Operational Scenarios – Esri Dev Summit 2024 tech session video
- ArcGIS Monitor User Group Meeting 1 – Analysis Views video
- Esri Community
Sincerely,
The ArcGIS Monitor team

Article Discussion: