We are excited to announce the latest updates to ArcGIS for Microsoft 365, which includes significant enhancements to ArcGIS for Excel and ArcGIS for SharePoint. These updates are designed to streamline your workflows, enhance data visualization, and provide powerful tools for spatial analysis. Let’s dive into the new features and how they can benefit you.
Don’t have time to read the blog article? Watch the video below for a quick overview.
Quick links
ArcGIS for Excel
ArcGIS for Excel has been significantly enhanced with support for GeoJSON and JSON files, expanded filtering functionality, and the ability to perform buffer and drive time analysis, without storing layers. Key updates also include enhancements to the Function Builder, which now provides several new functions, expanding its mapping capabilities and making it more versatile. These improvements provide users with greater precision, seamless data integration, and more efficient data analysis.
New Data Format Support
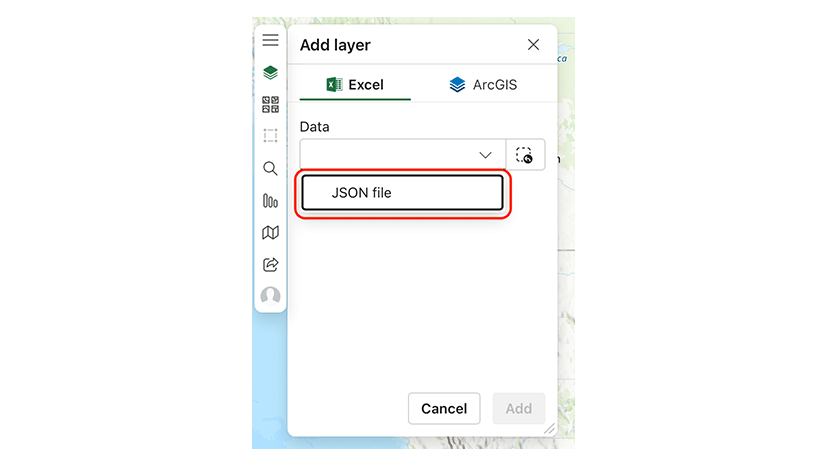
With the March release, ArcGIS for Excel now supports GeoJSON and JSON files, significantly expanding the range of spatial formats it can handle. This enhancement not only saves you time but also simplifies the process of data preparation. You no longer need to convert these data formats before using them in Excel. Once uploaded, the data is automatically converted into EsriJSON, which can then be used to generate features, polylines, or polygons on a map. This direct visualization of GeoJSON and JSON data enhances your ability to create detailed and accurate maps. By supporting these formats, ArcGIS for Excel integrates more seamlessly with other GIS tools and platforms that use GeoJSON and JSON. This ensures that you can continue to use your existing data and workflows without disruption, making the entire mapping process more efficient.
Enhanced Functionality
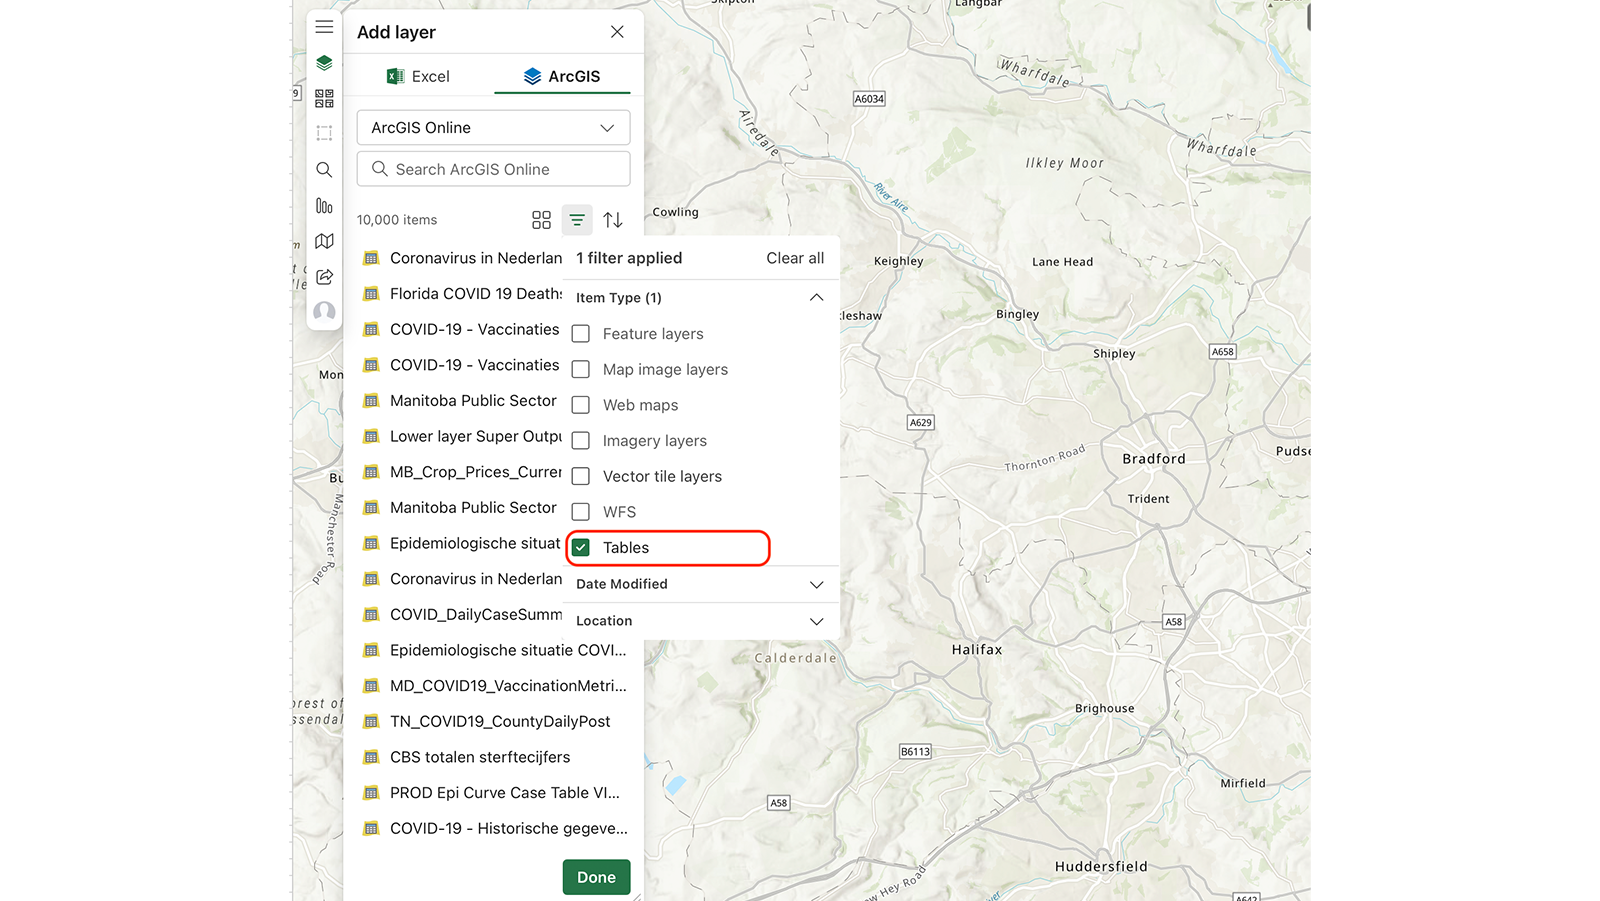
ArcGIS for Excel has also expanded its filters functionality to include ArcGIS hosted tables. This enhancement allows you to filter tables, providing a more comprehensive search experience and making it easier to find and analyze specific datasets. It allows you to quickly locate and focus on the relevant data, thus enhancing your ability to conduct detailed analyses, and make informed decisions.
With the latest update, ArcGIS for Excel provides the ability to generate temporary layers for buffer or drive time analysis directly within the application. It allows you to conduct your analyses in real time, providing immediate insights without the hassle of saving and managing additional layers. This keeps your ArcGIS content organized and clutter free.

Spatial Aggregation
With the latest update to ArcGIS for Excel, users can now perform spatial aggregation directly within Excel. Spatial aggregation is the process of summarizing data from one layer based on the boundaries of another layer. This allows users to combine and analyze data within specific geographic areas, providing deeper insights and enabling more informed decisions.
The ArcGIS for Excel spatial aggregation tool empowers users to choose the specific layer they want to aggregate (the active layer) and the polygon layer within which they intend to aggregate. Users have the flexibility to select fields for inclusion in summary statistics and choose the type of statistic they want to apply, such as mean, median, sum, or count. This feature provides powerful data analysis capabilities, allowing users to gain deeper insights into their spatial data and make more informed decisions.
For example, imagine you are a city planner analyzing public parks. You have a point layer of park locations and a polygon layer of neighborhood boundaries. By using the spatial aggregation tool, you can count the number of parks and calculate the average park size in each neighborhood. This information helps you identify areas that need more parks or where existing parks might be too small, enabling data-driven urban planning decisions.
New Visual Effects
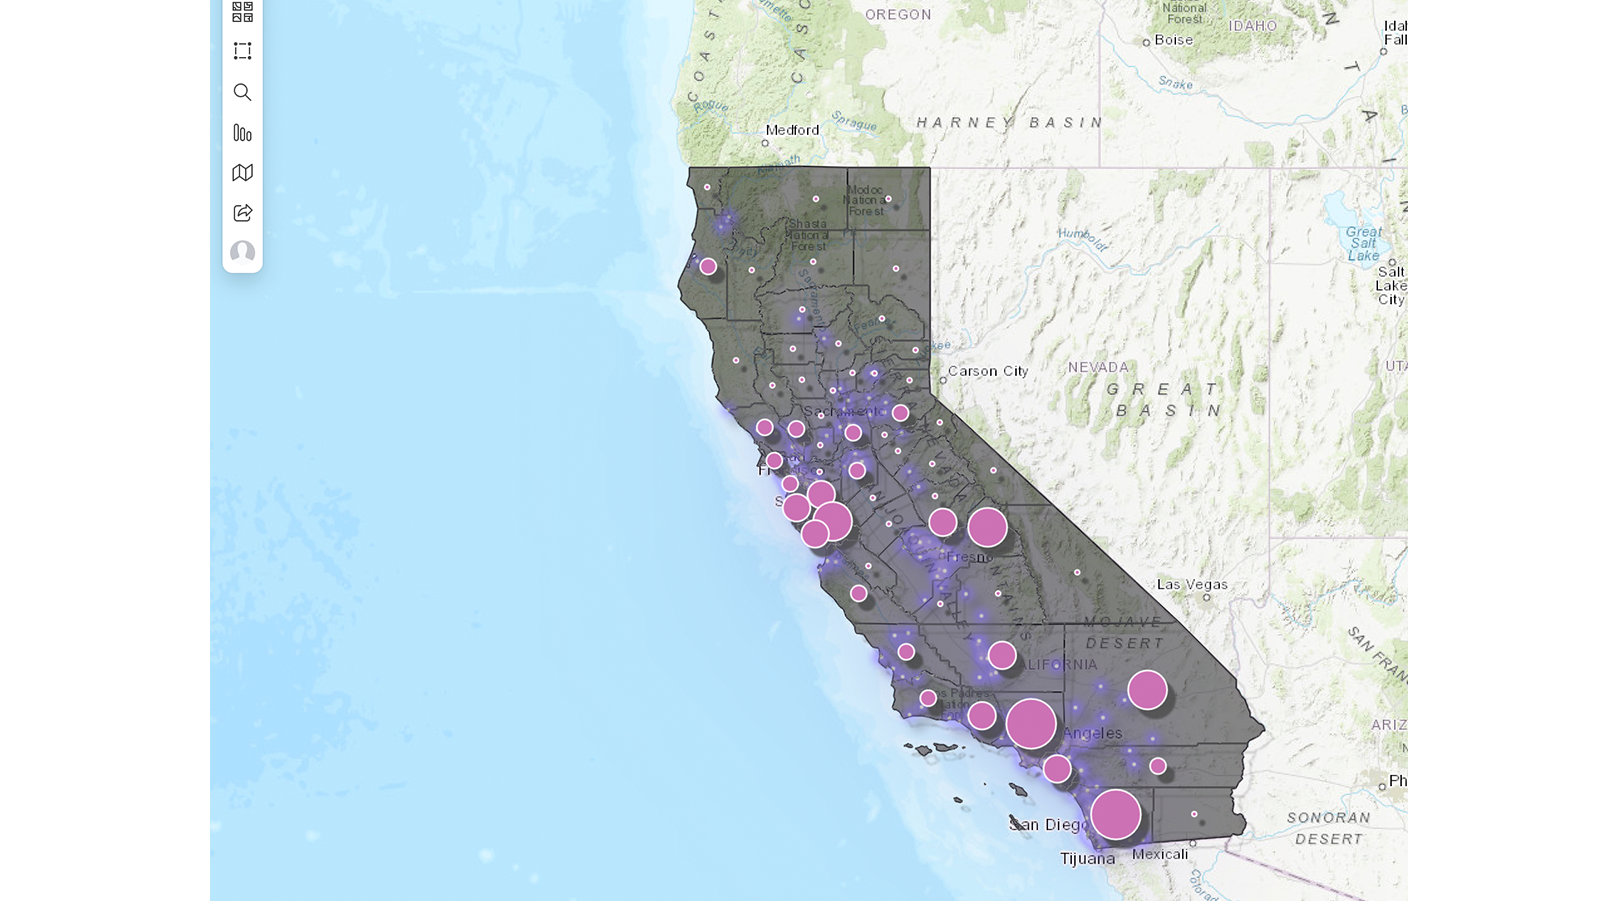
We have introduced new layer effects to elevate the mapping visualization in Excel. These effects, including bloom and drop shadow, add a level of sophistication usually found in graphic design software such as Photoshop. The bloom effect adds a soft, glowing halo around map features, making them more prominent and creating a dynamic visual impact. This is especially useful for emphasizing important points or areas, such as key landmarks or high-traffic zones. The drop shadow effect adds a subtle shadow beneath map features, giving them a sense of depth and making the map appear more three dimensional. This helps in differentiating overlapping layers and improves the overall visual hierarchy of the map. These enhancements make your maps more visually appealing and easier to understand.
New Functions
Function Builder in ArcGIS for Excel has also been significantly enhanced with several new functions to boost your mapping capabilities:
- Create JSON Lines & Polygons—This function generates an EsriJSON polyline or polygon using a set of vertex coordinates. By allowing the creation of complex geometries directly on a map, it ensures a high level of precision in visualizing and analyzing spatial data. It streamlines the process of creating and manipulating complex shapes, making it easier to conduct in-depth spatial analysis.
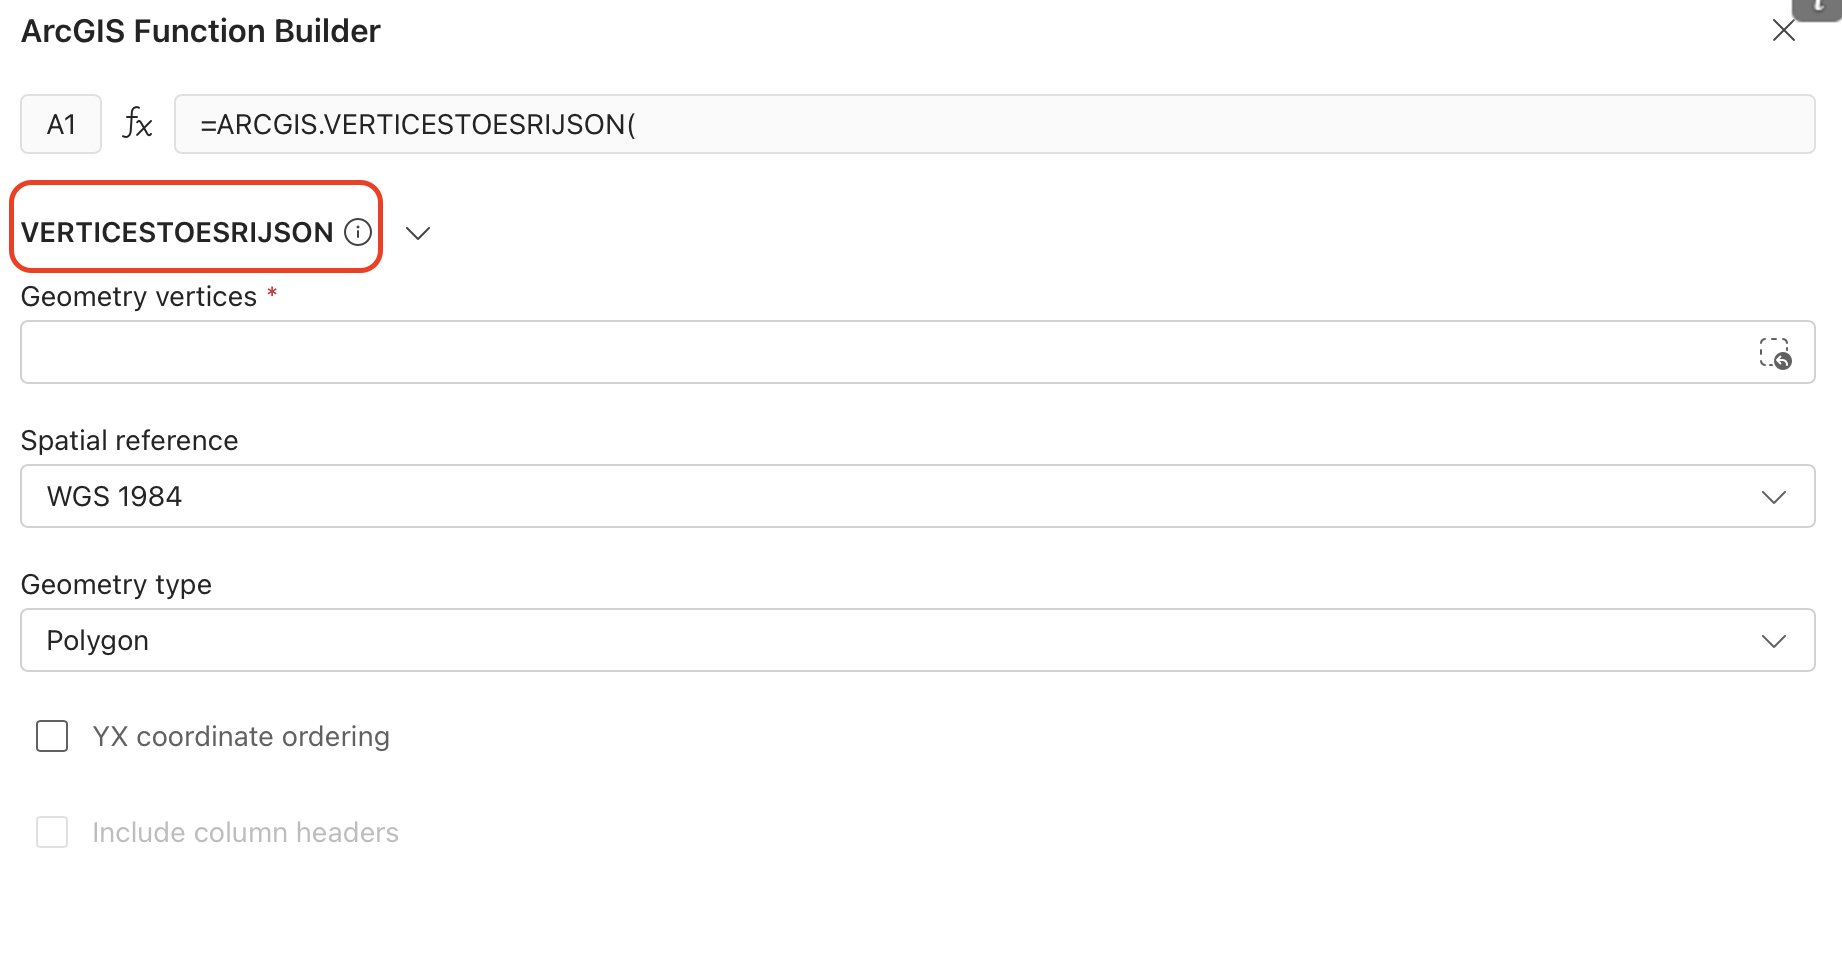
- Convert JSON Formats—This function facilitates the conversion of geometry from non-Esri formats to EsriJSON geometry. It is a crucial tool for those who work with data from multiple sources and formats, ensuring that all data can be seamlessly integrated and used within ArcGIS for Excel. This makes it easier to bring in and work with external data without the need for manual conversion or additional software.

- Get Geometry by Level—This function allows you to obtain specific geometries based on the desired geographic level, such as cities, states, or custom regions. It simplifies the process of accessing and visualizing specific areas of interest. This feature helps you focus on the areas that matter most, enhancing the accuracy of geographic data visualization

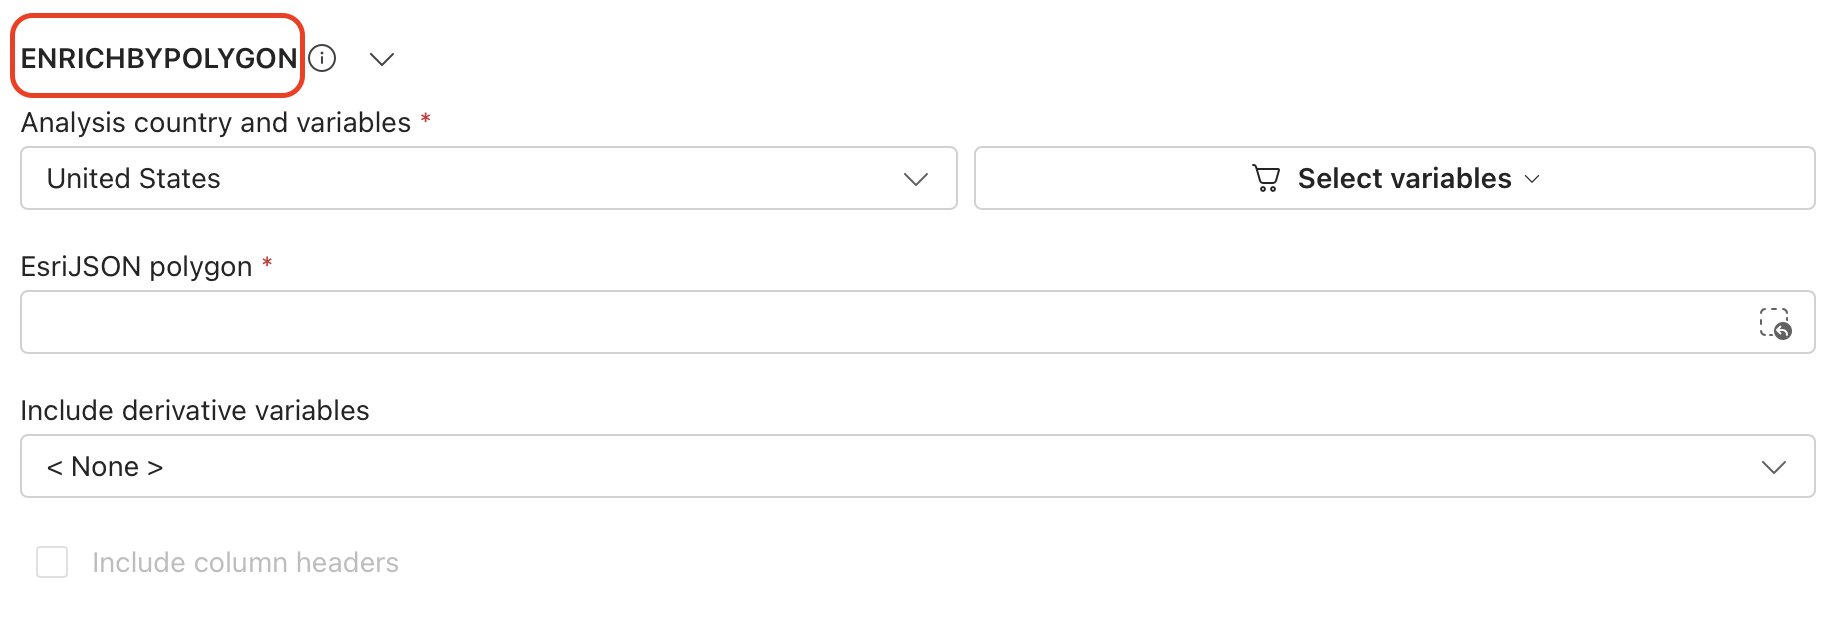
- Enrich Data by Polygon—This function retrieves detailed information about people, places, and businesses within a defined area. It provides valuable insights and context for spatial analysis. This feature helps you to understand the demographic and economic characteristics of specific regions. By enriching data with relevant information, it enhances the depth and quality of spatial analysis, leading to better decision-making and strategic planning.

ArcGIS for SharePoint
ArcGIS for SharePoint release updates are designed to streamline workflows, improve data management, and provide advanced analysis capabilities. By integrating with ArcGIS Connectors for Power Automate for EXIF data extraction, we automate metadata captured in SharePoint. We’ve also enhanced geotagging in ArcGIS for SharePoint, making geotagged documents easily accessible in feature tables and pop-ups. You can now create temporary analysis layers without cluttering storage, and our new spatial aggregation tool provides robust data analysis. These updates collectively provide a more seamless, efficient, and insightful user experience. Continue reading to learn more about each feature.
Enhanced Functionality
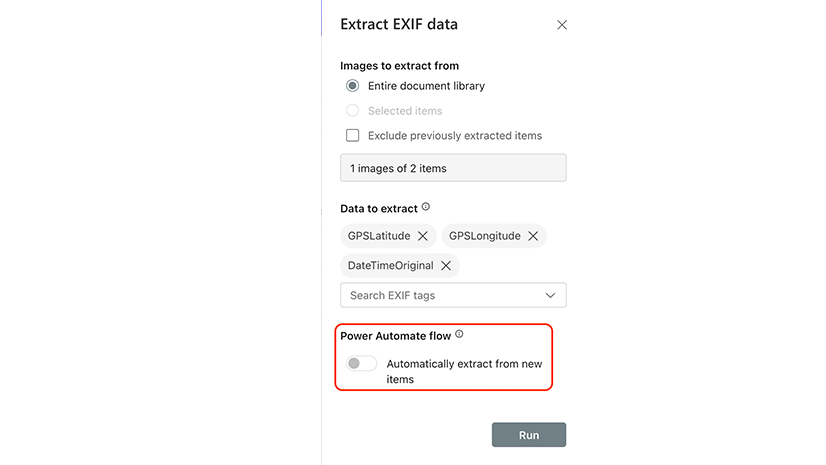
Using ArcGIS for SharePoint and Power Automate, you can now automate the workflow for extracting EXIF metadata from images using an ArcGIS Connectors for Power Automate action. When new images are uploaded to a SharePoint library, this feature automatically extracts the EXIF metadata, such as location, date, and time, and stores this information directly in SharePoint. This automation not only saves time and reduces manual effort but also ensures that metadata is consistently and accurately captured and stored, which is crucial for organizations that rely on geotagged images for documentation, analysis, and reporting.
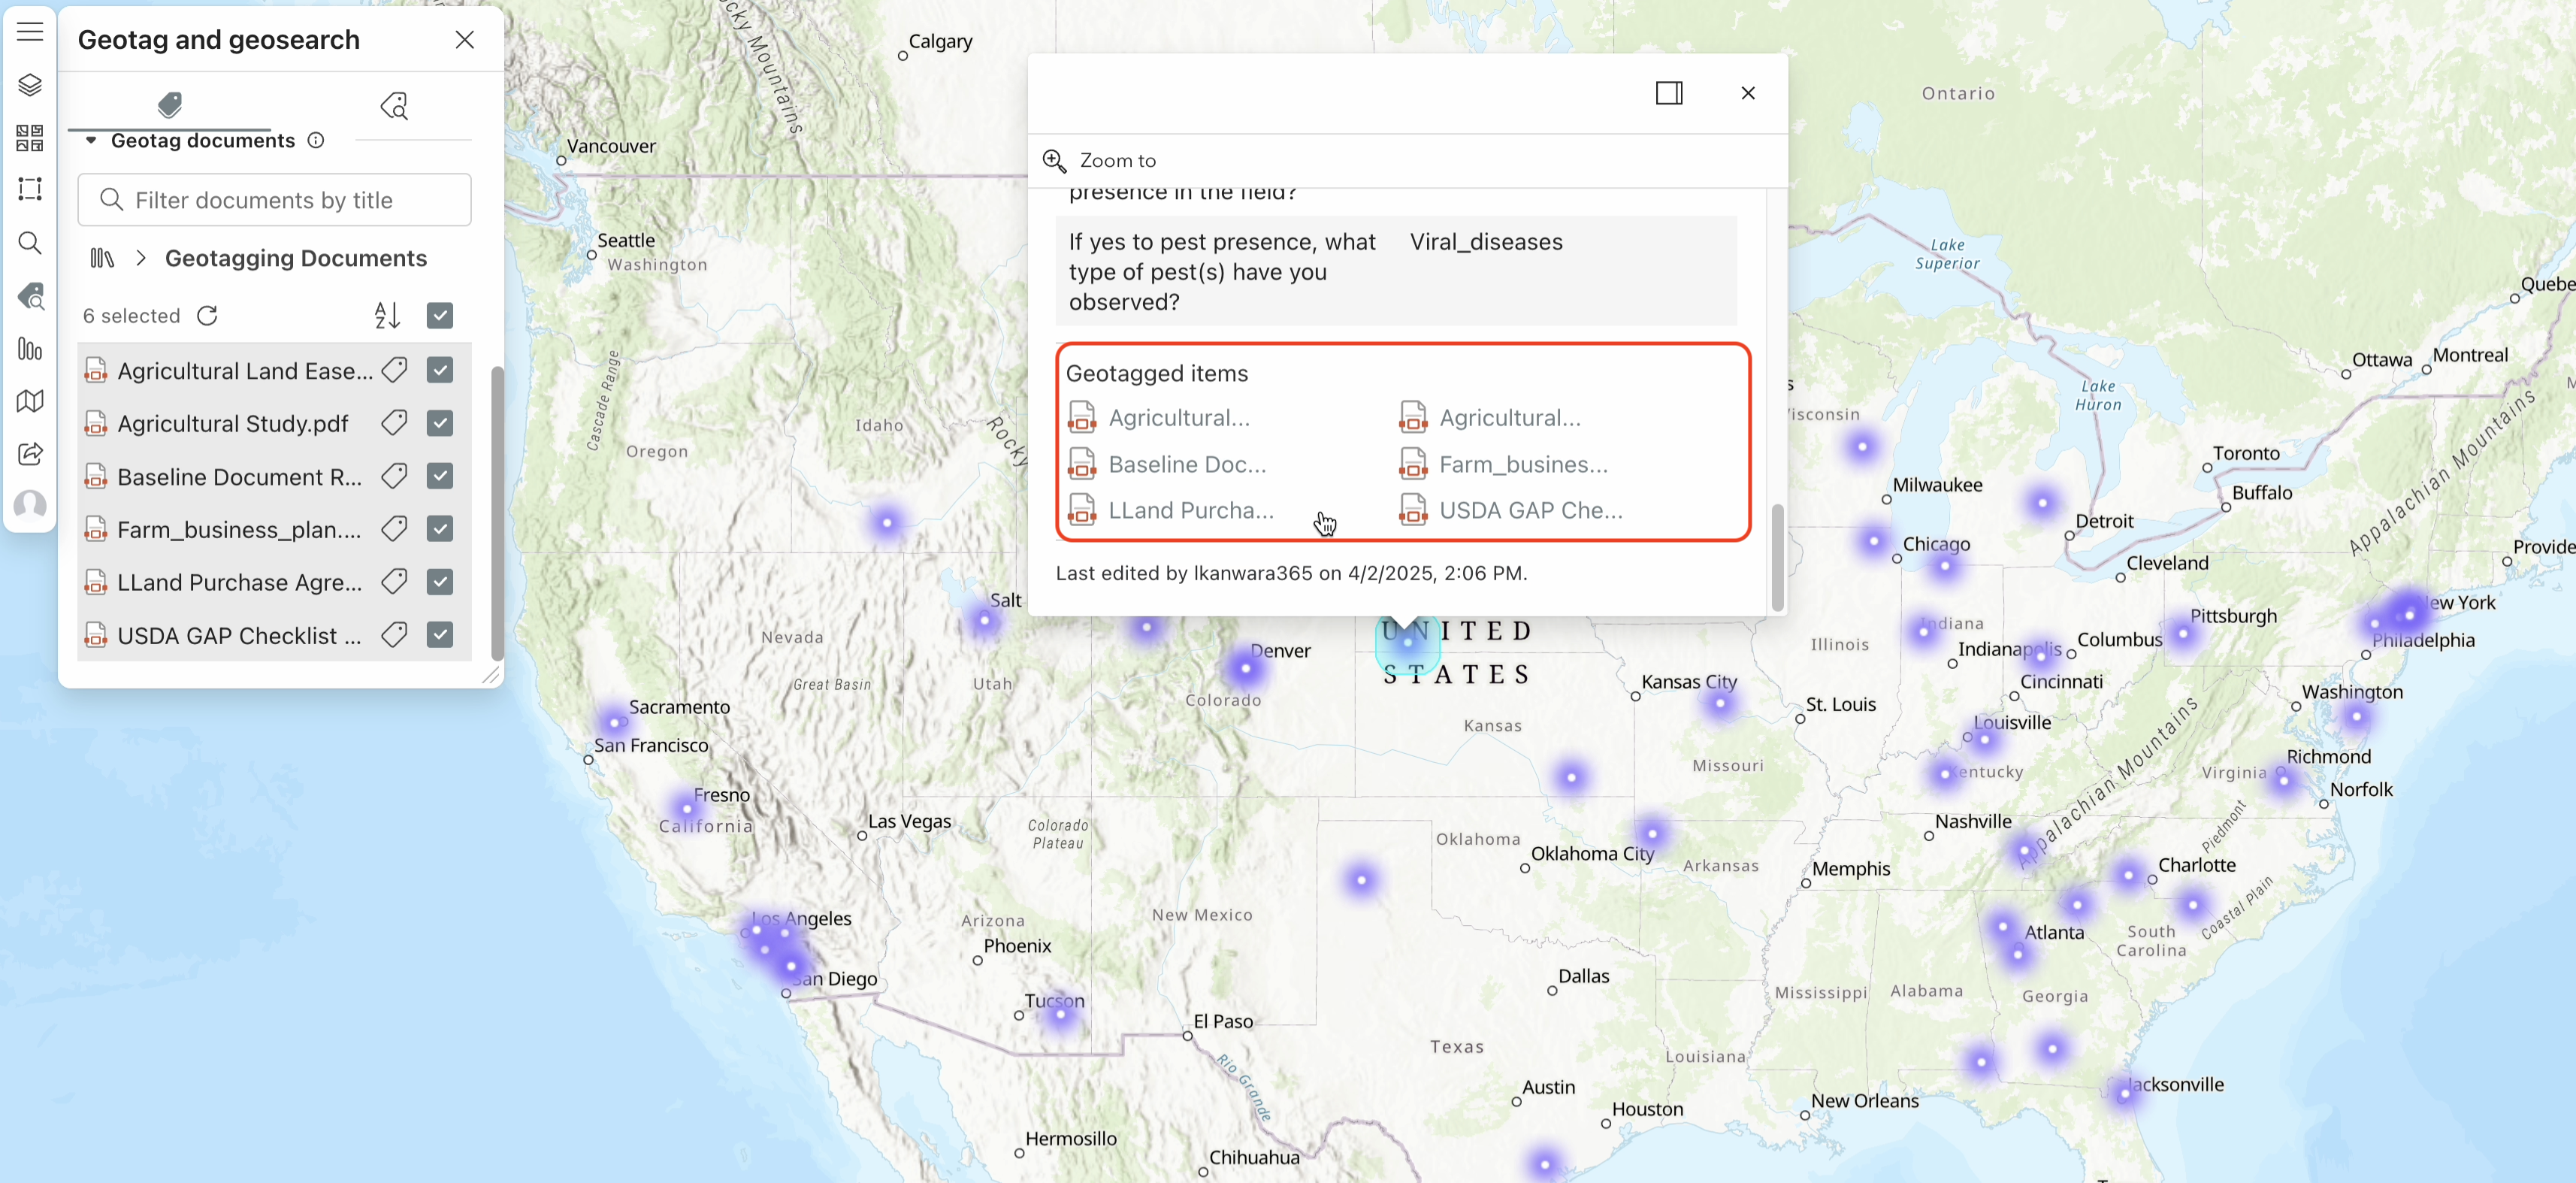
We also enhanced the geotagging feature in ArcGIS for SharePoint, allowing users to access and open geotagged documents directly from the feature’s pop-up in ArcGIS Online and ArcGIS Enterprise. Users can now discover and open geotagged SharePoint documents without leaving the ArcGIS software, which fosters better collaboration between SharePoint and ArcGIS users. Quick and easy access to geotagged documents improves workflow efficiency and ensures that critical information is readily available when needed. This geotagging feature helps you focus more on critical tasks and less on navigating multiple systems to find the necessary documents.
This update to ArcGIS for SharePoint includes functionality similar to ArcGIS for Excel, allowing you to generate temporary layers for buffer or drive time analysis directly within the site. It allows you to conduct analysis on the fly without the need to save temporary layers in ArcGIS. By avoiding the creation of permanent hosted feature layers, the ArcGIS environment remains organized and clutter free, making it easier to manage and find the layers and data.
Spatial Aggregation
ArcGIS for SharePoint now includes the same spatial aggregation capabilities available in ArcGIS for Excel, enabling users to efficiently summarize and analyze spatial data across platforms. This feature enables users to perform spatial aggregation directly within SharePoint, allowing for the summarization of data from one layer based on the boundaries of another layer. By selecting specific layers for aggregation, choosing fields for summary statistics, and applying various statistical methods like mean, median, sum, or count, users can gain deeper insights into their spatial data. This functionality empowers SharePoint users to analyze and combine data within specific geographic areas, facilitating informed decision-making processes.
New Visual Effects
ArcGIS for SharePoint offers the same layer effects introduced in ArcGIS for Excel, enhancing consistency and functionality across platforms. These effects, such as bloom and drop shadow, bring a new level of sophistication to mapping visualizations within SharePoint. The bloom effect creates a soft, radiant halo around map features, enhancing their visibility. This feature is particularly beneficial for highlighting crucial points or areas, like significant landmarks or high-traffic zones. Similarly, the drop shadow effect introduces a subtle shadow beneath map features, providing a sense of depth and enhancing the three-dimensional appearance of the map. By incorporating these effects, users can effectively differentiate overlapping layers, improve the visual hierarchy of their maps, and ultimately create visually appealing and easily understandable mapping visualizations.
Additional resources
The recent release updates are designed to make your spatial analysis more efficient, accurate, and visually engaging, enhancing your workflow in Excel and SharePoint. We are committed to continuously improving our products to meet your needs and help you achieve your business goals.
To get the most out of these capabilities and stay updated, explore our additional resources, including the Esri Community pages for ArcGIS for Excel and ArcGIS for SharePoint, as well as the ArcGIS for Microsoft 365 product page and What’s new in ArcGIS for Microsoft documentation.

Article Discussion: