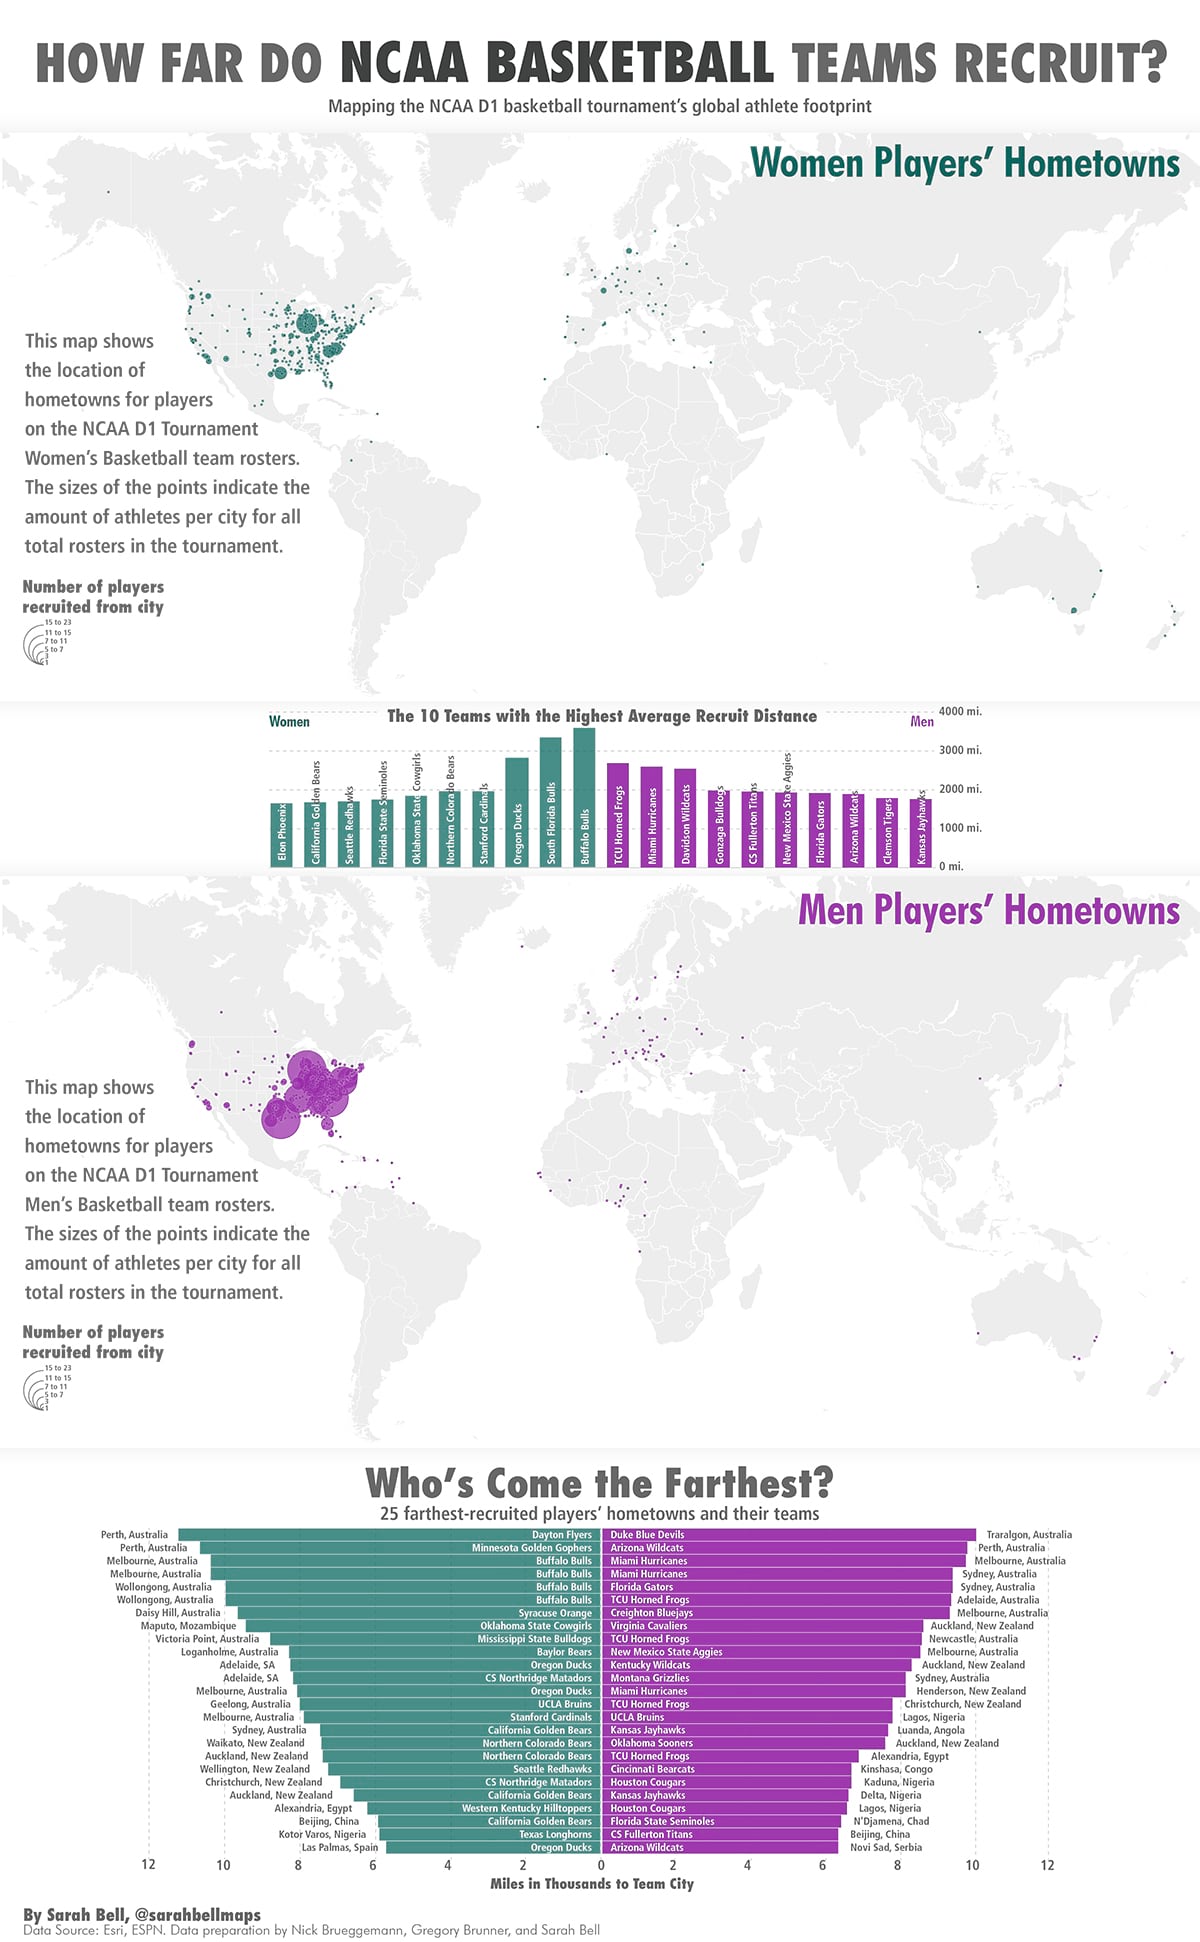
My colleagues Nick Brueggemann and Gregory Brunner made a map of the NCAA Tournament teams’ rosters showing where the bracket athletes’ hometowns are. The data comes from this sports website‘s NCAA Roster information, where they list the athletes’ positions, class, hometown, and other statistics. I asked Nick and Greg if they’d share the geodatabase they created. From that database, I made some handy shapefiles, and was able to add those shapefiles from my local drive to the ArcGIS Maps for Adobe® Creative Cloud® app (M4CC) inside of Adobe Illustrator®.
To make these maps, I drew my mapboard at the full global extent, and then added the Women’s roster shapefile and Men’s roster shapefile using the Compilation window. For more information on how to add data to the M4CC Compilation window, check out this useful documentation page.
The M4CC app allows you to access ArcGIS Online‘ s smartmapping tools directly while inside of Adobe Illustrator. I was able to use the graduated symbology to size the athletes’ hometown points by the amount of players that come from there. Here’s a previous post I wrote showing how to access the Smart Mapping tools using M4CC.
To calculate the distance between each player’s hometown and their team’s city, I used a handy map math formula in Microsoft Excel. From there, I was able to create bar charts inside of Adobe Illustrator.
It’s interesting to see how far some athletes have relocated!
For more posts and updates on Maps for Creative Cloud, you can follow them here.


Commenting is not enabled for this article.