We all like to track our small (or maybe big!) outdoor adventures and share them with our family and friends. In this article I’ll share some ideas on how to display outdoor data on an interactive 3D web map. We’ll also use the elevation profile widget to plot it in a chart. At the end we’ll also look into how to display the photos from your adventure directly on the map.
Whether you record it using your phone, your watch or a GPS device, most of the time your data will end up in a gpx or tcx format. To be able to read this data in ArcGIS API for JavaScript, we’re going to use togeojson, a small library written by Tom MacWright. Let’s have a closer look at two examples: a bicycle and a paragliding gpx track.
Visualizing a bicycle track
Using togeojson we can load a bicycle gpx track and display it on a 3D map using ArcGIS API for JavaScript:
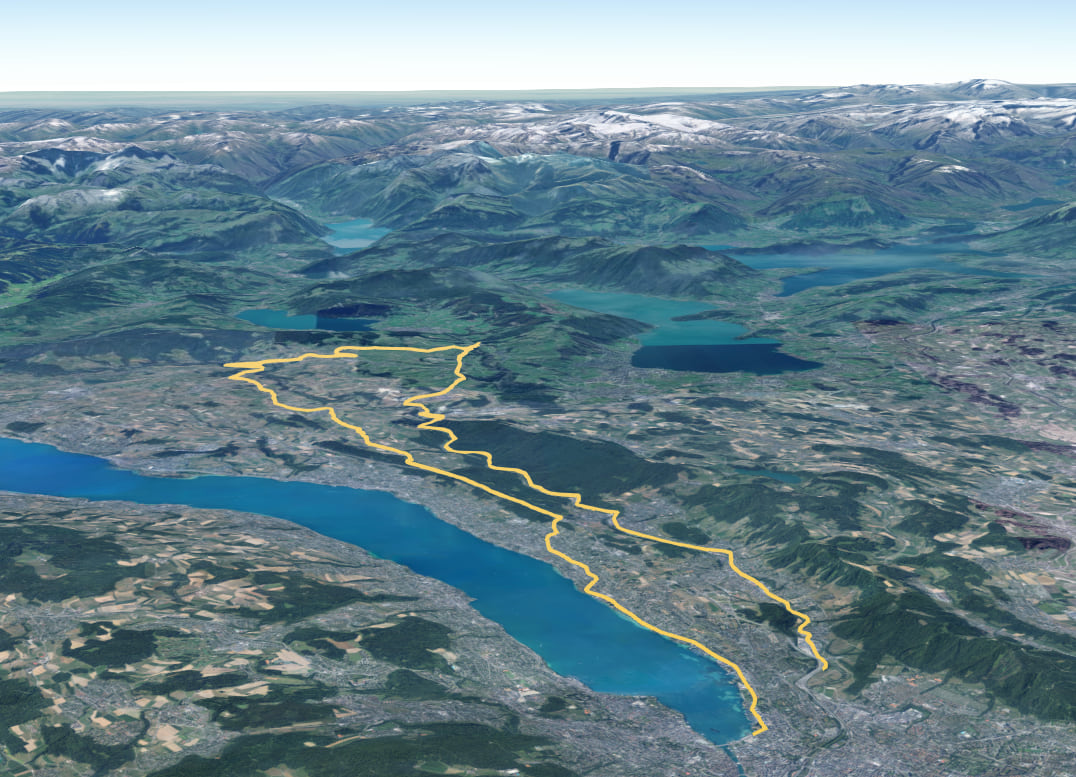
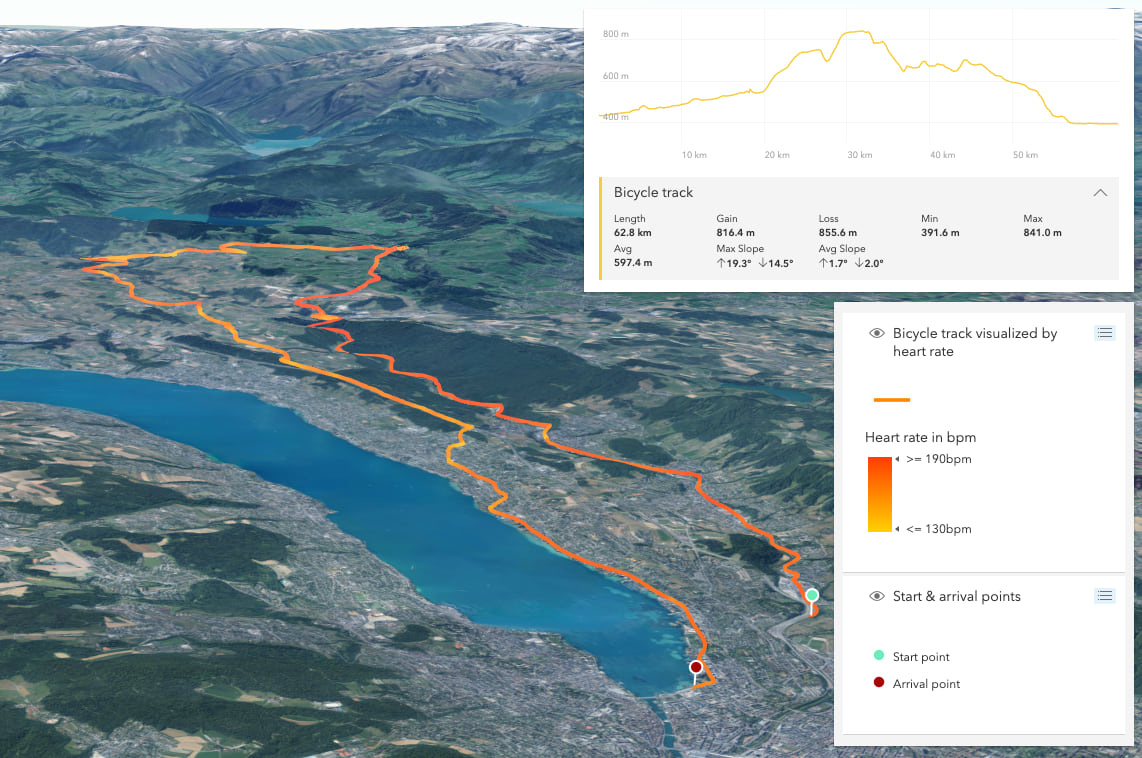
To display an elevation profile of the track and add more information about length, altitude or steepness, we can import the elevation profile widget and connect it to our track. Here’s the JavaScript code snippet to add the widget:
const elevationProfile = new ElevationProfile({
  view: view,
  container: "profile",
  // pass the bike track geometry into the input property
  input: {
    geometry: geometry
  },
  profiles: [
    {
      // displays elevation values from the input geometry
      type: "input", //autocasts as new ElevationProfileLineInput()
      color: "yellow",
      title: "Bicycle track"
    },
  ],
  // UI elements that shouldn't be visible
  visibleElements: {
    sketchButton: false,
    selectButton: false
  }
});

// add the elevation profile to the view UI
view.ui.add(elevationProfile, "top-right");
And here’s the live application where you can try it out for yourself:
I also added the start and end point of the bicycle ride, marked with green and red points. The dataset has information about the heart rate as well, so I created a second layer where I’m splitting the data in different segments and visualizing the heart rate value on each segment:
Visualizing a paragliding track
An interesting use case is visualizing flight data in 3D. The following example shows a paragliding gpx track above the Alps in Switzerland:
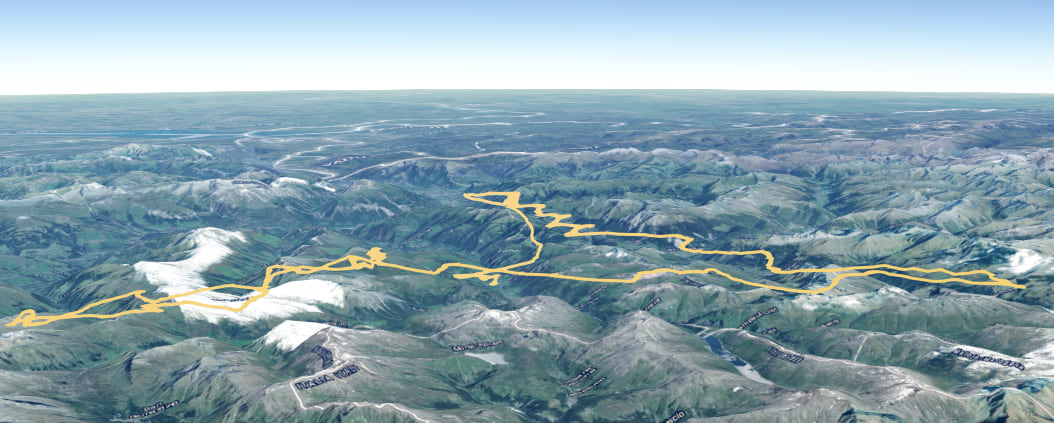
You might notice that when features are positioned in the air, it’s hard to know where they are placed and how high from the ground they are. Most of the time navigating in the map helps to understand the position, but in this case I decided to add a vertical semi-transparent wall that connects the line to the terrain:
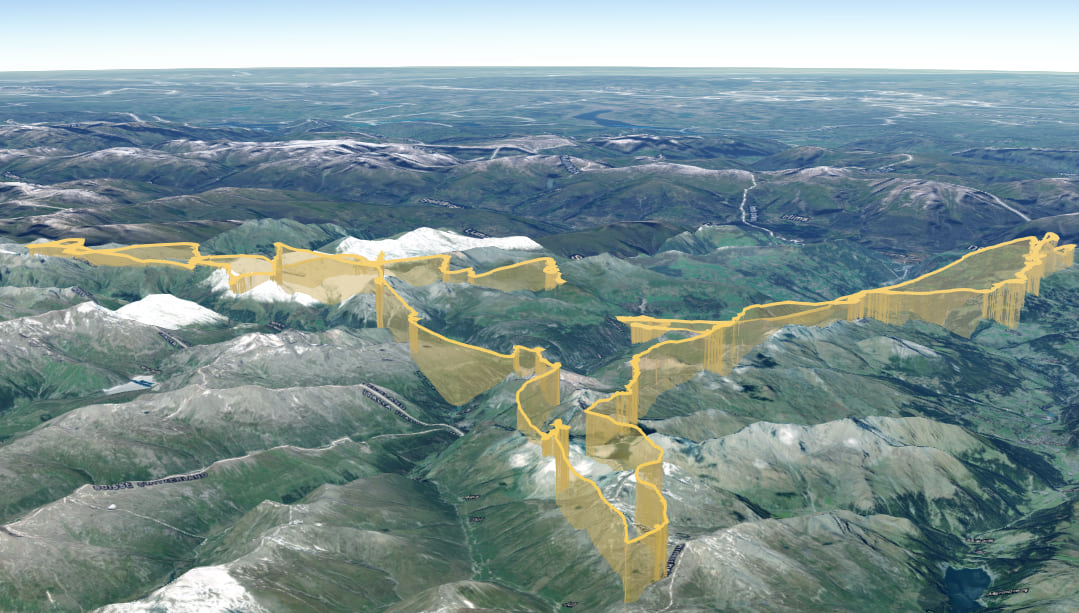
We can create this visualization in several ways. One option is to add the geometry in another layer and symbolize it with a PathSymbol3DLayer for the vertical wall. The solution I used is to create a symbol with multiple symbol layers. So I added a PathSymbol3DLayer to the existing LineSymbol3DLayer. By setting the anchor position of the path symbol layer to ‘top’, the vertical wall will be placed below the actual geometry. Here’s what this looks like in code:
const lineSymbol = new LineSymbol3D({
  symbolLayers: [
    // a symbol layer displayed in screen space
    new LineSymbol3DLayer({
      material: { color: [245, 203, 66] },
      size: "3px"
    }),
    // a symbol layer displayed as a vertical semi-transparent wall
    new PathSymbol3DLayer({
      profile: "quad",
      material: { color: [245, 203, 66, 0.3] },
      width: 0,
      height: 2000,
      join: "miter",
      cap: "butt",
      anchor: "top",
      profileRotation: "heading"
    })
  ]
});
The elevation profile can also show a ground profile. In this scenario this works really well, because we’re not only interested in seeing the absolute height of the input line (the paragliding track), but also the height of this line relative to the ground.
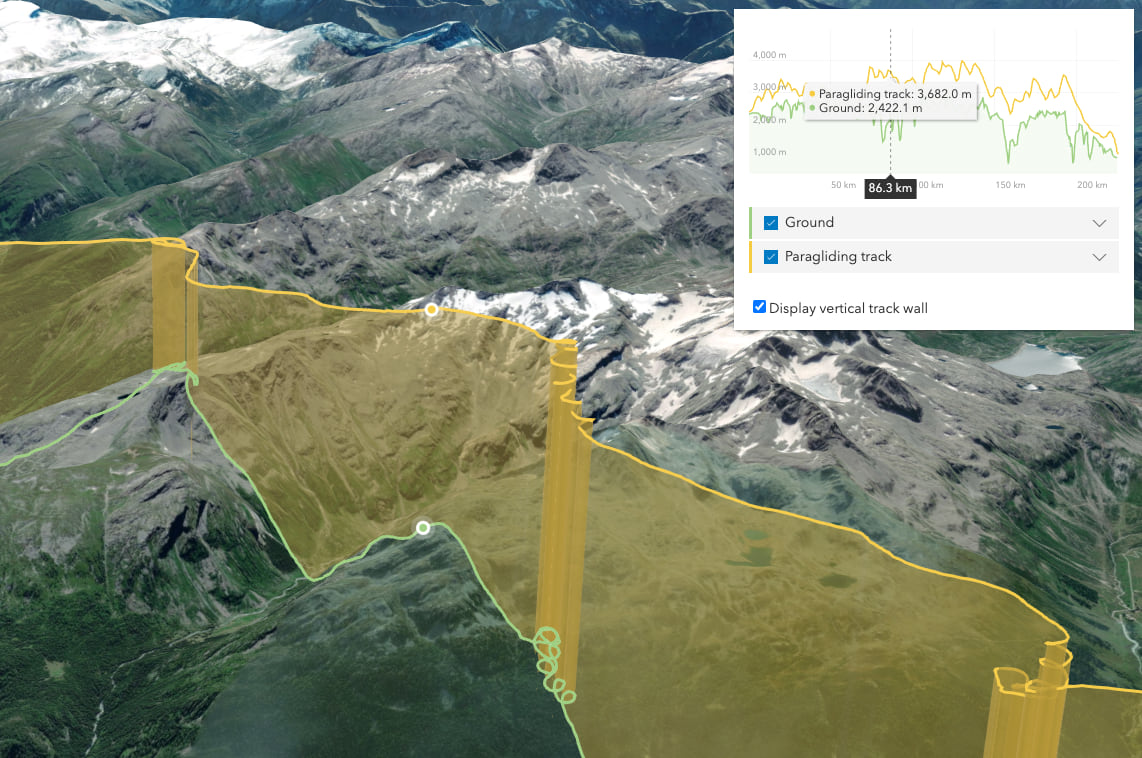
Try it out for yourself in the live application.
Adding photos to your map
Now besides the visualization and the information about elevation, sometimes it’s nice to also be able to share pictures on the map. If geotagging is enabled on your camera, then the images already store the locations where they were taken. If you upload the images in a zip file to ArcGIS Online you’ll get a point feature layer with the images as attachments. In case you are interested in the exact workflow, here is a blog post where Paul explains how to do this: From photos to features: Publishing photos with locations in ArcGIS Online. By default the popup will show these images as attachments. For our use case this is not ideal because we want to click on a point and see the image directly. With a little bit of Arcade magic, we can display the full images in the popup:
const popupExpression = `
  var urlPart1 = "https://services2.arcgis.com/cFEFS0EWrhfDeVw9/arcgis/rest/services/Hiking_POI/FeatureServer/0/"
  var objectID = $feature.OBJECTID
  var urlPart2 = "/attachments/"
  var attachID = 0;
  if (Count(Attachments($feature)) > 0) {
    attachID = (First(Attachments($feature))).id
  }
  return urlPart1 + objectID + urlPart2 + attachID
`;

const picturesLayer = new FeatureLayer({
  url: "https://services2.arcgis.com/cFEFS0EWrhfDeVw9/arcgis/rest/services/Hiking_POI/FeatureServer",
  popupTemplate: {
    expressionInfos: [{
      name: "image",
      expression: popupExpression
    }],
    content: "<img src='{expression/image}'%'>"
  }
});
Here’s an example where I used this workflow to display the images from a hike I went on earlier this year:
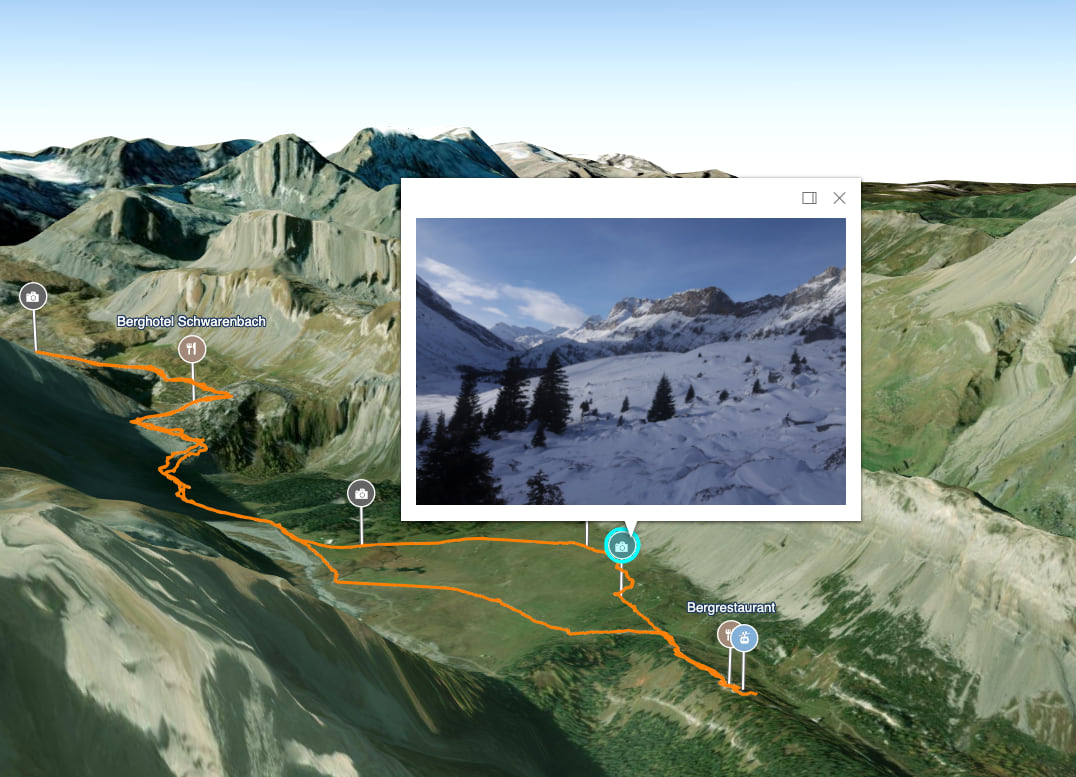
The code for all these apps can be found on Github:
- Bicycle gpx data visualization – Live app – code
- Paragliding gpx data visualization – Live app – code
- Hiking tcx data visualization and display of attachment images in a popup – Live app – code
Before wrapping up this article, here’s one more useful resource: Load gpx in 3D is an app where you can drag and drop your gpx file to visualize it in a web scene. It was built by my colleagues Sascha Brunner and Jesse van den Kieboom and you can find the code on Github.
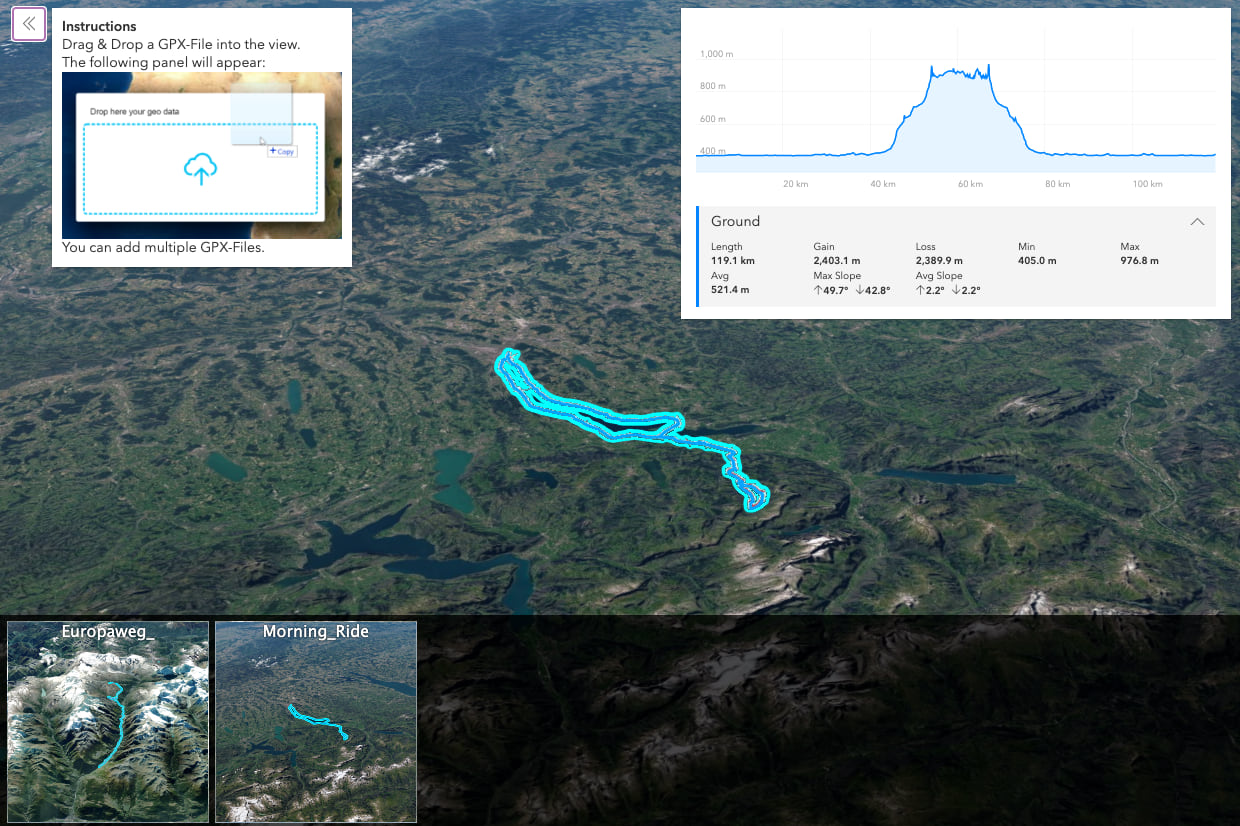
So… enjoy your outdoors adventures and if you do end up mapping them, we’d love to see what you’ve been up to!
Raluca and the ArcGIS API for JavaScript team
Credits: thanks to Sina Sadeqi on Unsplash for the awesome banner image.

Article Discussion: