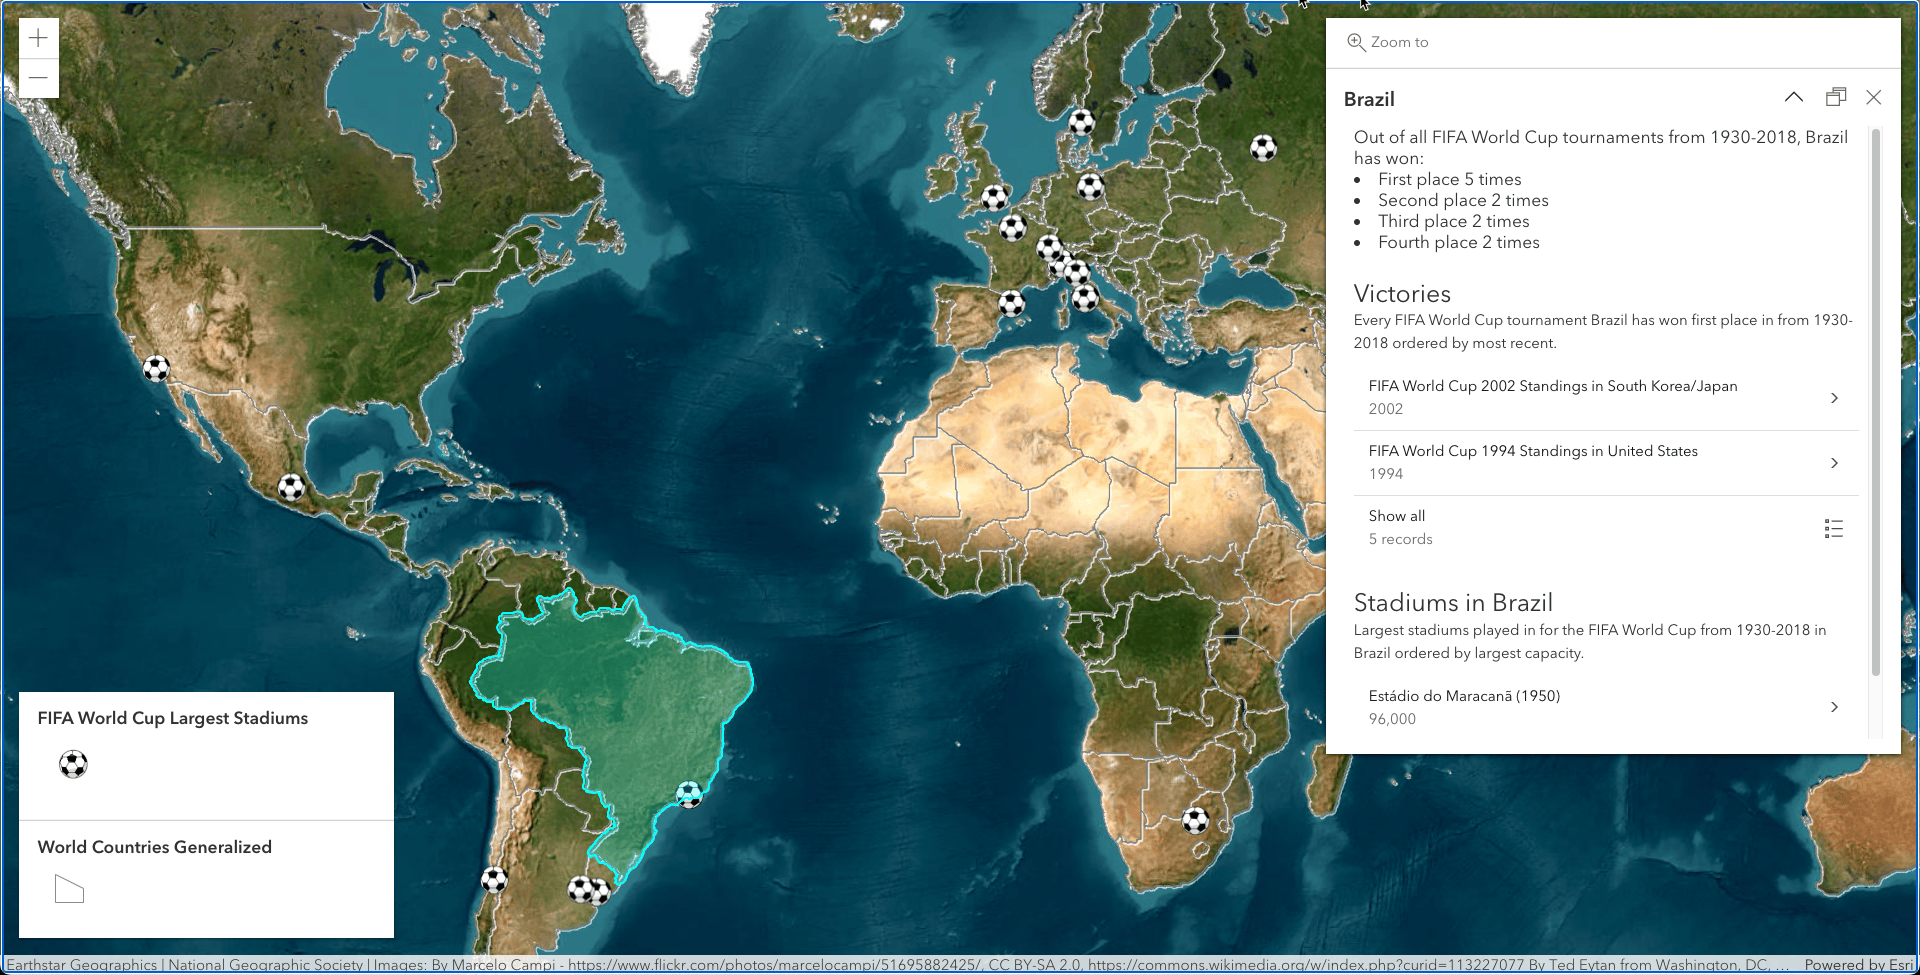
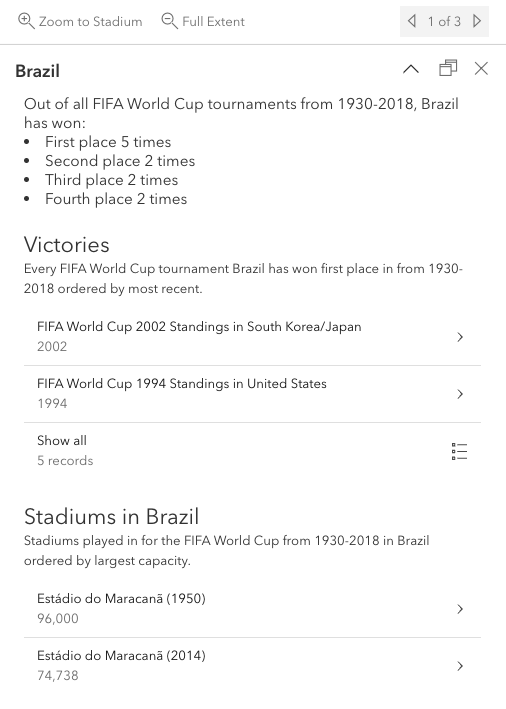
Relationships are essential in life whether they are personal with family or friends, work related with colleagues, etc. The same goes for relationships within your geographical data. Version 4.25 of the ArcGIS API for JavaScript (ArcGIS JS API) introduced a way to browse your data’s relationships through a feature’s pop-up. This is done through the RelationshipContent element. The FIFA World Cup Qatar 2022 tournament has begun, so let’s explore an application that browses FIFA World Cup relationships!

What are relationships within ArcGIS?
Let’s begin by defining what relationships are within the ArcGIS System. Relationships provide a way to associate features and records with one another without being in the same layer or table while helping to enforce data integrity. The primary motivation for modelling geographic (or any data) with relationships is to support cardinality. A relationship’s cardinality specifies the number of objects in the origin class that can relate to a number of objects in the destination class. For example, a country may have one, none, or many past or present FIFA stadiums.
Relationships can be created between different data sources, such as:
- A layer can relate to another layer. For example, a stadium can relate to the country it resides in.
- A layer can relate to a non-spatial table. For example, a country can relate to its World Cup statistics.
- A non-spatial table can relate to another non-spatial table. For example, information on a soccer player can relate to their statistics and ranking.
To learn more about relationships and why they are important, see the ArcGIS Pro documentation.
Creating relationships
To browse related records in web applications, relationships need to be created prior to publishing your data using the Create Relationship Class tool in ArcGIS Pro.
For the World Cup app, I used the ArcGIS Living Atlas countries* layer and created:
- A feature layer that contains the largest (highest capacity) stadiums for each year.
- A table with statistics of the FIFA World Cup tournaments from 1930-2018.
Below is a table showing the details of the relationships created using the Create Relationship Class tool in ArcGIS Pro between those layers/table:

In this blog, we will focus on how to configure the pop-up to display the second relationship from the table above: the Countries layer and the World Cup Winners 1930-2018 table.
After creating the relationships in ArcGIS Pro, confirm all layers/tables participating in the relationship are in the map and publish everything to ArcGIS Online. Note, viewing related records within pop-ups is only supported for hosted layers starting at version 4.25.
* It must be noted that this demonstration only shows current nations. Former countries like Yugoslavia which came fourth in 1930 and 1962 are not shown.
Related Records and the ArcGIS JS API
Once the data is published, the app can be configured to display the related information with the new PopupTemplate content type, RelationshipContent. To display information from the World Cup Winner 1930-2018 table data within the Countries layer’s pop-up, relationship content needs to be added to the content property on the countries layer pop-up template.
Add Related Layers/Tables to the Map
Prior to adding the relationship content, the layers and tables participating in the relationship must be added to the map. If the related layers/tables are missing, an error message will appear in the UI of the pop-up:

The code below shows how to add the countries layer and the World Cup Winner table with a specific field list configured in its pop-up:
// Create the world countries layer and add a renderer.
const countriesLayer = new FeatureLayer({
  url: "https://services.arcgis.com/V6ZHFr6zdgNZuVG0/arcgis/rest/services/FIFA_World_Cup/FeatureServer/1",
  title: "World Countries Generalized",
  // ... other layer properties
});
// Add the countries layer to the map.
map.layers.add(countriesLayer);
// Create the non-spatial table containing FIFA World Cup standings and stats.
const winnersTable = new FeatureLayer({
  url: "https://services.arcgis.com/V6ZHFr6zdgNZuVG0/arcgis/rest/services/FIFA_World_Cup/FeatureServer/2",
  title: "Country Statistics",
  popupTemplate: {
    title: "FIFA World Cup {Year} Standings in {Host}",
    outFields: ["*"],
    // Add the fields to the FieldInfos
    fieldInfos: [
      {
        fieldName: "First"
      },
      {
        fieldName: "Second"
      },
      {
        fieldName: "Third"
      },
      {
        fieldName: "Fourth"
      },
      {
        fieldName: "TopScorer",
        label: "Top scorers and number of goals"
      },
      {
        fieldName: "BestPlayerAward",
        label: "Best player award"
      }
    ],
    content: [
      // Add FieldsContent via autocasting
      {
        type: "fields"
      }
    ]
  }
});
// Load the non-spatial table and add it to the map's tables.
winnersTable.load().then(() => {
  map.tables.add(winnersTable);
});
Add Relationship Content
Once the layers are added and the statistics table pop-up template is configured, the relationship content can be created with the required properties:
- relationshipId: The relationship’s numeric value. To find this value, see the layer resource relationships section on the feature service:

- title: A title specifying the related information we are showing. In this case, we will be displaying the number of times a country has won first place out of all the past tournaments so the title will be “Victories”.
- description: A short overview of the story the related information will be telling.
- displayCount: The number of related records displayed in the list. The minimum is 0 and maximum is 10.
- orderByFields: This property allows you to specify a field value to order the list of related records by. In this example, we will order the list of tournaments descending by year.
The code below creates a new RelationshipContent object using autocasting and adds the object to the pop-up template content:
countriesLayer.popupTemplate.content = [
  {
    type: "relationship",
    // Relationship ID on the feature service is 1
    relationshipId: 1,
    title: "Victories",
    description:
      "Every FIFA World Cup tournament {COUNTRY} has won first place
       in from 1930-2018 ordered by most recent.",
    displayCount: 2,
    // Orders the related records by the year the tournament was held
    // by most recent to oldest
    orderByFields: [
      {
        field: "YEAR",
        order: "desc"
      }
    ]
  }
];
Once added to the pop-up template, the related records of the selected feature can be explored within the pop-up! The images below show Brazil’s pop-up and what the pop-up looks like when selecting a related feature. In this case, Brazil’s victory in the 2002 world cup hosted in South Korea and Japan was selected from the list of related records:

Note that the pop-up template that was configured for the related table displays within countries pop-up. It’s that simple to add related records within pop-ups using the ArcGIS JS API!
But wait.. there is more content!
Multiple relationships and/or different types of content can be added to the pop-up template depending on the story that’s being told through data exploration. In the completed FIFA World Cup app, the countries pop-up template is configured with custom content that queries the related table for statistics and both relationships in the table above.

Best practices
- The related layer or table must be added to the map to be able to configure relationship content. If the one of the layers/tables that is participating in the relationship is not added to the map, an error will show in the UI.
- Due to the relationship content adding a large UI to the pop-up, to improve legibility it may be more convenient to dock the pop-up to one side of the browser.
What’s Next?
Viewing related records is just the beginning of what is to come. In future releases of the ArcGIS API for JavaScript, we plan to support:
- Editing related records with the Editor widget and within the pop-up
- Viewing related records for ArcGIS Enterprise hosted and non-hosted services
- Viewing related records within the FeatureTable
- Actions that navigate you to related features
Conclusion
Supporting related records in feature pop-ups is quick and easy with the ArcGIS JS API and opens up so many possibilities for data exploration in your applications.
If you’d like to play around with the code shown in this blog, or would like to browse historic FIFA World Cup statistics, check out the live application and source code. If soccer(futbol) is not your thing, don’t worry. Take a look at this sample that uses relationships to link Californian administrative areas to wildfires.


Article Discussion: