This is the biggest release we’ve had in a while! Version 4.30 is packed full of enhancements that includes highly requested capabilities in addition to more subtle “quality of life” improvements for both user and developer experiences. Read on to learn about many of the release highlights!
Build your web apps using components
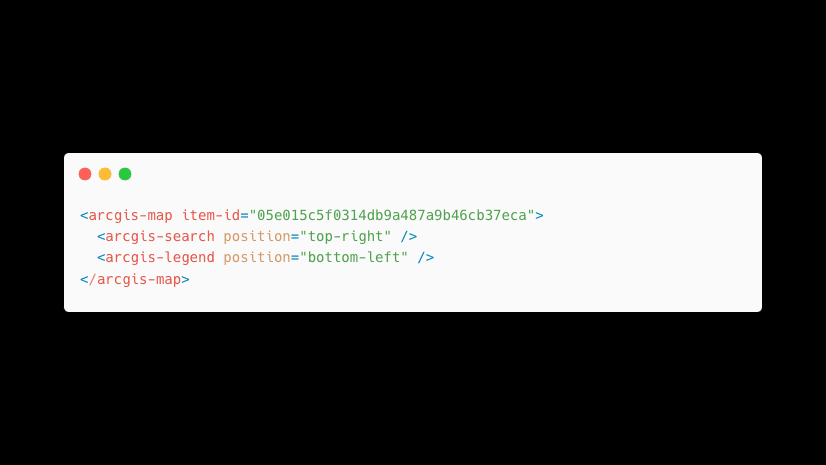
Map and coding components are out of beta and are the recommended approach for constructing the user experience in your app.
Last October, we introduced our first beta release of pre-built UI components for building web apps with minimal code, consisting of map components, coding components, and—as of February—charts components. Components are standards-based web components that extend the core API of the JavaScript Maps SDK into reusable custom HTML elements, such as <arcgis-map></arcgis-map>.
Get started learning how to build apps with components using the following new and updated resources.
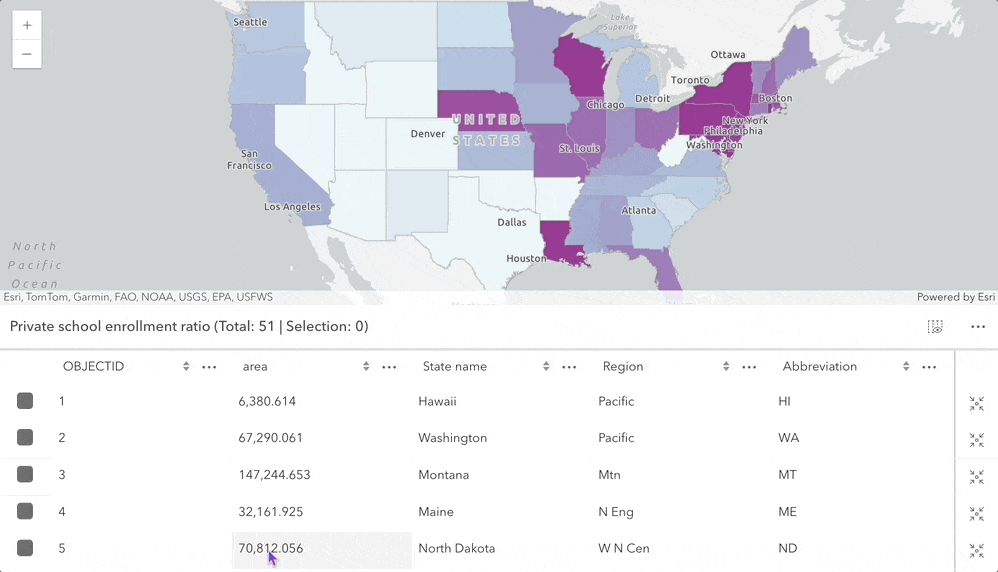
Related records and custom columns in Feature Table
This was a big release for feature table, with the introduction of related records support, custom columns, better selection and highlight interaction, faster performance, and an improved responsive design.
Related records: Viewing and editing (of editable) related records is enabled when setting relatedRecordsEnabled to true.
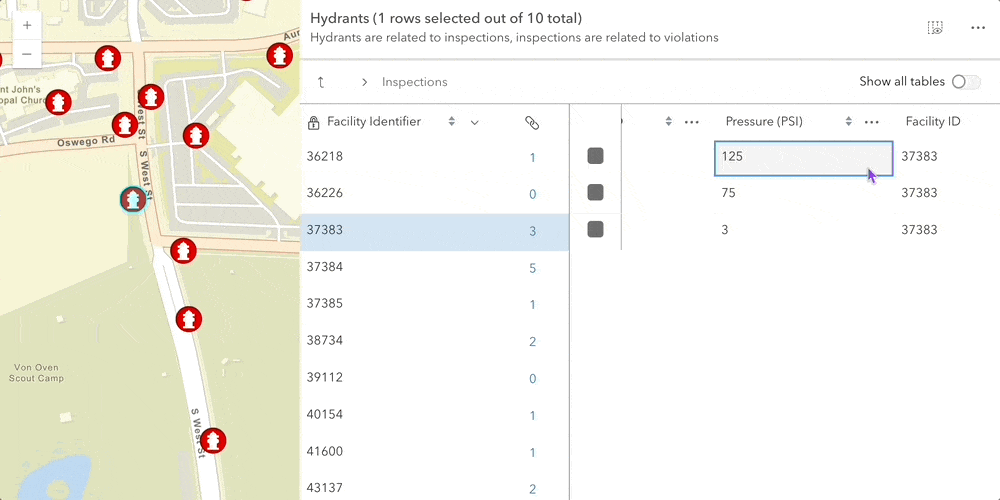
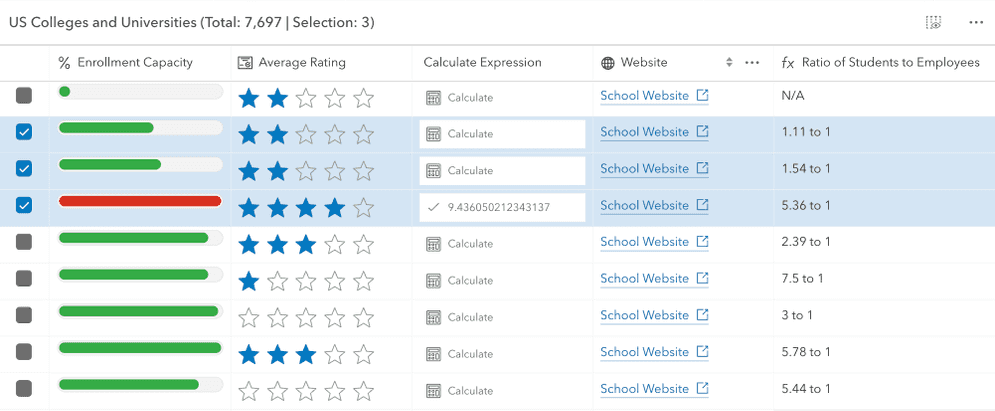
Custom columns: You can now fully customize the contents of columns. Columns can be based on an attribute in the layer or can be independent of layer attributes and created as a virtual custom column containing the content you want to include in the table. For example, you can integrate custom components, use Arcade to calculate a value, and/or format content based on your specific use case. Custom columns are achieved by defining a formatFunction for the column, that returns a string, number, or HTML element (e.g. a Calcite component).
You can also configure the displayed title and description in the table header.
Selection and highlighting: this release builds on the concept of selection, feature highlighting, and the coordination between the table and the map.
Faster performance: Columns are lazy loaded, meaning that if you are working with layers with many attributes, columns are loaded as the table is scrolled horizontally in order to maintain application performance.
Responsive design: Feature Table was updated internally to use Calcite components, enabling better accessibility and responsive design. New properties provide more control over column sizing and responsiveness including autoWidth, flexGrow, and width.
Interactive 3D viewshed analysis
Evaluate visible areas from a real estate property or visibility of important landmarks using the new interactive viewshed analysis tool. Interactively or programmatically place an observer and adjust the field of view angles to create client-side view corridors and domes.
Vector Tile Layer labels oriented in 3D Scene
Labels and symbols of a vector tile layer are rotated according to the camera heading in scene view, improving symbol recognition and text readability. Labels and symbols for linear objects (e.g. streets, rivers) are flipped depending on the camera heading, and others are rotated to keep them upright in the view when the camera heading changes.
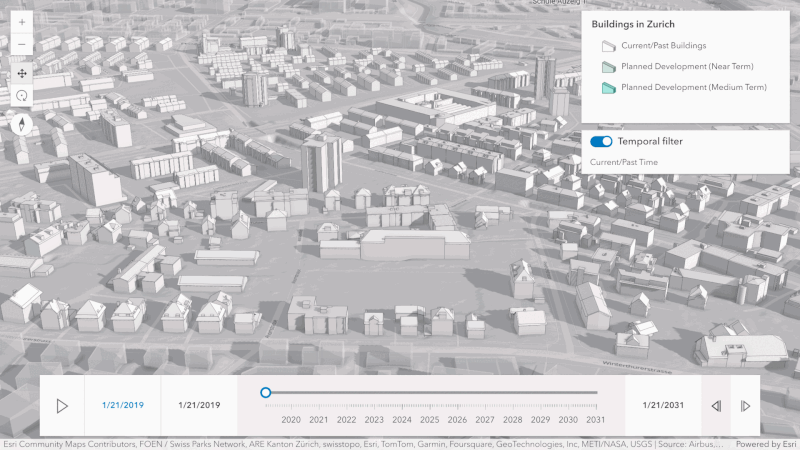
Time support in 3D
Visualize progress over time using the time slider in a scene view. 3D object, point and voxel scene layers are now time aware and are filtered according to the view.timeExtent.
Working with 3D models
3D model upload out of beta: Uploading and sharing 3D content with scene layer editing was first introduced under beta in 4.27. Since then, we improved performance, support for local and global projections and finalized the Mesh geometry APIs. The capability to upload 3D models from various formats and place them using the Editor widget is now out of beta in the JavaScript Maps SDK and Scene Viewer.
Export 3D meshes to glTF. You can query mesh geometries from a scene layer to export 3D models to glTF, then use the exported mesh in professional 3D modeling software. This enables collaborative workflows that involve advanced modeling, particularly in planning and real estate industries.
For more information, check out the 3D Object Layer: A Comprehensive Overview blog.
Performance improvements
Faster and smoother layer list: In version 4.30, rendering the layer list is up to 2.5x faster compared to version 4.29. We are also seeing higher frames per second (fps) in apps using layer list with many layers. In our test app containing 165 layers , the frame rates when panning and zooming have increased from around 24fps in v4.29 to around 45fps in v4.30 in a dedicated test environment.

Enhanced FeatureLayer performance: We’ve optimized the animation process between locations in a map view. Now, only the feature tiles at the destination viewpoint of the animation are fetched, significantly reducing the number of requests made. For instance, when navigating between bookmarks in California and Oregon, version 4.30 makes over 50% fewer requests compared to version 4.29. This enhancement boosts efficiency and improves the overall user experience.
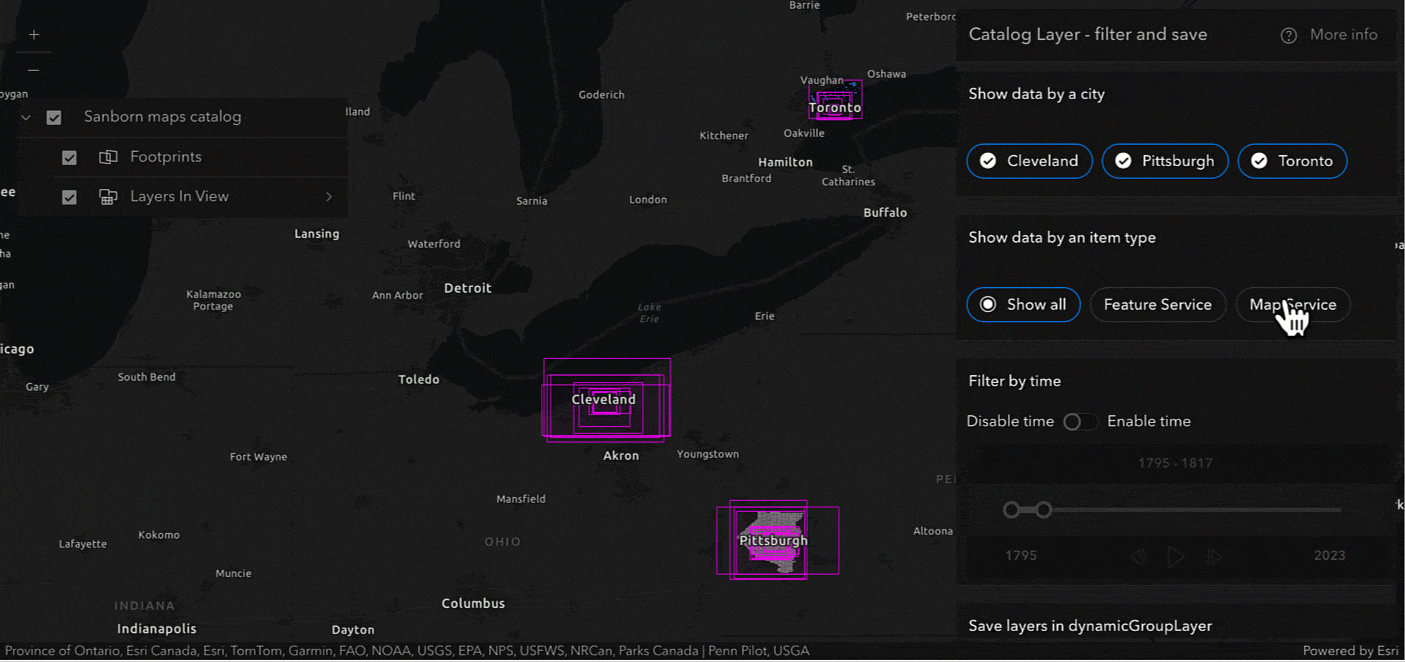
Catalog Layers
The new Catalog Layer lets you visualize, search, and filter a collection of layers in 2D and 3D. At first glance it looks like a group layer, but it’s backed by a feature service where each polygon feature on the map represents the footprint of a layer of the catalog. Additionally, it’s possible to preview the layer’s content directly from the catalog. Since the content of the catalog is backed by a feature service, the catalog can be updated regularly with new layers, maintaining a dynamic and up to date collection of layers. Using the footprint metadata, you can apply a filter based on anything that can be applied to a feature layer – including attributes, geometry, and/or time.
Catalog layers are best used in situations in which the contents of a map or scene contain large collections of layers, when your organization(s) produces new data rapidly, or to share data organized thematically.
The new Catalog Layer List provides a way to display and interact with Catalog Layers, and integrates with Layer List.
Full motion georeferenced video support (beta)
The new Video Layer displays prerecorded or live-streamed video feeds from a Video Server. Developers using video layer can display a video georeferenced on a map and control the playback with the new Video Player. The video player provides control operations, time and duration display, customizable graphics colors, and more. Both are in beta for this release.
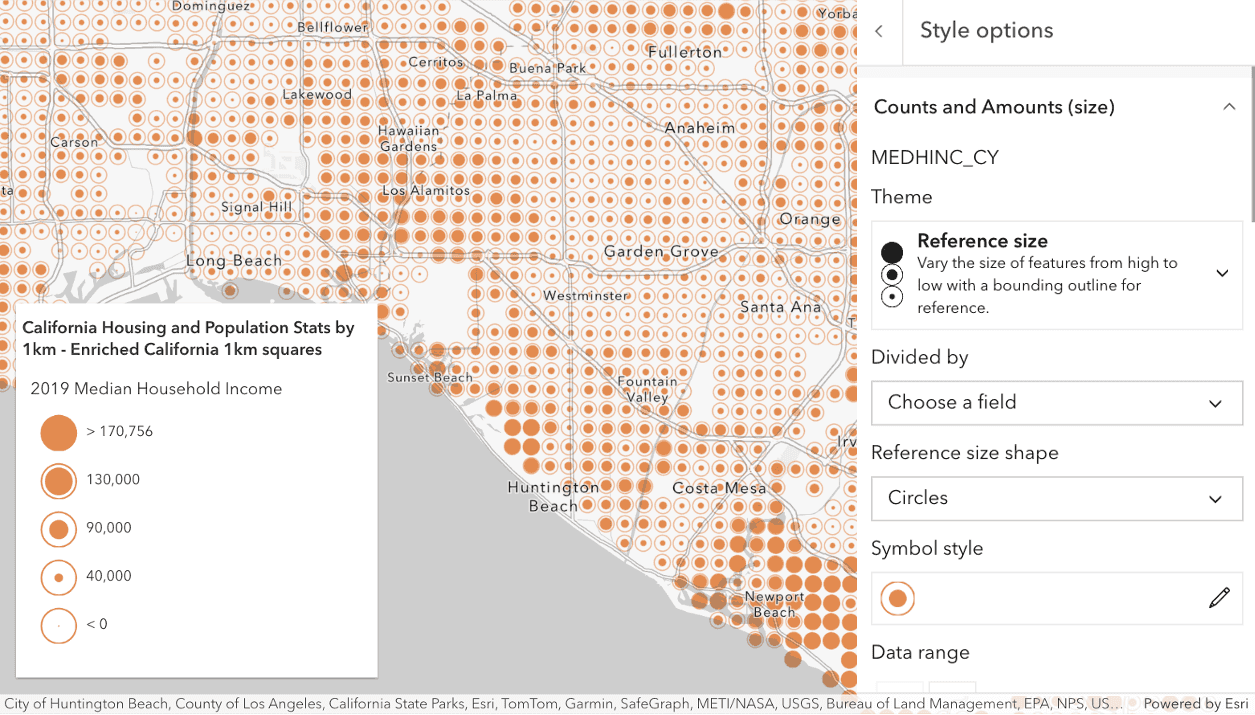
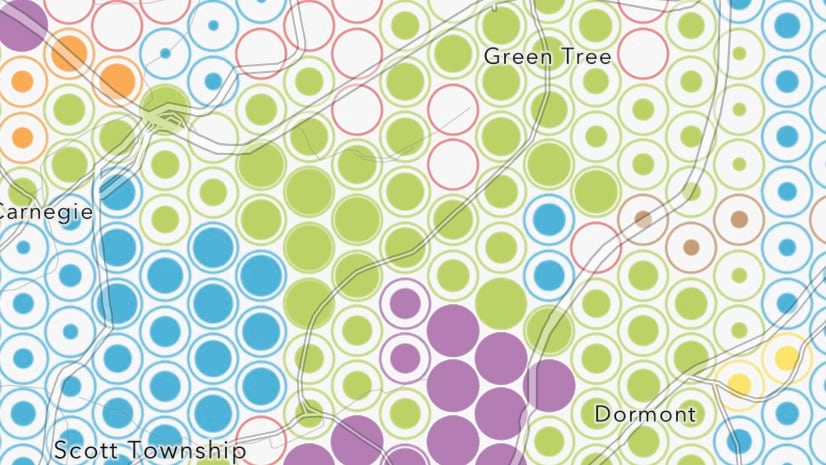
Reference size theme
We added a new reference-size theme in smart mapping that displays dots sized proportionally based on a data value in relation to a reference size. It can visualize density effectively, especially for gridded datasets where geometries don’t overlap. You can use reference size in combination with color to show types or density of multiple variables.
You can create a reference size visualization in Map Viewer, save it to a web map, and then load it into your application; or generate it directly in code using the smart mapping size renderer creator method.
Labeling alignment and popups
Additional polyline label placement options: Labels along polylines can be aligned above or below the line. Additional values will continue to be added at future releases.
Open popup on label click: Users can now open a popup by clicking on a feature’s label. The popup will open relative to where the feature or label is clicked.
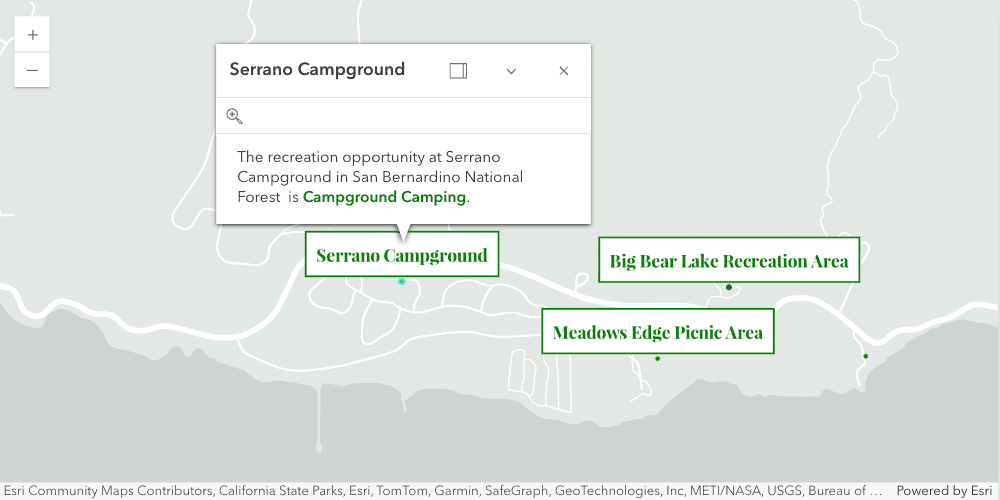
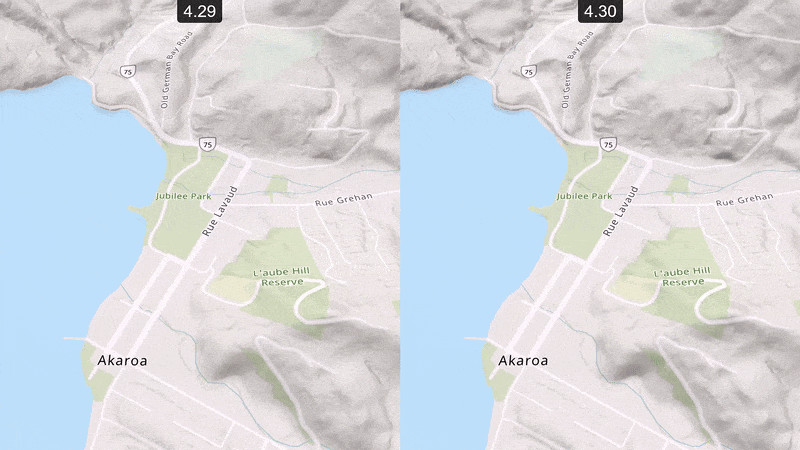
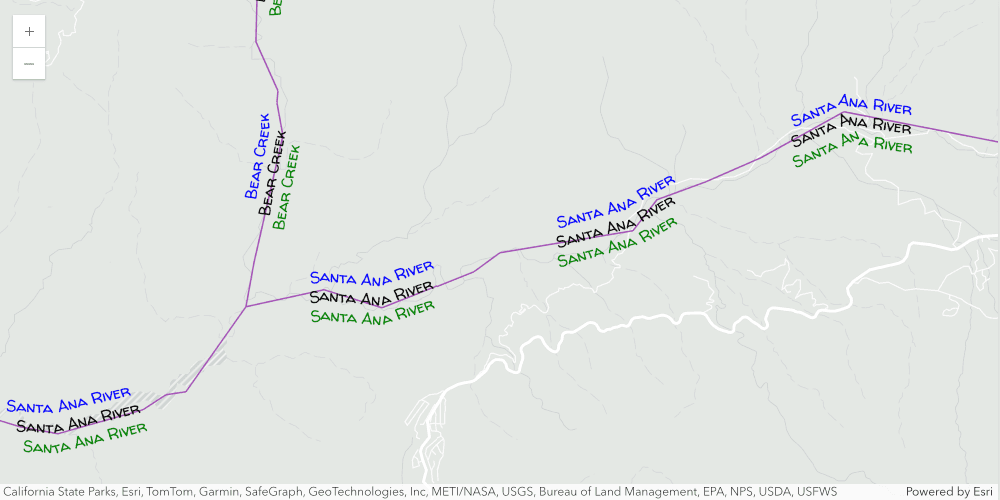
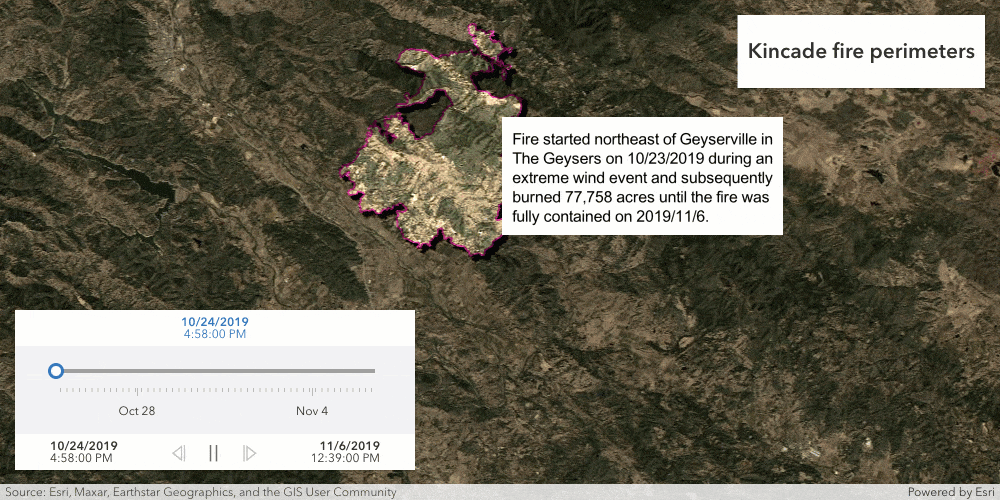
Layer visibility based on time extent
You can control layer visibility based on a configured time extent for all layer types using the new visibilityTimeExtent property. This is particularly useful when you are working with layers that don’t contain time information like tiled layers, integrated meshes, or graphics layers.
For example, by establishing a fixed time extent for imagery from particular time periods, users gain temporal context, enabling targeted analysis centered on specific time frames or events. In the example below, multiple graphic layers with a visibility time extent allows the user to see graphics displaying textual information about the wildfire perimeter as it changes based on the time slider handle positions.
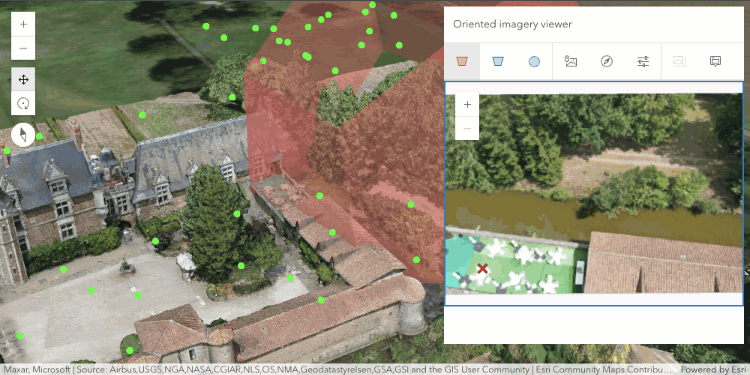
Oriented imagery in 3D
Oriented Imagery Layers can be published with a z-value, allowing you to visualize and interact with them in a 3D scene. As the image view point is adjusted within the oriented imagery viewer, the 3D geometry of the image coverage is visualized on the map.
Navigation animation
Significant improvements have been made to the animation behavior of MapView.goTo(). A new animation style creates an arc-like motion that provides more geographic context between two locations. In addition, rather than using a fixed duration for the animation, by default the new experience dynamically calculates the ideal duration for the navigation animation based on the distance between the origin and destination. The duration and other animation settings can be overridden by developers.
The new experience is also applicable to Bookmarks and Search, when navigating between locations, and any other workflows that involve transitions between locations.
Note: Animations may not be suitable for everyone, as some animations can cause discomfort for individuals with vestibular motion disorders. To disable 2D MapView navigation animations in the JavaScript Maps SDK, users can set the prefers-reduced-motion option in their device or browser settings. Check out the Accessibility guide to learn more about how you can build accessible applications and support more diverse audiences.
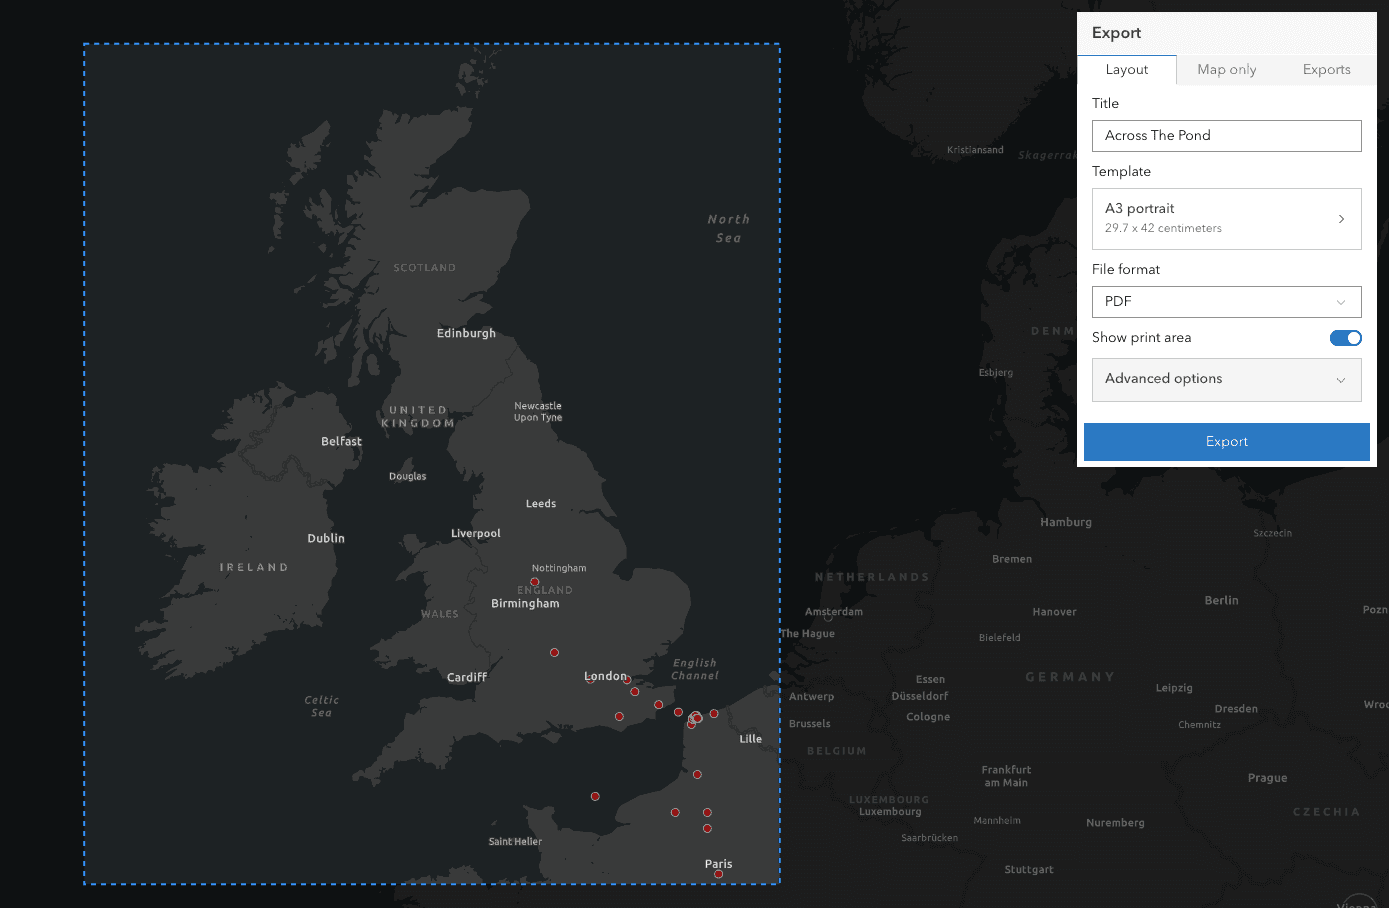
Custom print layouts hosted in Online (beta)
Significant enhancements were made to the Print widget/component, including the ability to work with custom print templates that are hosted in ArcGIS Online. Print also has a new Show print area capability which allows users to preview the boundaries of the print output.
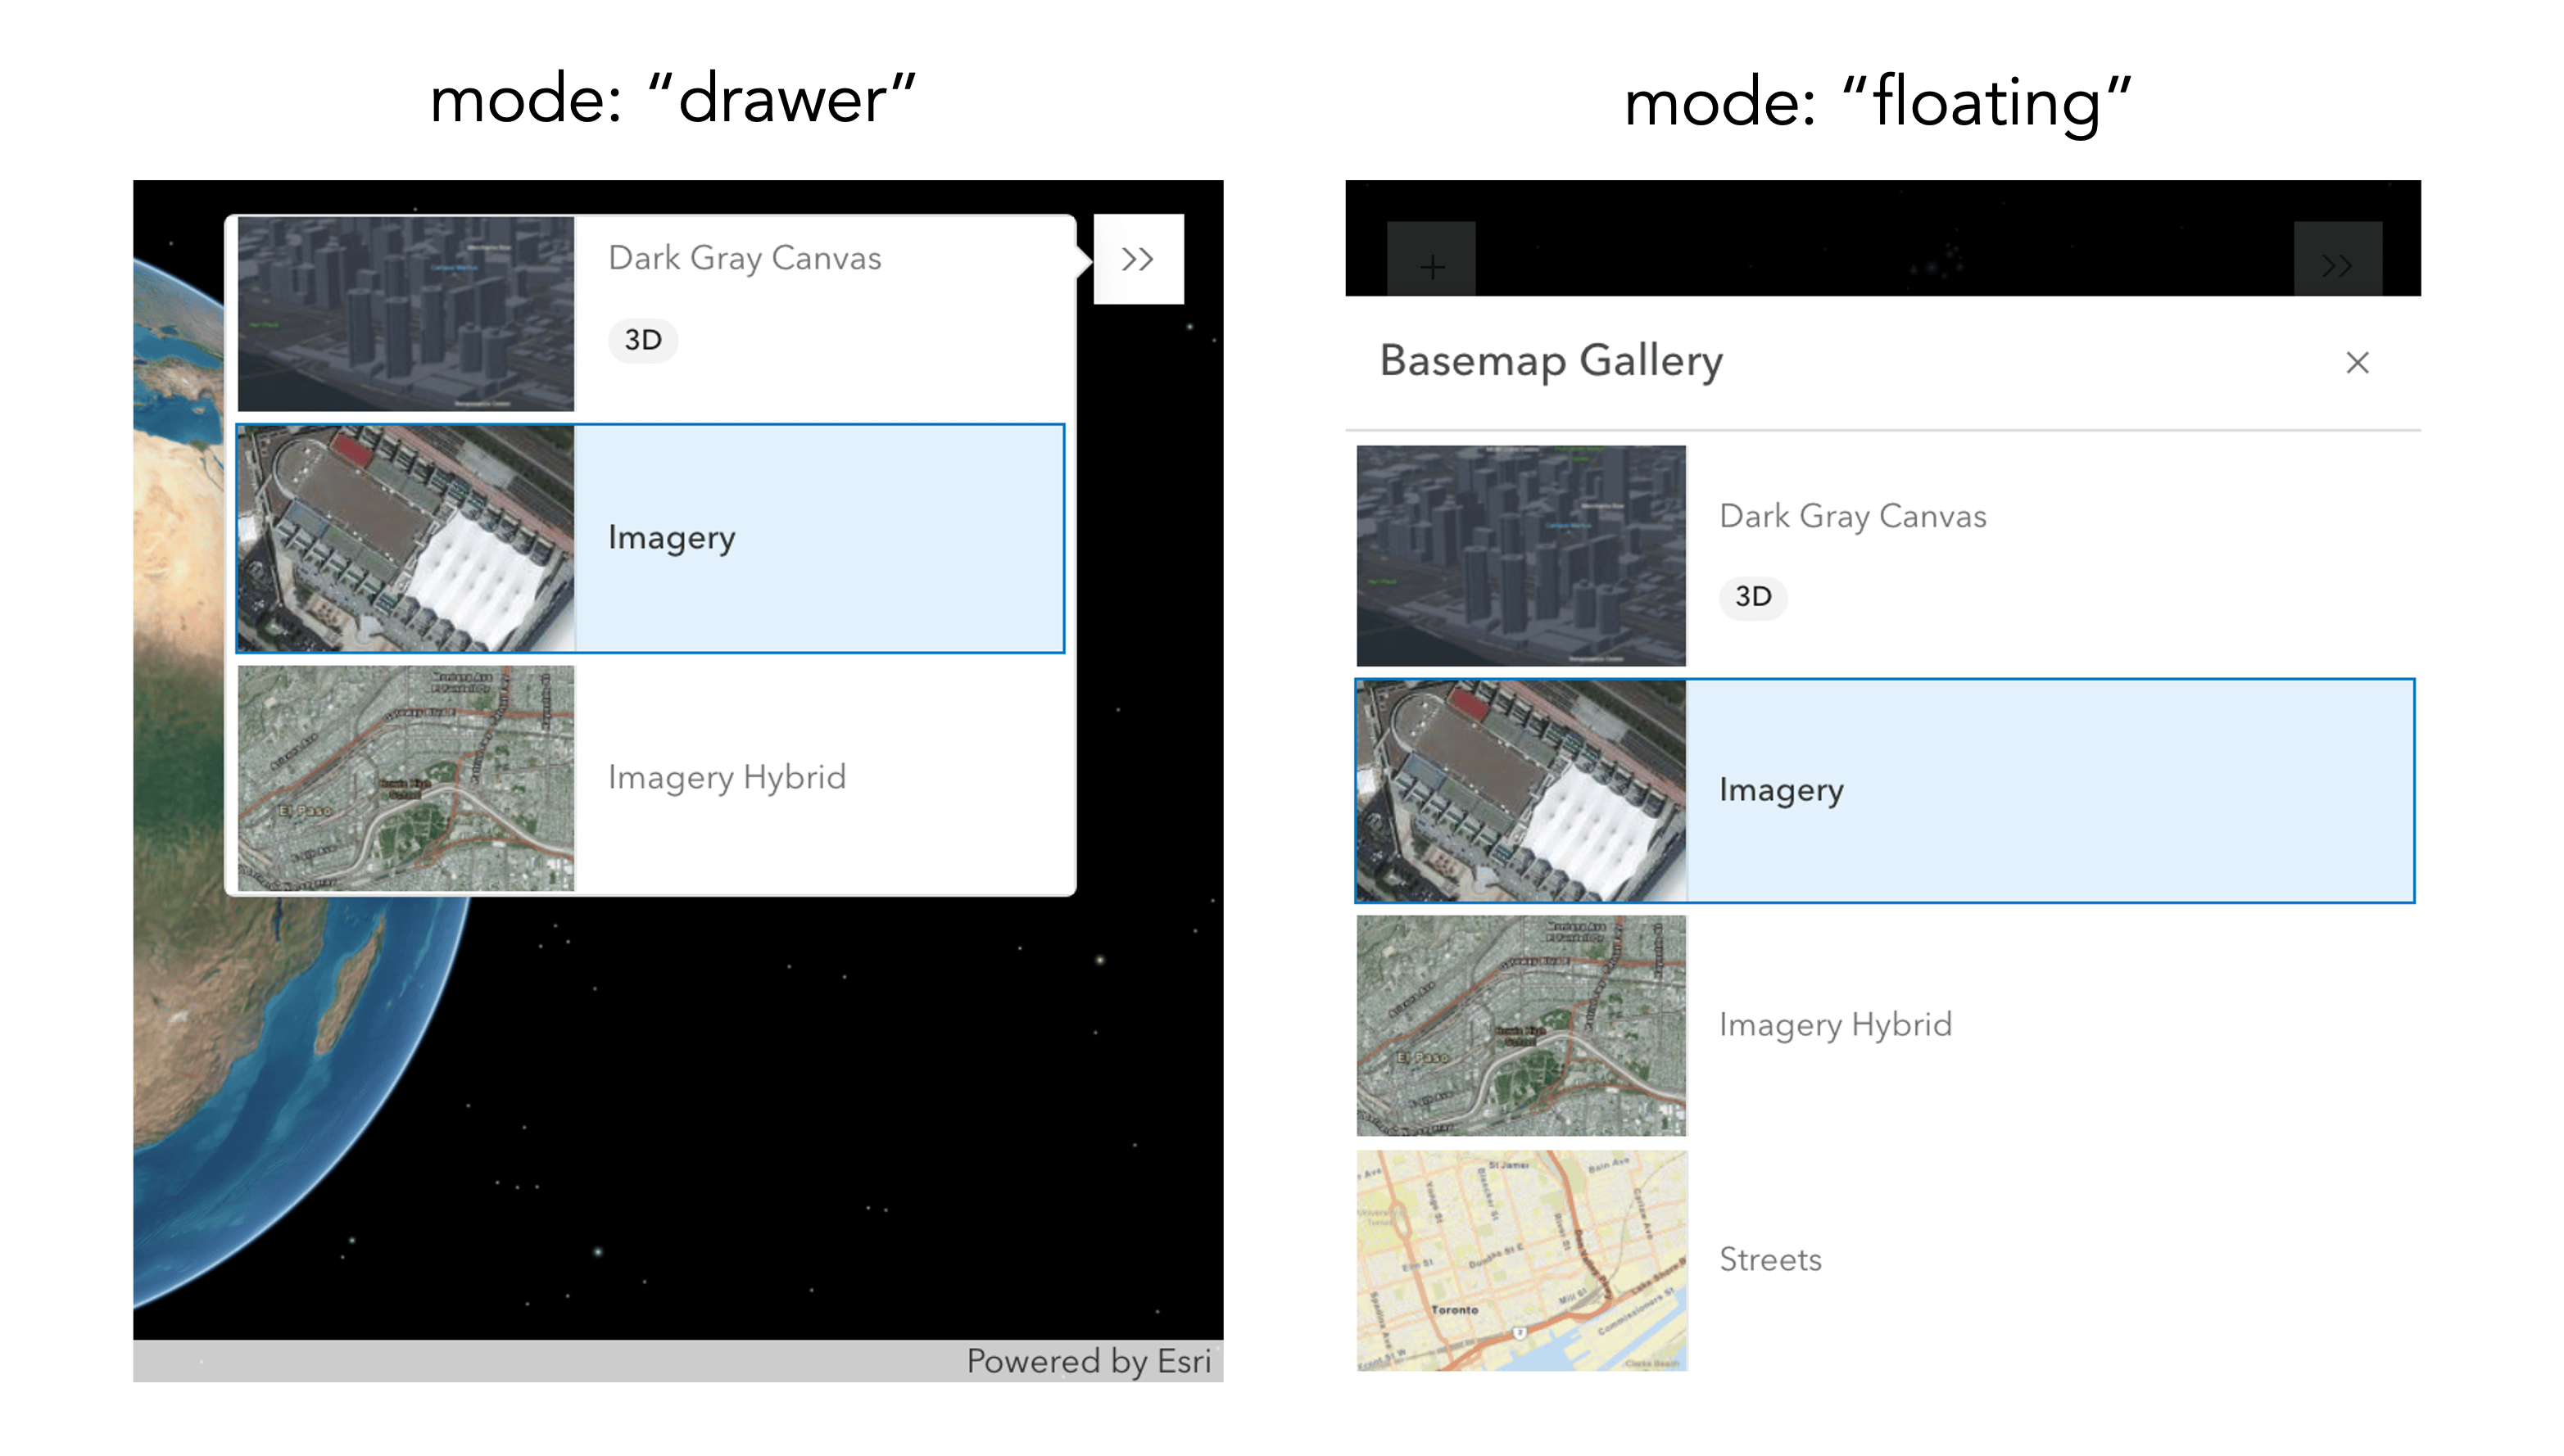
Improved mobile experience for Expand
Expand was updated to use Calcite components internally, providing an improved experience for mobile devices. By default, Expand responsively switches between “floating” and “drawer” layouts based on the browser size. The new placement property gives you control over the placement of the popover when the widget is expanded.
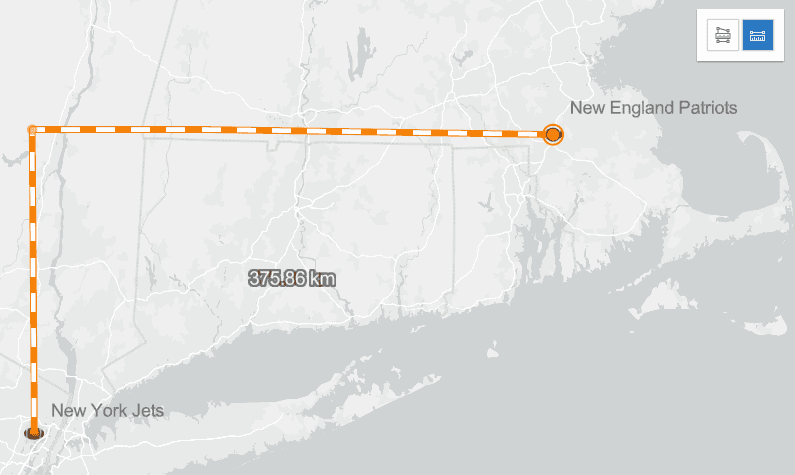
Measurement and snapping
The 2D area and distance measurement now support snapping, which is enabled by default. It can be temporarily disabled by holding the CTRL key. Note that this is already supported in 3D measurement.
Editing updates
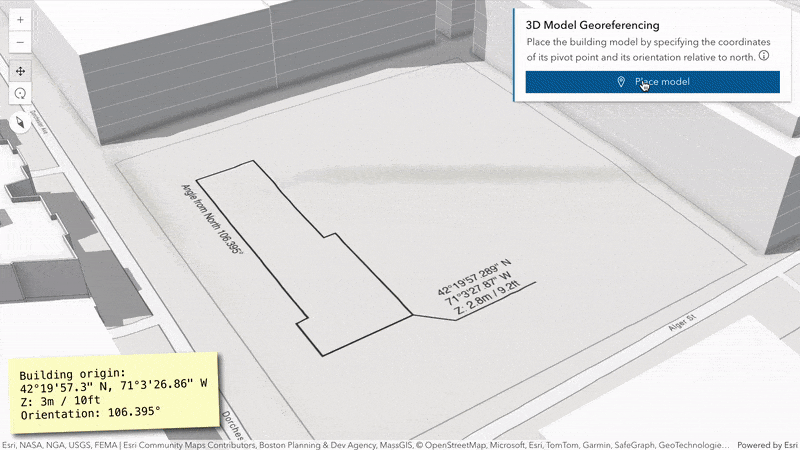
Coordinate inputs and improved tooltips. Edit features accurately by typing or copy-pasting pairs of coordinates in the tooltip. This new type of input is available when creating and updating point geometries or the vertices of lines and polygons. Coordinate input also allows precise georeferencing of buildings when uploading or editing mesh geometries.
Subtype support: Editor and Feature Form now has support for editing feature layers containing subtypes.
Custom text formatting in Feature Form. Feature Form added support for rendering Text Elements, providing the ability to add custom read-only content to the form.
More 2D vector symbols
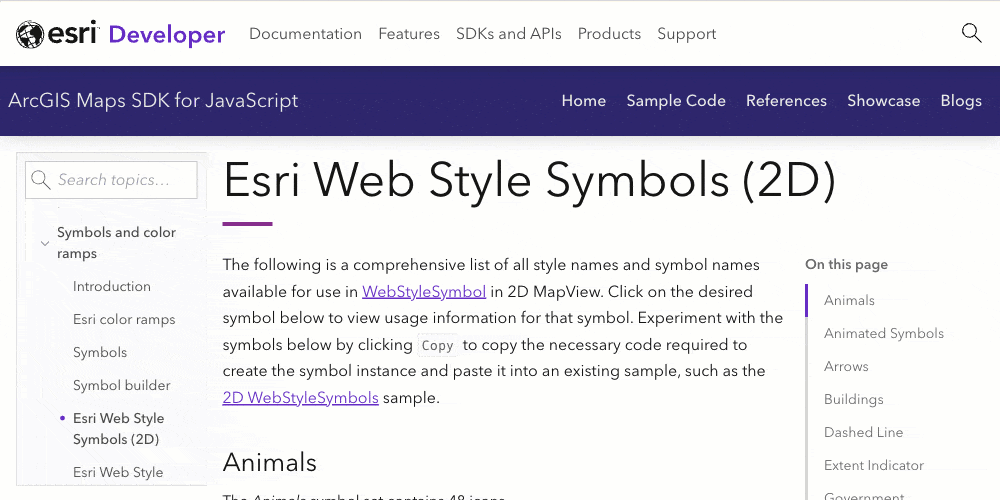
We added more than 3,000 2D vector symbols to the Esri Web Style Symbols (2D) guide. These include symbols that have already been available in ArcGIS Online and ArcGIS Pro’s symbology UI such as symbols for government, landscape, buildings, arrows, etc. You can use any of these symbols in your app by referencing the style name and symbol name of your symbol of choice.
Learn more
This blog is only a subset of the contents of the 4.30 release. It includes a lot more, such as support for definition expressions in the Legend, the ability to define a popup template for route layers, and interactive media layer placement in 3D. To learn more, check out the release notes and the latest samples.
Join our livestream on Monday, July 8th at 9am PT to see our 4.30 release highlights in action and get your questions clarified!
2024 User Conference is happening in a few weeks! We are providing many exciting web development sessions, ranging from fun-favorite fundamentals to brand-new session for faster development with web components. Also join us at Developer Day for an all-day event caters to all developer levels, from exploring low-code solutions to deep diving into GIS app development. We are also waiting for you at the ArcGIS Developer showcase for all questions and fun conversations!


Article Discussion: