Updated November 2022
As one of the new ArcGIS Instant App, Chart Viewer allows you to display your charts alongside your map. App authors can display multiple data-based charts configured in Map Viewer to compliment information in the map. Chart Viewer supports all the chart types in the Map Viewer: bar, line, histogram and scatter plots. Up to three charts can viewed at the same time, along with the map. For example, in this app view a scatterplot comparing monthly housing cost exceeding 30% of monthly income for renters vs homeowners, a bar chart showing the distribution of homeowners with mortgages exceeding 30% of monthly costs and chart comparing renters to owners, all while the map is visible. Just like in the Map Viewer, you can interact with the chart and map together by making selections.
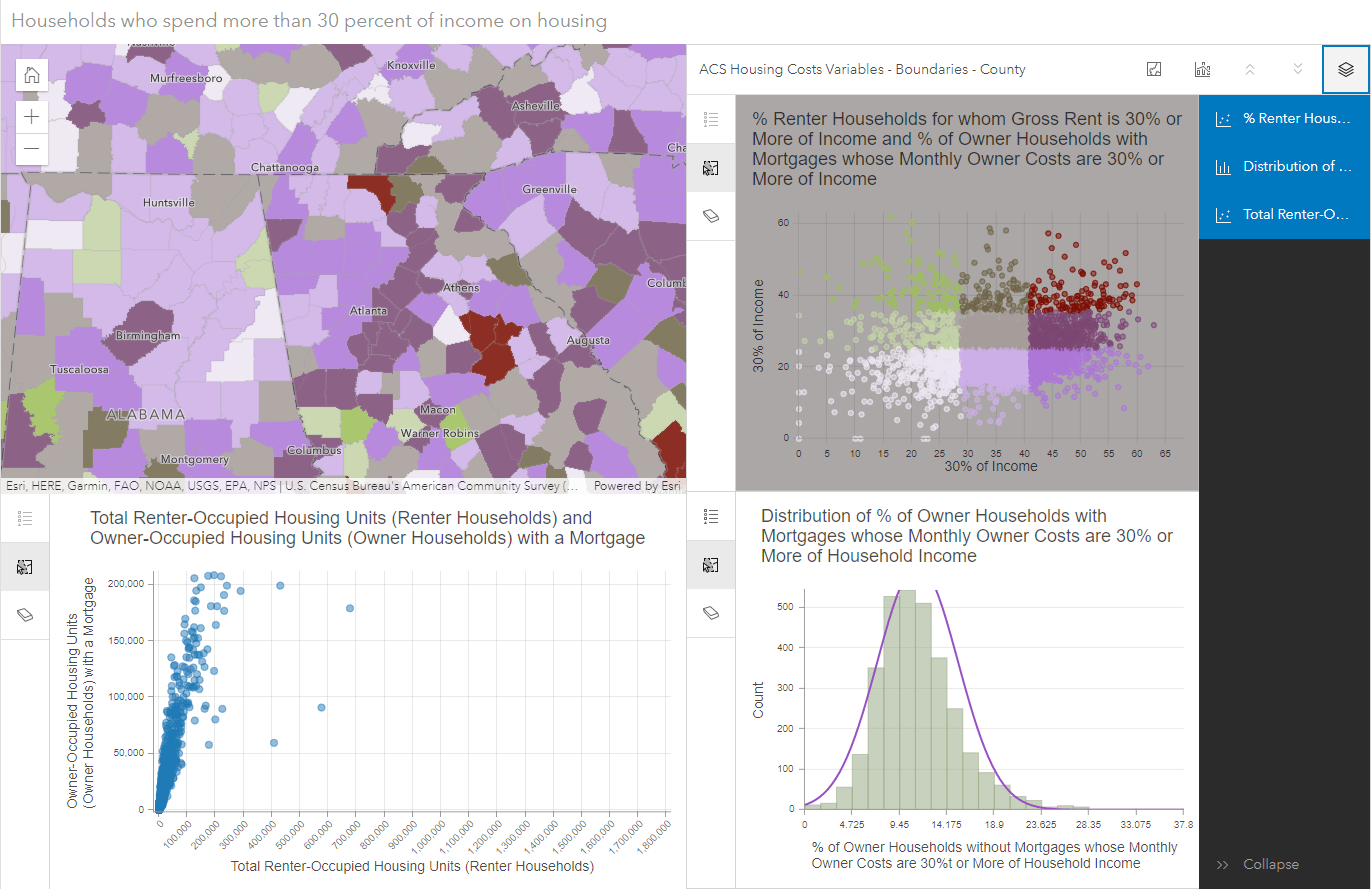
Charts Viewer Configuration
Start by authoring your charts in the Map Viewer. After charts have been created in the web map, the map can be published to the Chart Viewer Instant App. To share apps from the Map Viewer to Instant Apps select Create App > Instant Apps and select the Chart Viewer template.
The following are some highlights of configurable options in the Chart Viewer:
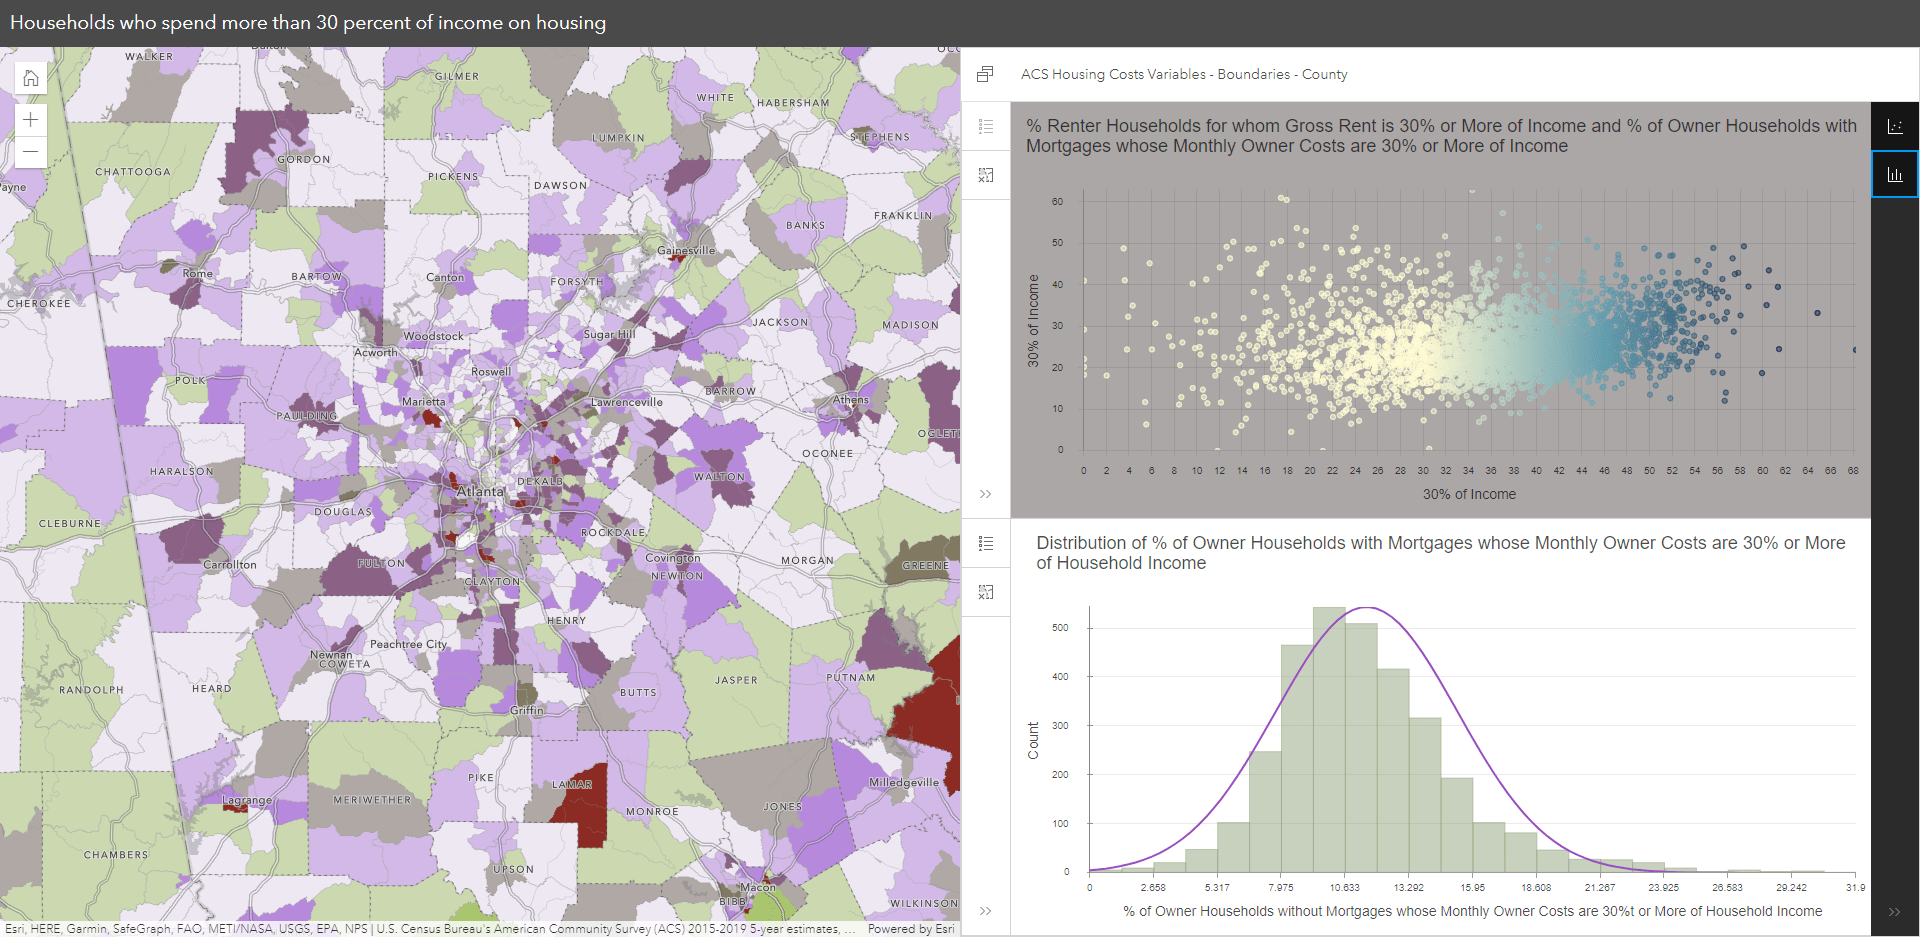
- Layout Options – Choose to display your charts stacked with the map or side by side with the map. Adjust the chart panel size between small, medium, and large. You can also view only a chart(s) or the map at anytime.
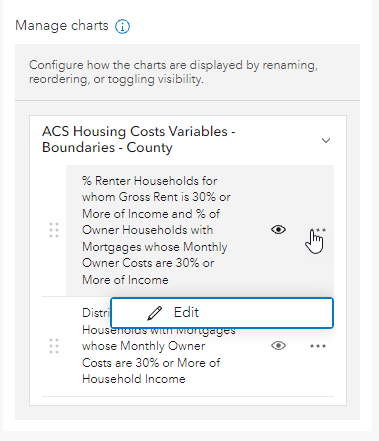
- Configure Charts – Within the manage chart configuration edit the chart information to change the title, drag the charts to change the order and toggle on/off visibility. You can also select a chart legend to be on default.
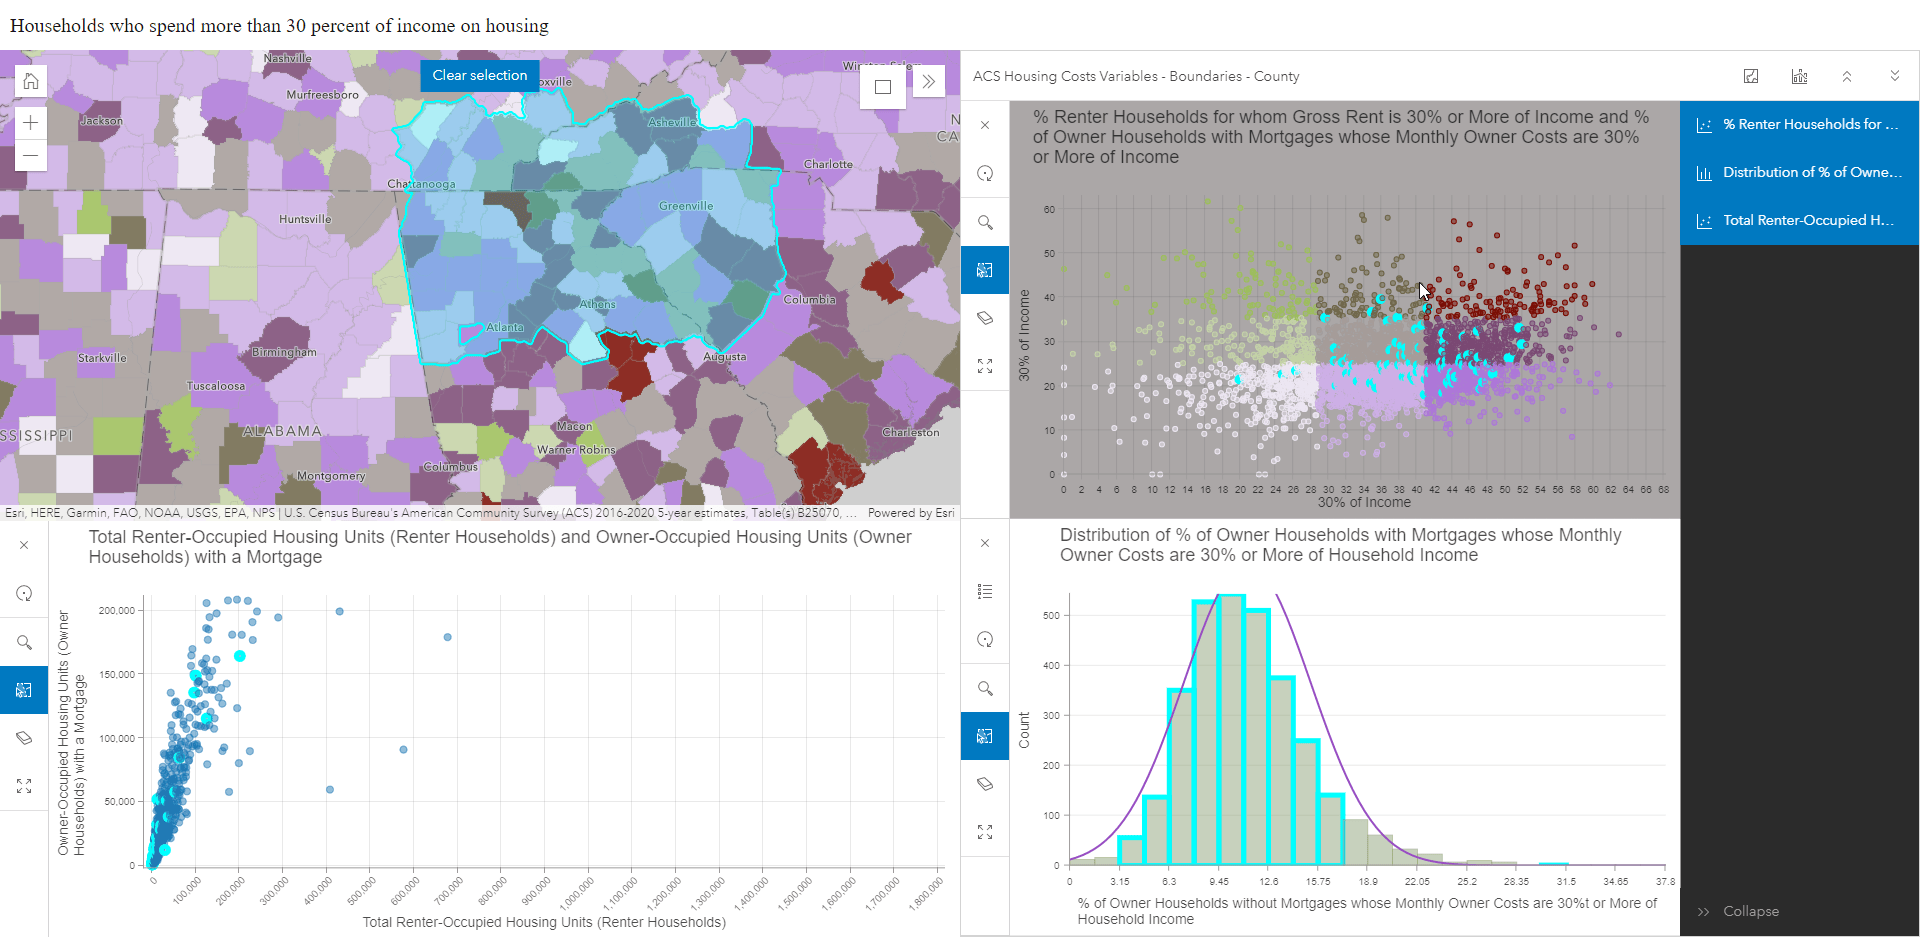
- Two-way selections – Select features from the map or the chart and see selections reflected in the map and the chart
- Access charts from multiple layers – If charts exist on more than one layer, there is an option to toggle between the layers to load in the charts.
- Bookmarks – Enable bookmarks configured in the Map Viewer to include a collection of preset extents
- Navigation boundary – Keep the area in the map on focus using a navigation boundary or disabling the ability to scroll
- Additional tools – Cover page, Information button, Legend, Layer List, Search
Examples
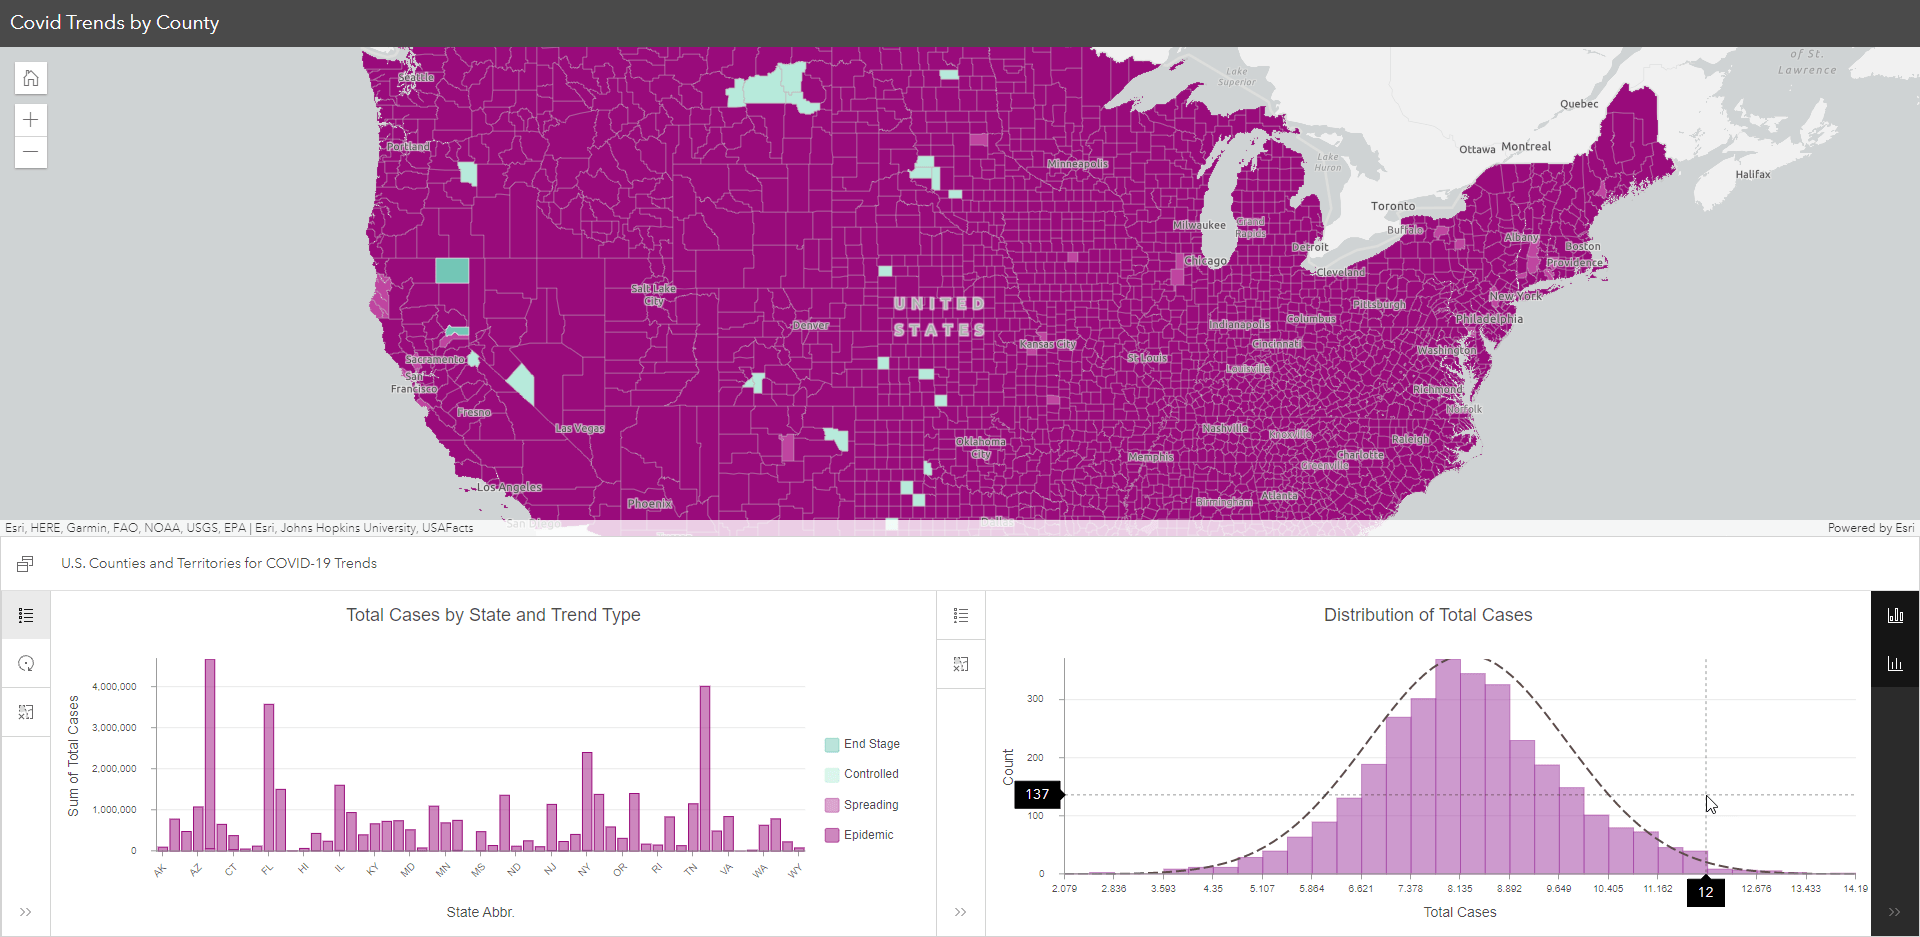
View Covid-19 trends in the United States, look at cases by state and distribution of total cases.
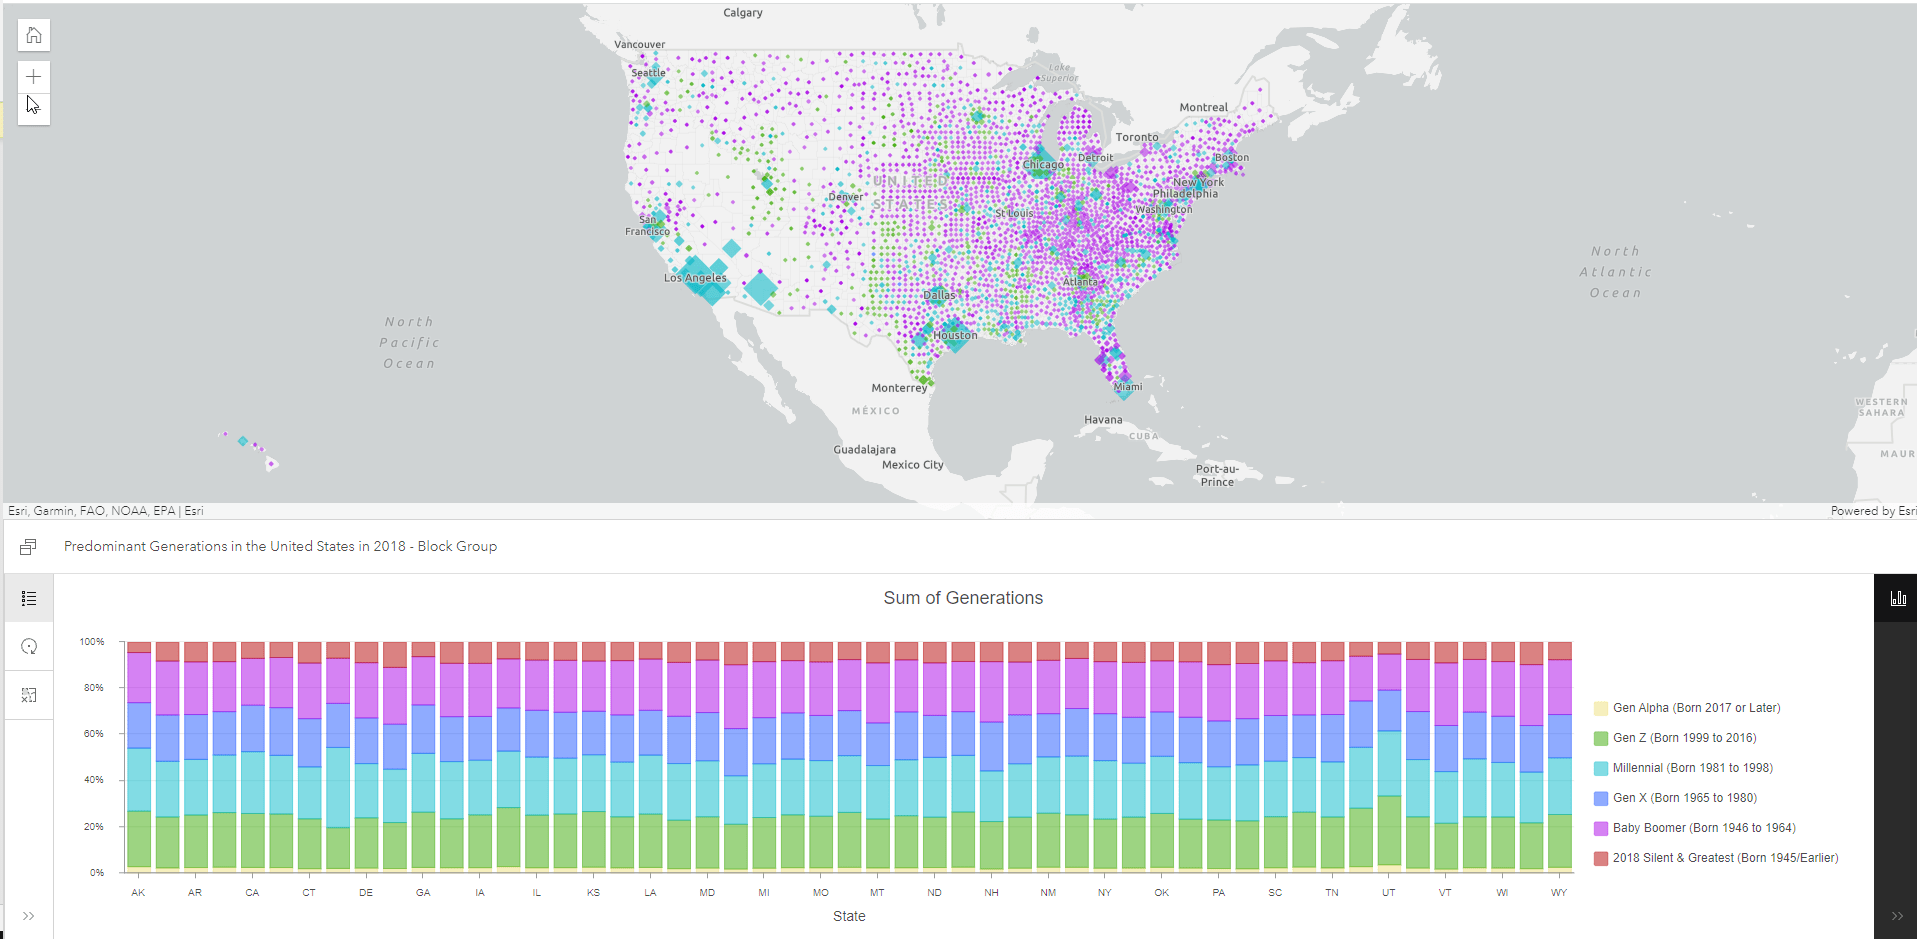
Adding a chart to show each state’s generational breakdown can add value to the map. Test out this Chart Viewer app, use the chart’s interactive legend to turn off/on different generations in the chart.

Article Discussion: