The Reporter Instant Apps template is designed to provide users with the ability to submit reports, interact with existing reports, and collect feedback through comments, likes, and dislikes. The main components of the app include a web map, a side panel with a list of layers, and a button to submit a report. The web map displays all the features from the layer or layers for visualization and interaction. The side panel displays the layers, reports, and other capabilities, such as likes, dislikes, and comments. It’s important to note that the Reporter app is intended to replace the existing Crowdsource Reporter, Crowdsource Polling, and GeoForm apps. With its enhanced features and functionality, the Reporter app offers an improved user experience for reporting and interacting with reports. This app was previously released as a beta app in February of 2024. All apps created in the beta phase (Feb 2024 – June 26, 2024) must be republished to fix a breaking change. For more information, visit this KB article.

Set up the app
In Reporter, you can add a single map with at least one editable layer. The app can be created from the Instant Apps home page without any content, with a web map from Map Viewer, or from the item details page of a web map. In the app configuration, you can add a map from the available options in the map stack. The process of adding a map to the app is different from Crowdsource Reporter, as groups are no longer a requirement for this app. Once you have completed adding the desired map to your app, you will have options to configure the app’s capabilities (not a complete list of options):
-
-
- Reporter options: This allows app authors to select reporting layers (only applicable to editable features) and enable various capabilities such as reporting, commenting, likes, and dislikes. App authors can also configure a numeric field to store the count of likes and dislikes. Additionally, they can customize the text for the report button and the submission.
- Attribute Filter: App authors filter each layer’s reports based on specific attribute criteria.
- Header: Choose to include a header in the app.
- Cover page: Enable sign-in through the cover page and enter as a guest or with an ArcGIS Online account.
- Basemap toggle: Enable app users to switch to a different basemap.
- Theme settings: Change the app’s appearance by applying dark or light mode, add a logo to the header, and use custom or predefined colors to style certain elements in the app.
- Map area: Includes the map view and Navigation boundary options. The map view option allows the user to set the map extent at which the app opens. The Navigation boundary option sets boundary limits for map extent and scale.
- Basic map navigation tools include Home, Zoom tools, Bookmarks, Legend, or Search in the map.
-
View reports
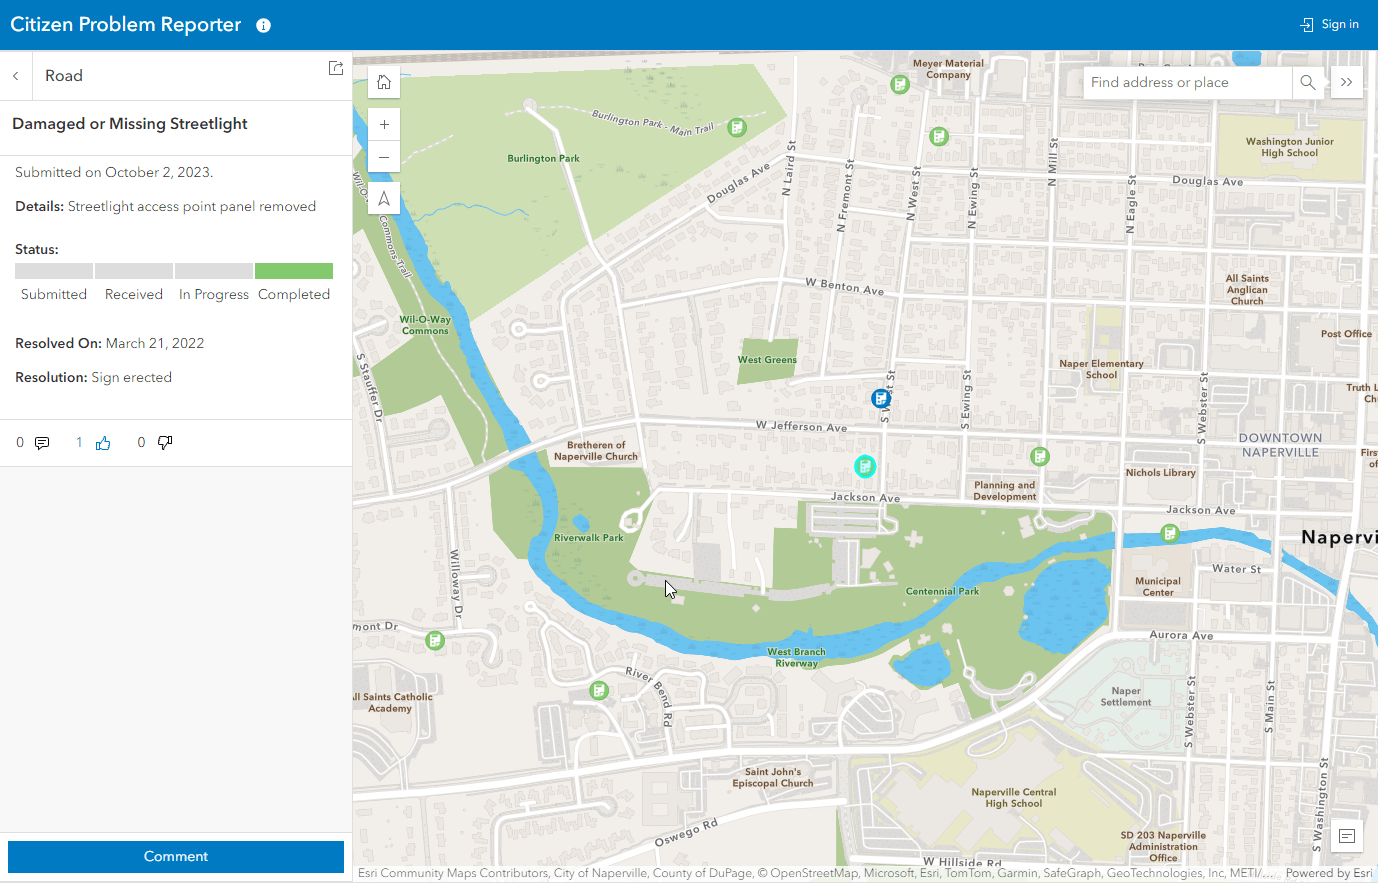
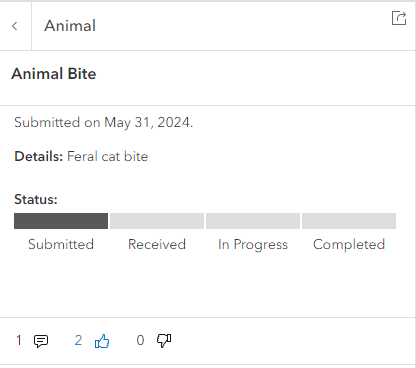
To view a report, the app user can choose an available layer from the list, displaying a list of reports associated with that layer. By selecting a specific report, its detailed information will appear on the side panel, while the map automatically zooms in to highlight the corresponding feature. Alternatively, if the user interacts with a feature directly on the map, the popup details of that feature will be shown on the side panel, but only if the feature belongs to an editable feature layer.

Submit reports
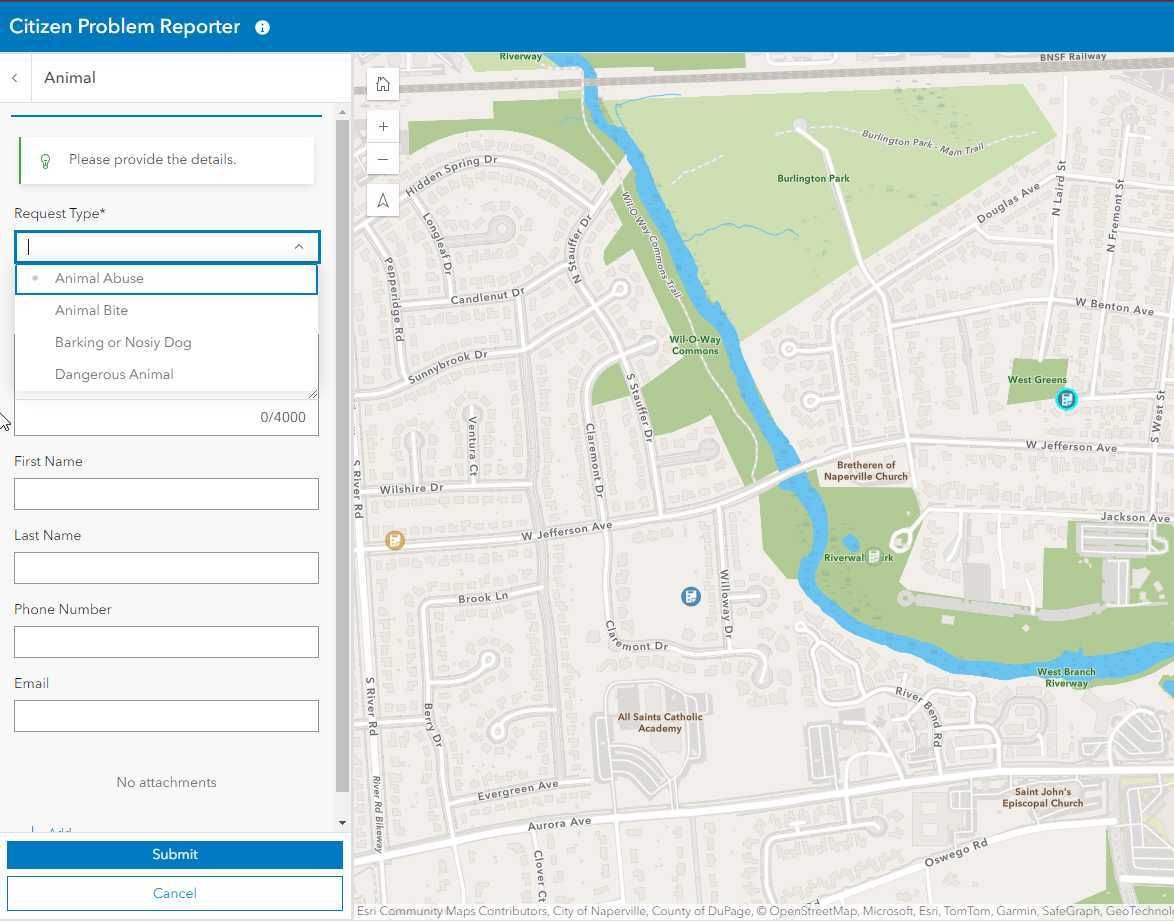
To submit a new report, users can simply click the Report an incident button, the button text can be customized in the configuration. This button can be accessed from the main layer list or after selecting a specific layer. The user-friendly workflow allows users to use the search widget to search for and zoom to a specific location to create a feature, or they can create a feature directly on the map. Once a feature is added to the map, users can enter additional details using the smart form in the side panel. They can also attach relevant multimedia to provide more context. The newly submitted report will appear at the top of the feature list for that layer, ensuring easy access and visibility.

Submit comments
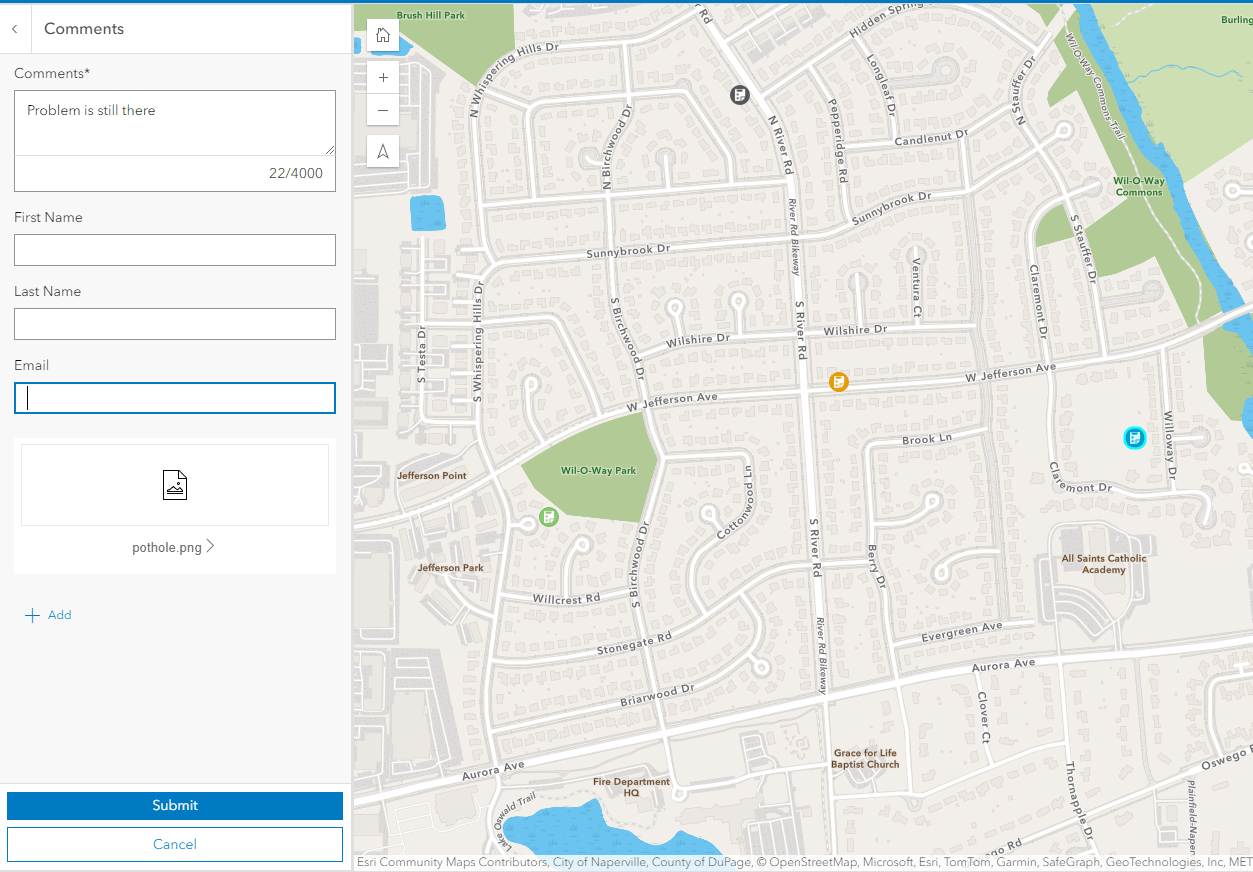
To submit a comment on an existing report, app users can click the comment button. This button can be enabled in the configuration for layers with a related table. It is recommended to configure smart forms in Map Viewer for the related table. When the comment button is clicked, the configured smart form opens. Users can also attach relevant multimedia to their comments. The newly added comment will appear at the top of the comment list for visibility and access. The comment button also shows the total number of comments submitted to the report. This gives app users a quick overview of the engagement and discussion surrounding the report.

Like and Dislike
App users can provide feedback regarding the existing reports by clicking the Like or Dislike buttons. These buttons can be enabled in the app configuration by selecting a numeric field from the layer to store the count. The count will then be displayed next to the respective button, allowing visibility into the report’s overall feedback and engagement. To create a functional experience similar to that of a Crowdsource Polling application, app authors can configure the app by enabling only commenting and like/dislike capabilities and disabling the reporting capability.

Sign-in options
The app features a sign-in button in the top right corner, allowing users to sign in before interacting with the app. Optionally, app authors can enable sign-in from the cover page, which allows them to provide information about the app and choose between two options: “Sign-in” using an ArcGIS Online account or enter as a guest. Once signed in, their profile image or logo with their initials appears in the top right corner of the app. At any time, app users can sign out of the app.
Sort and Filter reports
To tailor your data view, you can set up attribute filters for each layer in the configuration. By doing so, only reports that meet your specified criteria will appear on the app. In addition to that, our app offers a range of sorting options for reports. The app author and the app user can choose to sort reports by newest, oldest, highest voted, or lowest voted. With these options, you have the power to modify the view of your data and uncover valuable insights through data exploration.
Share reports
To easily share a report, click on the share button. This will open a dialog box where you can choose to copy a link or share the report on a social media platform. When the report is shared, the popup details will open, and the map will automatically zoom to the feature.


Article Discussion: