If you’re like me, then you may find that creating a report from your analysis is more difficult and time consuming than the analysis itself. I could spend hours playing around with color palettes and layouts before I’m happy with my report.
Fortunately, Insights themes are a great way to streamline this process. With Insights themes, you can quickly create consistent reports for your organization. An Insights theme includes card and page settings, like background colors and borders, plus card layouts. When you add a theme to a page, the existing cards are rearranged to match the theme layout and the settings are applied.
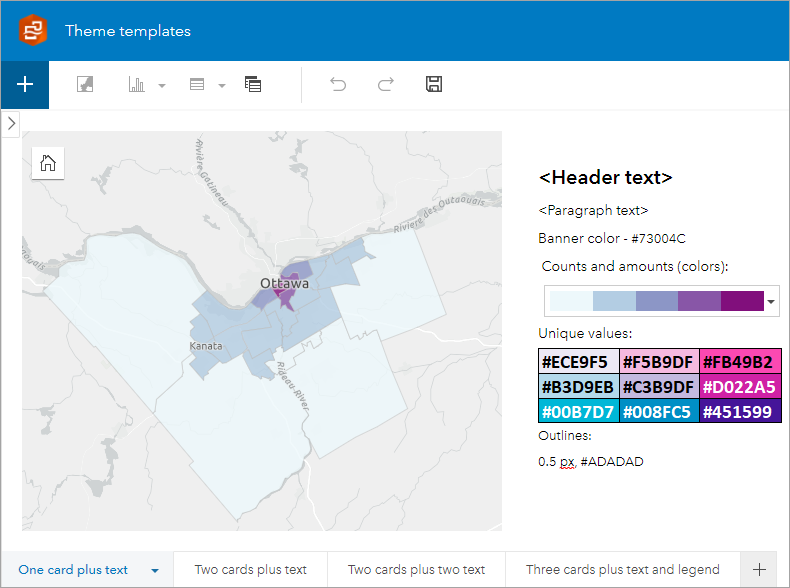
Check out the themes I created, and use the following tips to make your own!
Create themes for your organization
You can share Insights themes like any other item in ArcGIS Online or ArcGIS Enterprise. You can create a set of themes and share them to a designated group to make them easy to find when you or other members of your organization are creating a report. Investing some time up front to create the themes will save time in creating future reports.
One way to create your themes is using a designated workbook with a single page for each theme. I created pages with different card types, sizes, and positions based on the number of cards and text boxes on the page.
For my themes, I chose a plain white background for both the page and the cards, and I removed the borders on all cards. You may want to use company colors or match the background to your company’s website. Your reports may also have different needs for text boxes and images. You can use separate pages in your workbook to make themes that fit all your requirements.
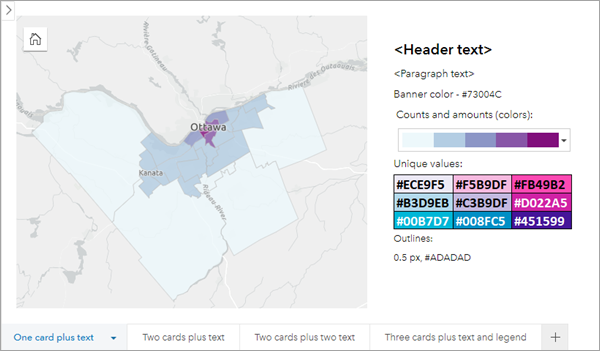
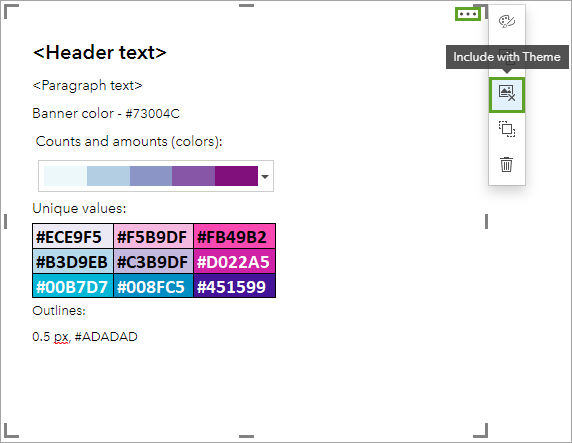
I also included text boxes with placeholder text for paragraphs and headers, plus information on banner and symbol colors. You can use the Include with Theme button for text and media to share the exact text, images, or videos along with the theme. You may want to use the placeholder text in your text boxes to note information that should be used for the cards in your company’s reports.
After you’ve designed your themes, make sure to share them with members of your organization so that other Insights analysts can use them. You can also use groups or folders to keep your themes organized.
Apply themes to your report
After you’ve created and shared your themes, you can begin to apply them to your pages to create reports.
The theme will attempt to place cards on your page based on the card types in the theme. However, it is not required to have the same card types or the same number of cards to apply a theme. For more information, see Placeholder cards.
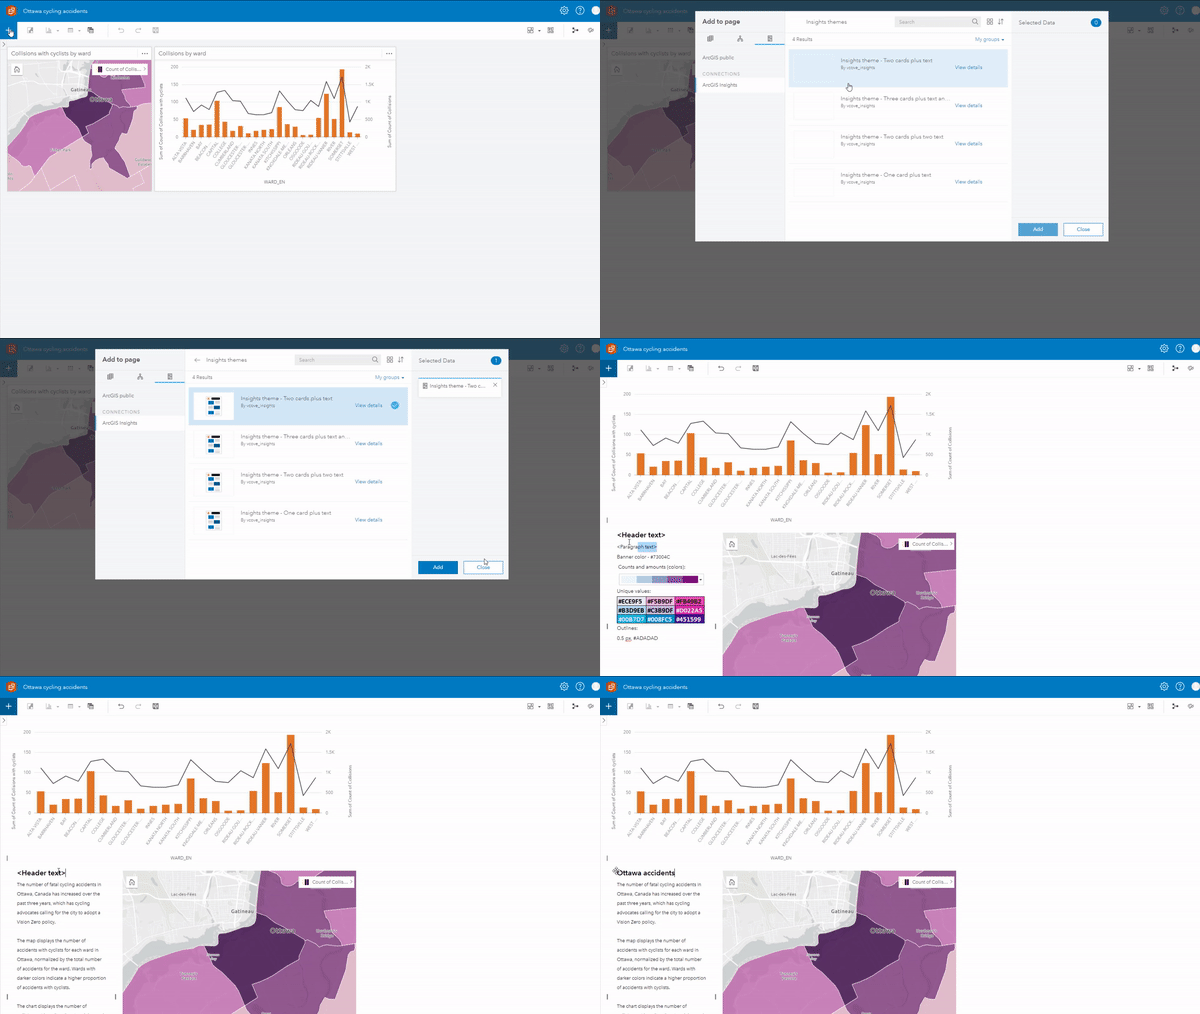
The symbol styles are not included in a theme, so you’ll need to update any color palettes and symbols, as necessary. Including information on the recommended colors in text boxes will help speed up this process.
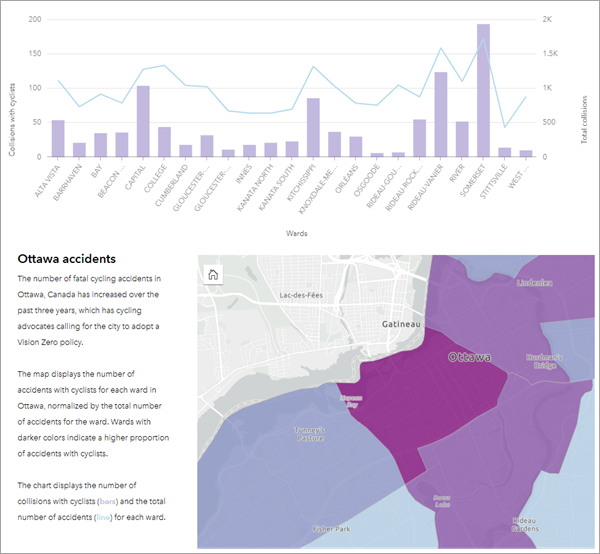
After applying your theme and updating your symbols, your report is ready to share.
Takeaways
- Insights themes are a quick way to create reports from your analysis in Insights.
- Create a set of themes with different layouts that can be applied to pages by analysts.
- Use the Include with Theme button for text and media cards. Include with Theme will save font settings, text, and important images for when the theme is applied.
- Develop a set of color palettes and symbol styles and include that information in the text boxes in your themes.


Article Discussion: