ArcGIS Insights is a great product to use when you need to do analysis, but sometimes just doing the analysis isn’t enough. Communicating your results with clients and colleagues is often required, and one of the best ways to share your results is through ArcGIS StoryMaps. This blog will walk you through the steps to share your results and embed them into ArcGIS StoryMaps.
Looking for some inspiration? Check out these examples of Insights content embedded in ArcGIS StoryMaps:
- In search of refuge: Mapping forced displacement from 1951 to 2020
- Where do they go?: Exploring bird population and migration with ArcGIS Insights
Before you begin
This blog deals with the steps you perform after you have completed your analysis. You can follow along with the steps using a page from your own analysis, or by first completing the exercise Create a report in ArcGIS Insights up until the steps when you share your results.
You will also need to open ArcGIS StoryMaps and create a new story or open an existing story.
Publish your report in Insights
To view your analysis from Insights in a story, you will need to publish your Insights report. Shared reports can be viewed by members of your organization or the public, even if the viewer does not have an Insights license. The data on a report cannot be updated or analyzed, but the viewer can interact with cards, including making selections, zooming and panning on a map, and flipping the cards to view statistics.
Before you publish and share your report you should consider some of the following edits:
- Rename the cards with descriptive titles.
- Resize the cards so they fit on your page.
- Change the layer style so that the symbols help tell your story.
- Write a description on the back of each card explaining the analysis or data being displayed.
- Share your data or get the data owner to share the data. If the data in the report is not shared then it may not appear in the story for all users.
For additional tips for making compelling visualizations in Insights, see Communicating your Insights: A practical guide.
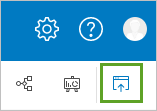
Once your cards have been organized the way you want them, click the Publish button on the workbook toolbar.

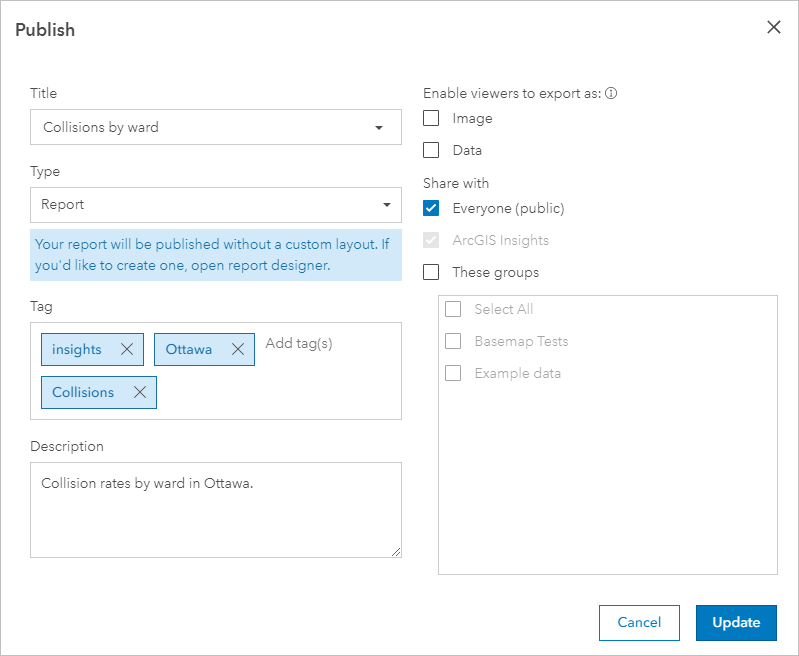
The Publish window opens and you can update the Title, Tags, Description, and Share with options. You can also choose whether to allow people viewing the report to export your cards as images or data.
You must share your report with Everyone if you plan to make it public. If your story is staying within your organization then you can share the report with just your organization. Click Publish or Update to publish the report.

When your report is published, the window will display four new options: View your published report, Access your report item, Embed, and Schedule an update. You are going to use the <iframe> from Embed to display your report in a story.
The <iframe> is optimized to use in ArcGIS StoryMaps by default. You can configure the <iframe> further to fit the size of your report. For more information, see the Insights iframe guide.
Add an <iframe> to your story
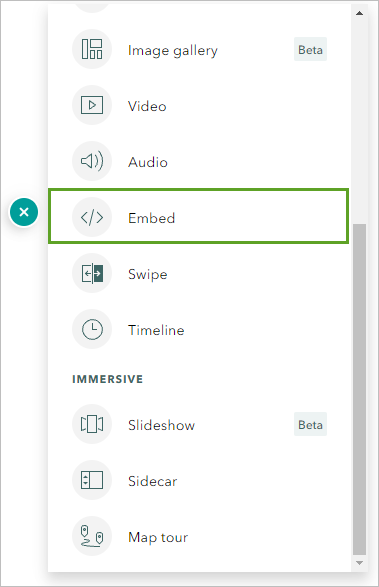
An <iframe> is used to embed your shared Insights report in your story as a web page. When you add new content to a story, you will have the option to add web content through an embed block.

Copy the <iframe> from your published report, paste it in the Add web content window, and click Add. Your Insights report will now be embedded into your story. You can change the size of the embed block and configure the embed options.
Resources
Use the following reources to learn more:
- Communicating your Insights: A practical guide
- Publish and share a page from Insights
- Configure iframes to embed published reports
- Insights iframe guide
- Add media in ArcGIS StoryMaps
This article was originally published on March 22, 2017 and has been updated.


Article Discussion: