Insights for ArcGIS 3.2 now supports scripting in Python and R. You can now extend your Insights experience with the entire open data science world.
We have designed Insights from the ground up as a game-changing location analytics workbench. We have similarly added a unique, easy to use scripting experience that is both flexible and scalable. Your team will stand out from the competition with the combination of Insights for ArcGIS, Python, and R at their fingertips.
Let’s take a look at some of the exciting features that make up this new aspect of the Insights experience.
Introducing Jupyter

The Insights scripting team is a group of veteran GIS analysts, data scientists and software developers. We immediately thought of the Jupyter project when tasked with adding scripting to Insights. Jupyter is an open source, interactive computing project that has taken the data science world by storm.
We want to run Python and R scripts interactively in a web application. Jupyter is designed to do exactly this. Top universities and businesses use the Jupyter project extensively, so it is already tried and tested under many circumstances. As a result, you get a huge amount of functionality out of the box when using Python and R in Insights.


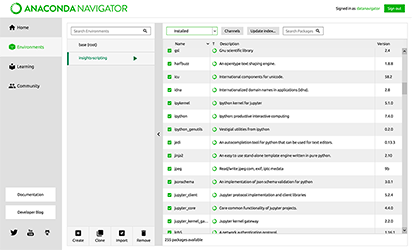
Bring your own environment
Everyone from individual users up to full development teams can tailor the scripting experience in Insights to their needs. You stay in control.
The Insights team has listened to the true needs of analysts. You want to use the tools that you are familiar and comfortable with inside Insights. Therefore we have developed a way that allows you to work with multiple scripting environments, and easily switch between them based on the needs of the current workflow.
We are calling this the ‘Bring your own environment’ approach.
Scripting Environments
Think of scripting environments like terrariums. Each terrarium is an isolated space containing a unique set of plants. The plants in one terrarium do not affect the plants in the next, even if they sit right beside one another. Similarly, scripting environments contain a unique set of packages. The environments work independently of one another, allowing you to change what’s inside each one worry-free!
You can easily share and recreate your environment using freely available tools once you’ve found the right setup for your needs. If you’ve already got a familiar environment, use it with Insights by installing a few extra packages.
Whether you are new to scripting or a seasoned developer, this approach will make it easy to get started at the level at which you are comfortable. We have released The Insights Scripting Guide on github for a deeper look at creating and connecting to environments.
Package Management
We make extensive use of package managers in our scripting work. Package managers are software that make it easy to add functionality to your environments. Additionally, they help with reproducing and sharing environments once you’ve found a setup that works for your team.

You can use fully featured package managers such as Anaconda, or take a lower-level approach using tools like pip and CRAN. Consequently, the bring your own environment model lets you work with packages in the way that makes sense to you.
Using Your Environment
Once you have created an environment as described in The Insights Scripting Guide, you connect to it directly from your workbook. Each page in a workbook can connect to a unique environment, or multiple pages can use the same one.
We have added several enhancements to the Insights experience to make it easy to work with your environments. Just open the console on a workbook page and provide a URL. Insights presents a user-friendly way to work with your data, why should scripting be any different?
The Console
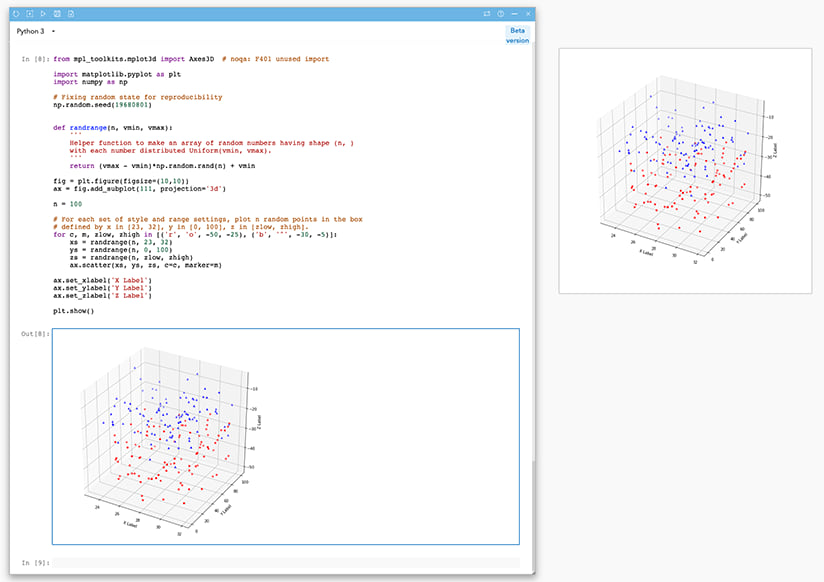
The scripting console is the main interface for working with Python and R in Insights. It presents an experience that is familiar to users of the suite of Esri’s ArcGIS software. Experienced developers and data scientists feel at home using a console. Write efficient code with features such as syntax highlighting and autocomplete. Similarly, you can interactively view your results with ease using Jupyter widgets.

Datasets in the Console
We designed the console to have a similar feel to the rest of the Insights experience. Drag and drop your data into the input field. The dataset name populates into your cell and can be used directly in your code.
Data cleaning is one of the most common uses for scripting in location analytics. Customers often provide data which isn’t formatted properly, or has missing values. According to reports, data scientists spend between 60 – 80% of their time cleaning data.
Previously, you had to open the data set in another program to fix the mess. That’s time spent switching between programs, importing and exporting data, and learning multiple software systems. Not an ideal use of time! You can now run your data cleaning scripts within Insights via the console, bringing it all to one place.
Once you have run the script against your data, you can bring the result into your workflow in several different ways. You can create a new dataset, so your result is easy to use in other workflows. If your script outputs a Jupyter widget such as a chart, another option is to create a card.
Try Scripting in Insights Today
Scripting in Insights for ArcGIS opens up a whole world of new possibilities. The team is certainly interested to see how you use this new feature. Your imagination is the limit!
Log in to Insights so you can get a first-hand look at the changes. Insights is available in a free 21-day trial if you’re not already using it, so Sign up today!
Commenting is not enabled for this article.