Targeting retail advertising requires a host of spatial information about the target population and its movement. For accurate analyses, retail businesses need precise information about where people are, when they are there, what other places they tend to go, and how frequently they are in these locations. Additionally, retail businesses also benefit from being able to identify social, behavioral, and economic details that define their target audiences and interests.
Esri technology allows us to enrich and analyze mobility data to generate the key information needed for successful retail mobility analytics. For analytics at scale, ArcGIS GeoAnalytics Engine brings together the power of Esri’s spatial analytics capabilities and Spark-based distributed computing to allow for rapid analysis over larger datasets and temporal ranges.
Data for movement analytics is often challenging to analyze across large geographic regions and for the range of times necessary to identify the spatiotemporal patterns driving retail mobility. Let’s look at how JAKALA, a Milan-based marketing technology company, works with billions of data points with GeoAnalytics Engine in Databricks to analyze consumer movement data to better understand geographic patterns. This solution also helps JAKALA analyze the retail landscape, target physical or social media advertising campaigns, and improve marketing strategies.
Enrich data to create sociodemographic profiles
The heart of understanding retail patterns is understanding where people are and what places they are visiting. Every month, JAKALA works with billions of data points from hundreds of thousands of mobile anonymous devices that are sourced from a vendor that gathers opt-in GDPR compliant location tracking data. The spatiotemporal analysis functionality in GeoAnalytics Engine enables JAKALA to combine this high-volume location data with their in-house sociodemographic data (JWhere) to assign anonymous devices to a set of “persona” profile categories that they have defined.
These sociodemographic profiles are key to understanding the broader spatial patterns for the target of interest and provide the foundational data for hyperlocal retail profile and advertising analyses.
Identify broad patterns in retail mobility
The location data is also analyzed with GeoAnalytics Engine to identify the points of interest (POIs) that have been visited, frequency of visits, and patterns of visitation across the sociodemographic profiles. These details help enhance the understanding of the retail interests and trends specific to a profile and allow JAKALA to evaluate the similarities and differences between different profiles to better understand how to efficiently grow interest in new markets.
For instance, if we start with any retail category of interest such as banking, restaurants, automotive, grocery, shopping in general, etc., then data can be aggregated geographically to analyze how visitation has changed over time and see the overall profile of anonymous visitors. Questions can be answered such as who is visiting these sites and what other categories of POIs do they visit?
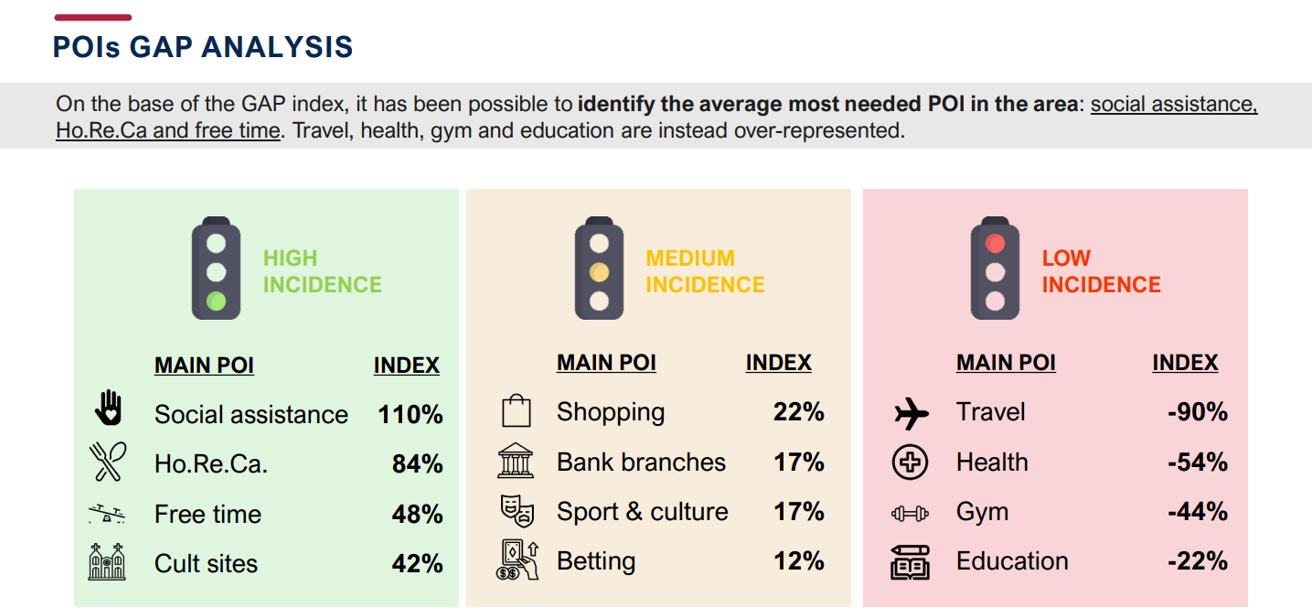
Going beyond looking at general visitation for categories of POIs, the analyses can expand to larger geographic regions of interest to assess gaps or saturation in various markets. For this type of analysis, JAKALA can perform needs assessments over entire regions to identify the categories of services that are underdeveloped and what locations would be suitable for new development in these categories.
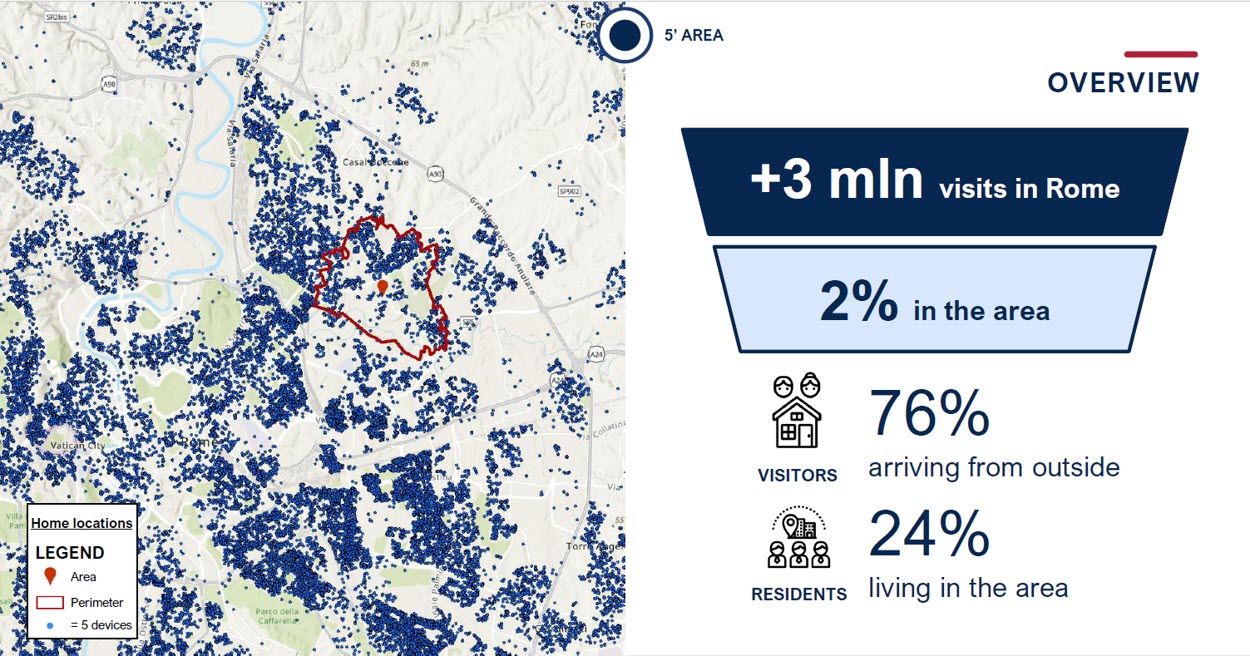
For instance, for a neighborhood in Rome, JAKALA can assess retail visitation patterns to identify the percentage of visits that come from residents of the neighborhood versus outside the neighborhood. They may ask questions such as what types of POIs do people from outside the neighborhood travel in to visit or what type of POIs do people living in the area of interest look for outside the area?

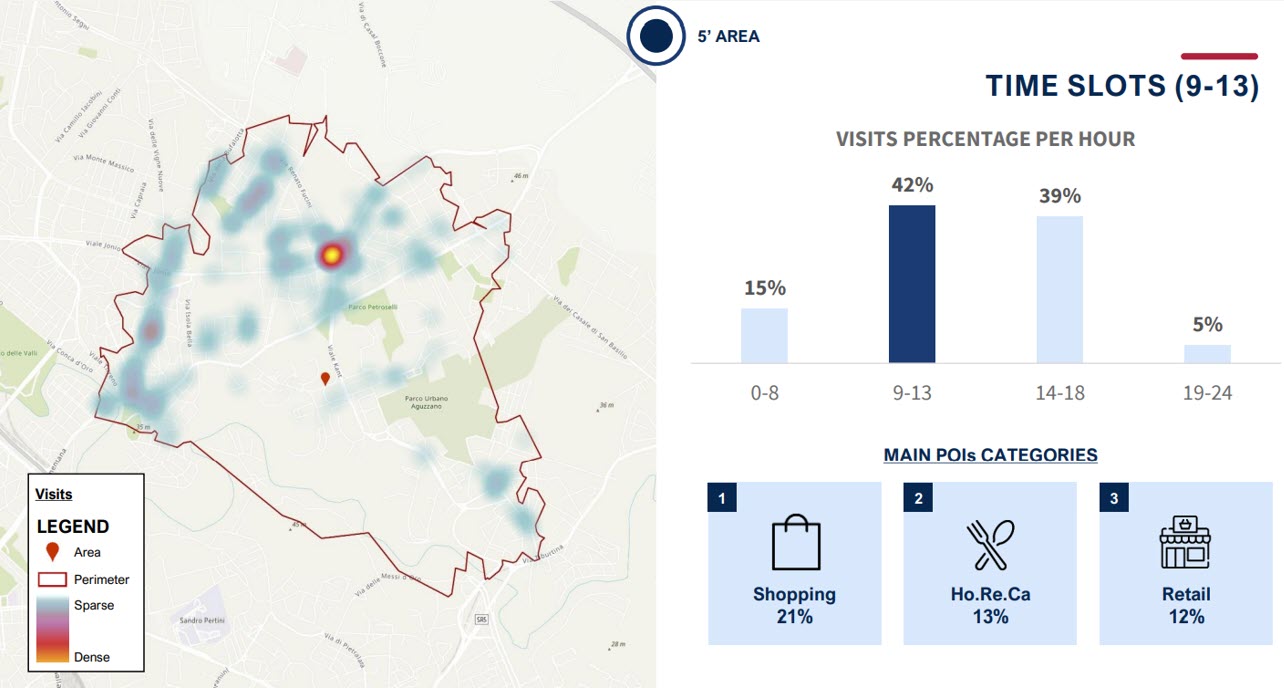
Taking this further, JAKALA can look at the temporal patterns within those visits to understand whether specific days of week or times of day are associated with greatest number of visits to different categories of activity (e.g., shopping, education, healthcare, or restaurant).

These analyses allow JAKALA to explore further with gap analysis to present the overall picture of the area to help identify opportunities for new services or infrastructure needed within the area to serve the population.

Identify local mobility patterns
More local analyses can be done using this data to focus on individual POIs.
In order to target advertising and social media campaigns for a particular shop or activity, JAKALA can evaluate profiles for the most common category of visitors. Using spatiotemporal analyses, they can identify when people tend to visit most often such as lunch time or after dinner. Using more advanced analyses, they can also perform cross-visit analyses to identify the most frequent types of places that the visitors here also go.
For instance, we might find that “personas” who frequent a certain restaurant are also more likely to visit some of the same grocery stores, exercise facilities, or entertainment venues. Knowing this, a business can then more effectively target locations for advertising campaigns as they know where their clientele may be found.
Another analysis might be performing a site evaluation for a single store that needs to understand the potential of different locations before opening a new shop. A user can utilize GeoAnalytics Engine to calculate service areas around potential locations for a new store. JAKALA can then use these geographies in conjunction with their in-house sociodemographic and mobility datasets to evaluate the profiles of people who live in the area or visit it regularly.
By understanding the profiles of people who live in the area and visit during specific time ranges like weekend evenings, as well as the mobility and retail preferences of those individuals, JAKALA can help identify optimal locations for targeting more effectively.
These are just a few of the applications for GeoAnalytics Engine in working with high volume data to analyze retail mobility. If you have mobility data and want to better understand the analytic possibilities, we would love to hear from you!


Article Discussion: