ArcGIS Field Maps and ArcGIS Tracker generate a unique session ID every time a mobile worker starts location tracking. This means that a tracking session can be created for each of their assignments. You can analyze these tracking sessions to better understand the work that was performed. This is especially useful when verifying inspections.
This blog post will show how you can use the session_id field within the tracks feature layer to verify four pier inspections made by one mobile user.
Scenario
The port authority in Portland, Maine is conducting its annual round of pier inspections.
I’m the lead for a team of pier inspectors, and one of my workers inspected four piers yesterday. An inspection is considered complete if the length of the inspection equals at least 70% of the pier’s perimeter.
I will use ArcGIS Pro to verify that the mobile worker’s inspections meet this requirement for each pier.
Import tracks
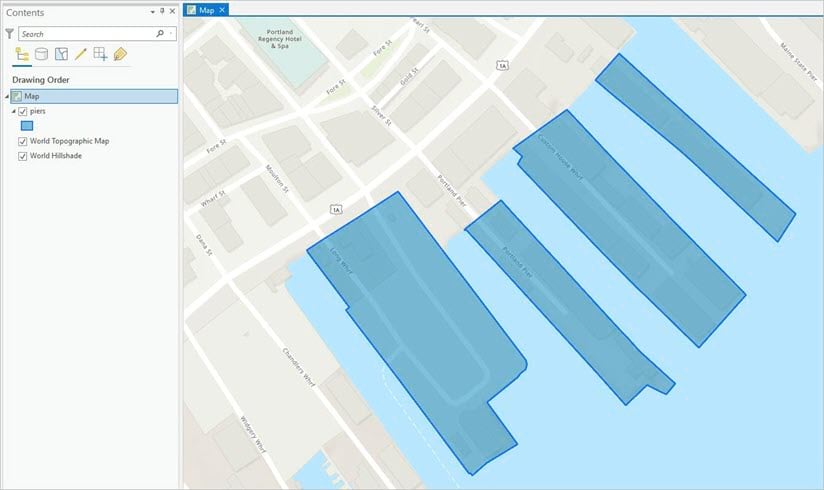
First, I’ll open the ArcGIS Pro project that contains the piers feature layer. This layer contains the four piers that were inspected by the mobile worker.
Tip: If you would like to automate tasks using the ArcGIS API for Python, see the GitHub repo of Tracker scripts.
Next, I’ll import the mobile workers’ tracks that were recorded by the Field Maps mobile app or Tracker mobile app. After clicking Add Data, I’ll navigate to the Pier Inspections group within my organization and add the Pier Inspections layer to the map. This layer includes both the tracks feature layer and the last known locations layer.
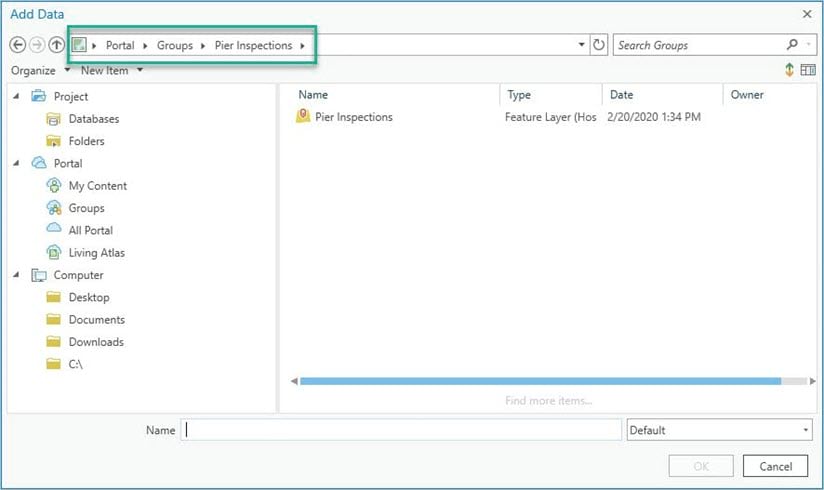
Note: A group is automatically created in your organization whenever you make a track view. The tracks feature layer will always be found in that group.
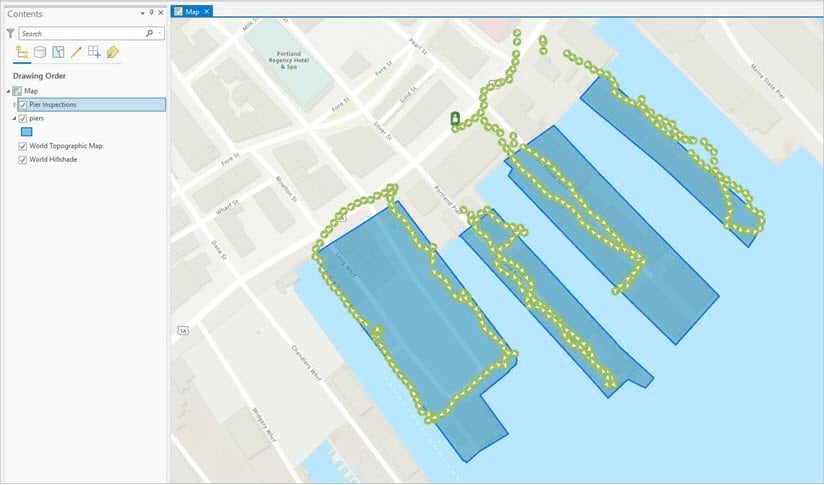
The tracks and last known locations layers appear on the map.
Remove extraneous track points
By looking at the tracks layer on the map, you can see that there are some points that fall outside of the piers layer.
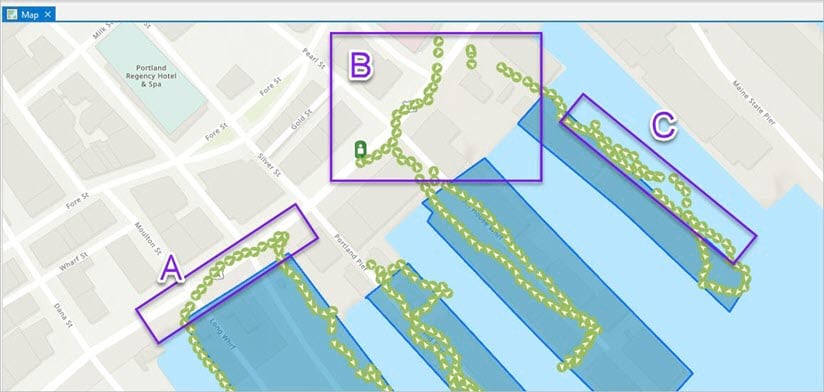
The points in boxes A and C are likely still part of the pier inspections. The points in box B are probably not part of these inspections. The pier inspector may have just forgotten to turn location tracking off when they weren’t working.
I want to remove the points in box B so they don’t interfere with the inspection data, but I want to make sure the points in boxes A and C are still included. To do this, I will create a buffer around the piers layer, then find the intersection of the track points within it.
I’ll use the Buffer geoprocessing tool to create a buffer of 20 meters around the piers layer.
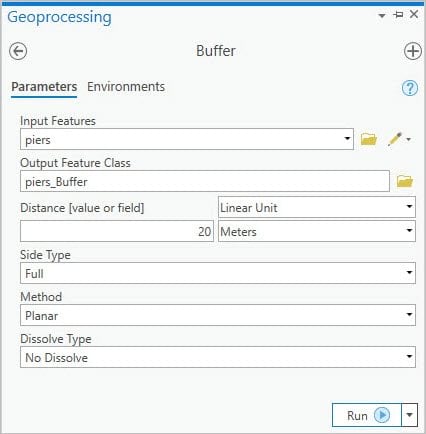
Here’s what that buffer looks like:
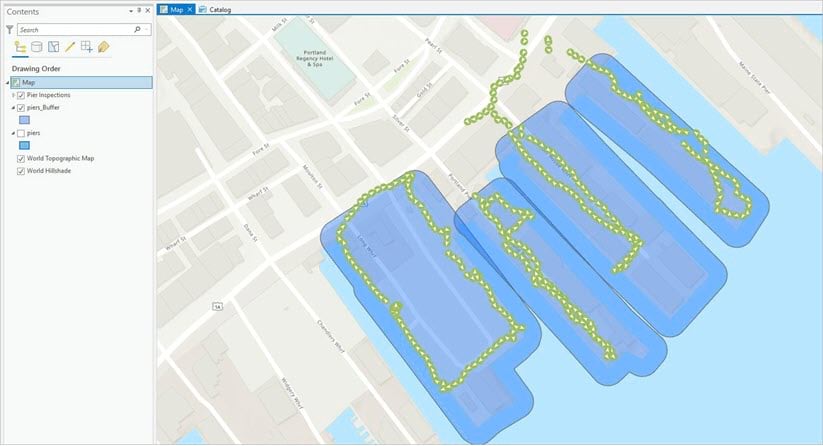
As shown above, the track points I don’t want included in my map are outside of the buffer.
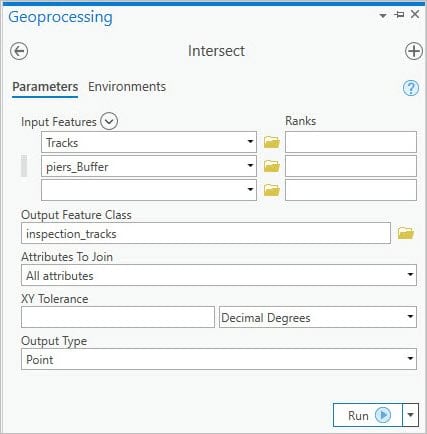
Next, I’ll use the Intersect geoprocessing tool to create an output feature class of the track points I want to keep.
I’ll use the piers buffer and track points as the input features, and I’ll name the new output layer inspection tracks. I’ll make sure that the output type is set to Point.
Here’s what the new inspection tracks layer looks like on my map:
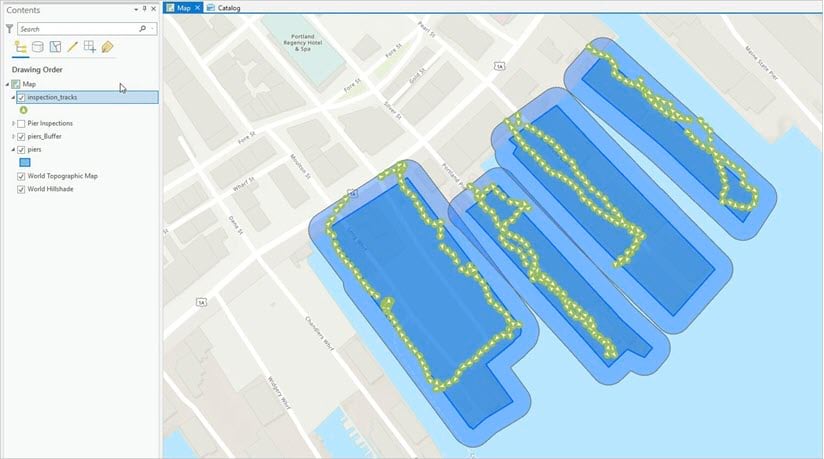
Now that I have the track points associated with pier inspections, I’m ready to work with the data.
Convert track points to lines
I will now use the Points to Line geoprocessing tool to create a unique track line for each inspection. This is so I can compare the length of each inspection to its corresponding pier.
This is where the session_id field comes in handy.
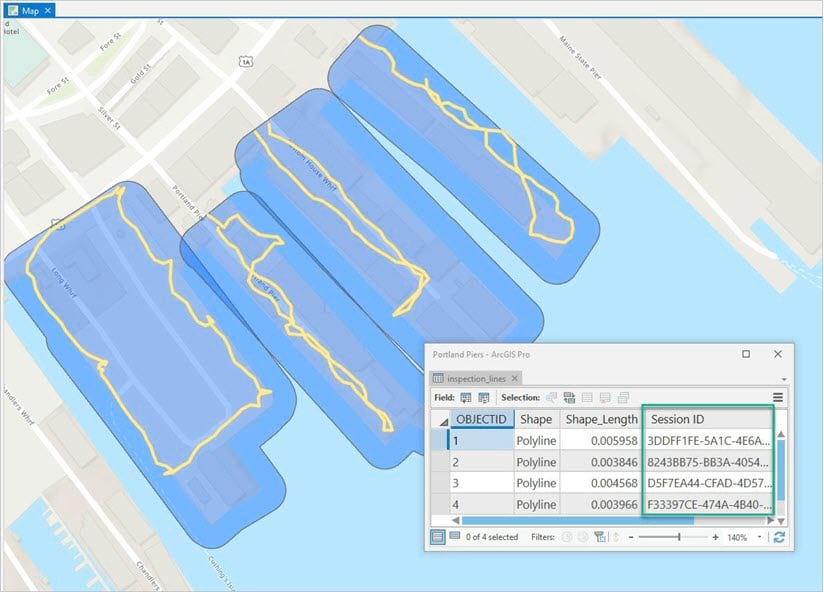
The mobile worker turned location tracking off when they were done with each pier, then turned it back on when they began a new inspection. This created a unique session ID for each inspection.
As shown below, I’ll use the Session ID as the input for the Line Field to generate a line for each pier inspection. I’ll use the Location Timestamp as the input for the Sort Field to sort the points in the order in which they were recorded. I’ll call this layer inspection lines.
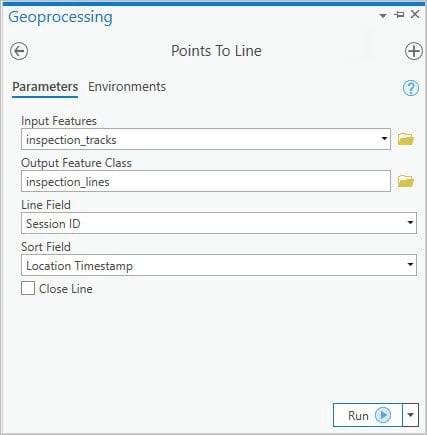
After running this tool, a line representing each inspection appears on the map. If I open the inspection lines attribute table (shown below), I can see that each line is assigned the associated session ID from each tracking session.
Calculate geometry of inspection length
The length of each pier is measured in meters, so I’m going to calculate the length of the track inspections using the same unit of measurement.
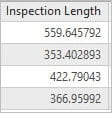
I’ll add a new field to the inspection lines layer called inspection_length. This will hold the line measurements.

Then I’ll use the Calculate Geometry Attributes tool to calculate each line’s length in meters.
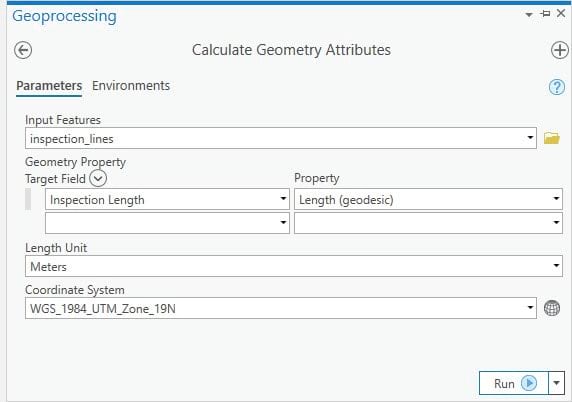
Once I run this tool, I will have the length in meters for each inspection line, as shown below.
Join the layers
I’m now going to combine the inspection lines layer and piers layer with the Spatial Join geoprocessing tool. This tool will join the attributes of both layers based on their spatial relationship. This will make it easier to compare the inspection length with the perimeter length of each pier.
Note: This assumes that none of the tracks overlap with other pier features.
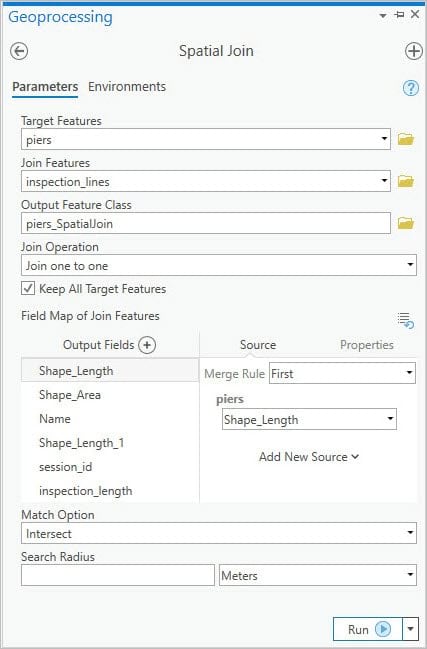
After I run this tool, I can open the piers spatial join attribute table to see that each inspection line was successfully joined to its corresponding pier.

Create verification field
Now that I’ve joined the piers and inspection line layers, I can create a field that will verify whether each inspection was completed according to the inspection guidelines.
I’ll open the piers spatial join attribute table and add a new text type verification field. I’ll name it inspection_status.

Next, I’ll calculate this field so that it returns a value of ‘complete’ if the inspector covered at least 70% of the pier’s perimeter length. It returns a value of ‘incomplete’ if the inspector covered less than 70%.
I’ll use the following expression for this calculation:
“Complete” if !inspection_length! >= (!Shape_Length!*.70) else “Incomplete”
Here it is in the Calculate Field window:
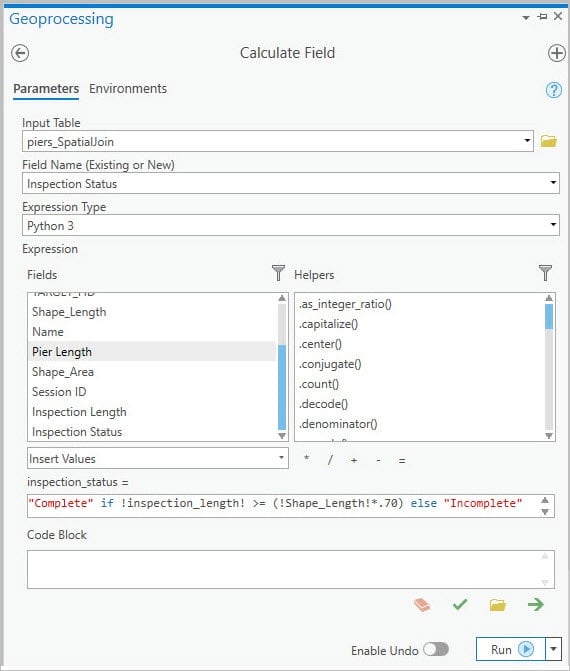
Note: Pier Length is an alias for the Shape_Length field. Whenever Shape_Length is used in this exercise, it is referring to the length of the pier perimeter.
After I run this tool, the inspection_status field will be populated in the attribute table as shown below.
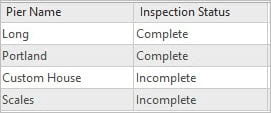
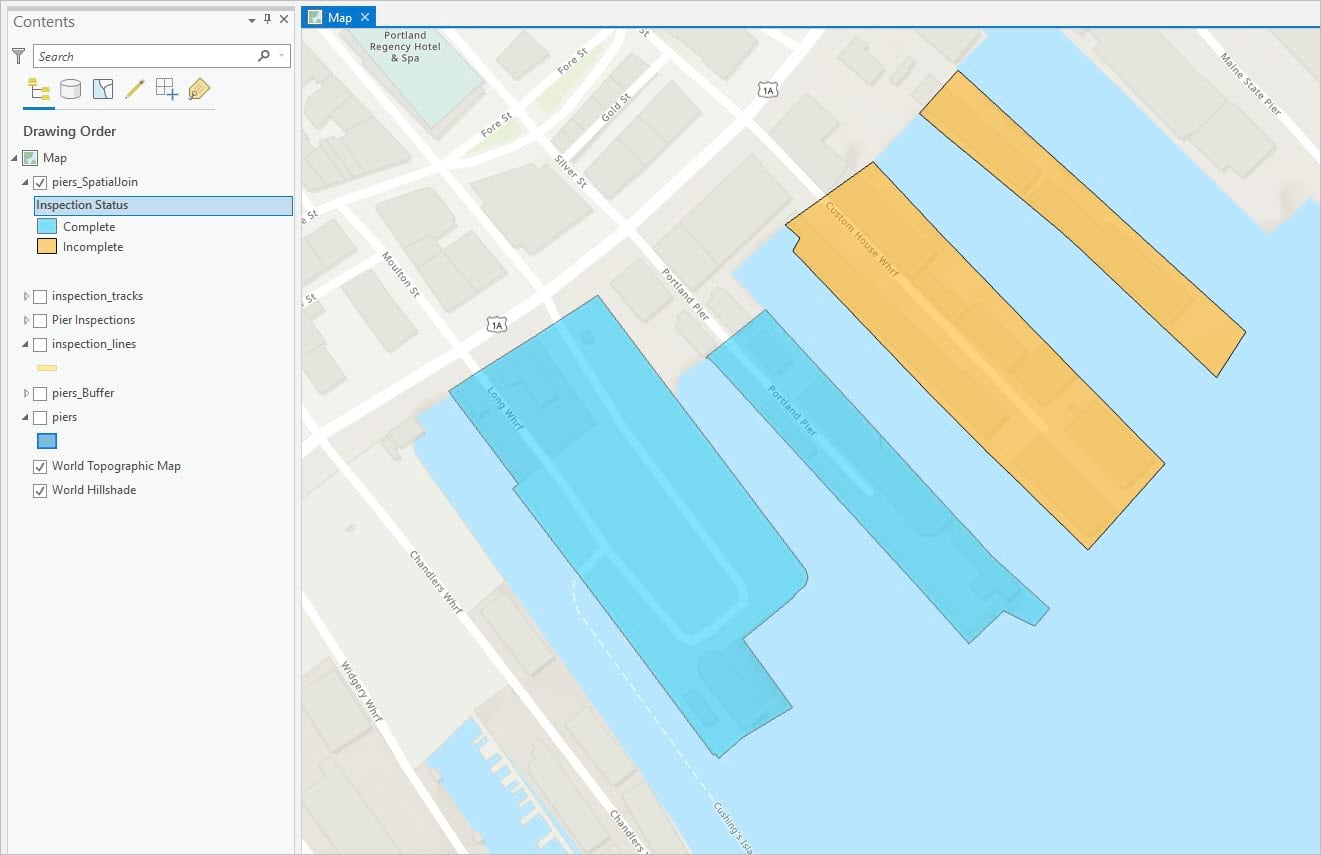
The inspection status field tells me that two of the inspections were completed according to the 70% guideline, and two were not. To present this information in a meaningful way, I’ll visualize the data on my map.
Visualize data
To illustrate the verification data on my map, I’m going to symbolize the piers spatial join feature layer and configure its labels.
Using symbology based on the inspection_status field, I’m going to make a pier feature blue if its inspection is complete and orange if it’s not.
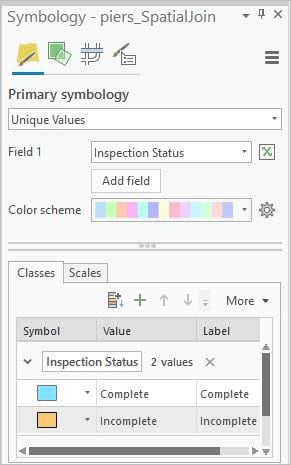
Here is what the map looks like with the applied symbology:
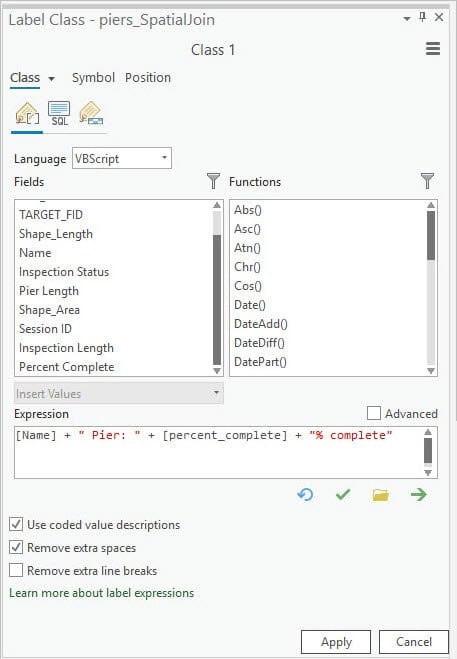
I’ll also configure the labels to show the percentage of completion for each pier inspection.
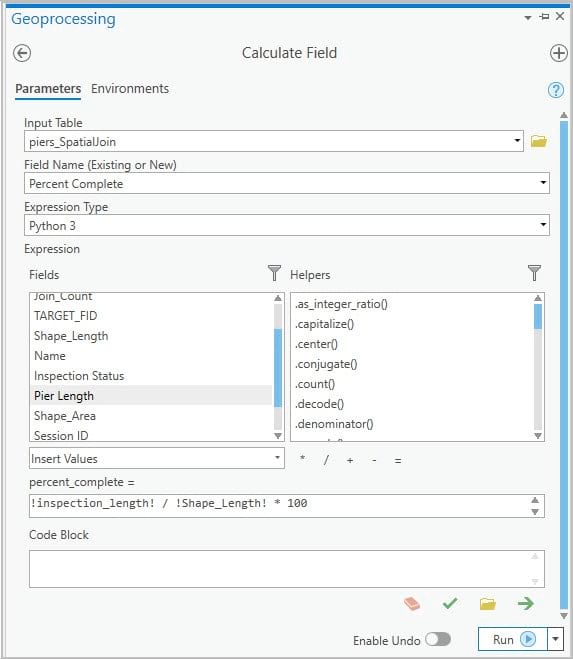
First, I’ll add a new field to the layer called percent_complete.

I’ll calculate this field to show what percentage of the pier perimeter was inspected by the mobile worker. I’ll use the following expression to do so:
!inspection_length! / !Shape_Length! * 100
Here’s what it looks like in the Calculate Field window:
I can now configure the label of this layer to display this new field.
I’ll use the following expression in the Configure Labels window to display the new field:
[Name] + “Pier: “ + [percent_complete] + “% percent complete”
I now have a map that displays all the data I need to verify the mobile worker’s pier inspections.
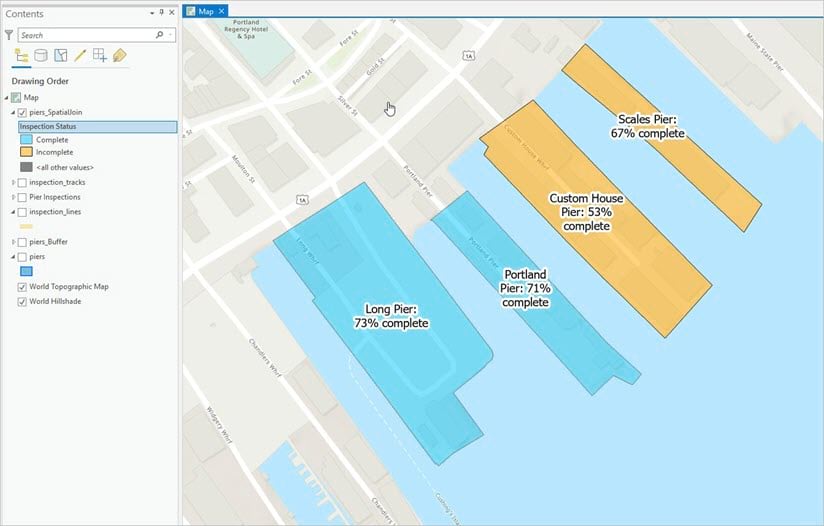
I can see that two of the inspections were completed according to the guidelines, and that two weren’t. I can also see that the Long and Portland piers, though completed, just barely pass the minimum inspection requirement.
This scenario illustrates just one way that location tracking data can be used to understand a worker’s performance in the field. I specifically focused on the session_id field to verify inspections, but the tracks feature layer contains a plethora of other data to work with. To see everything the location tracking schema has to offer, see Use tracks.

Hello,
Why did you use Buffer and Intersect tools instead of Intersect with 20 meters tolerance?
Why Points to Line tool was used instead of Make Tracking Layer or Track intervals to Line?
It would very much be appreciated if the entire series is converted into a tutorial and the sample data is also provided, cheers.