Location sharing is a powerful capability offered with ArcGIS Field Maps—allowing you to monitor mobile workers in real time and capture data about where they’ve been. You can use location sharing to:
- Monitor special events—Know where your personnel are during large scale events to ensure safety and provide quick response times.
- Provide proof of work—Verify on-site inspections completed by your team.
- Determine area coverage—Determine area coverage during events such as an invasive species removal or a search and rescue mission.
Mobile workers control when they share location, and administrators can view their tracks with the Track Viewer web app—or with other apps such as ArcGIS Dashboards or Map Viewer. In addition to location, the location sharing capability in Field Maps captures a variety of data that can be analyzed across ArcGIS.
Share location anywhere
Location sharing can be used anywhere, even in areas without an internet connection. Mobile workers can start sharing location using their mobile device or Apple Watch and can set a duration for how long location sharing is enabled.
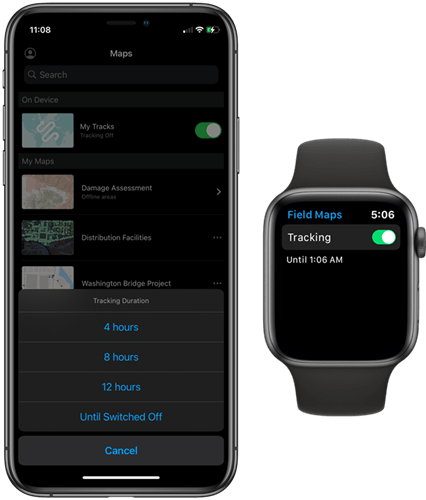
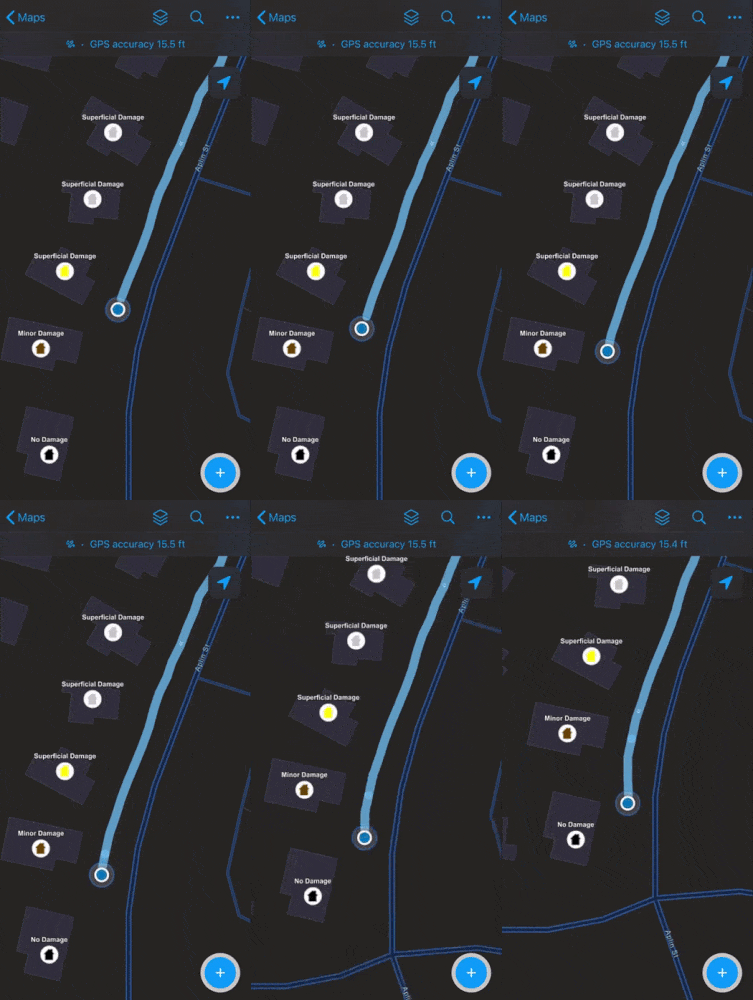
When location sharing is turned on, a bread crumb trail of tracks is recorded as mobile workers go about their day. Tracks are automatically uploaded to the location sharing service in your organization. Field Maps minimizes battery impact by optimizing the frequency of upload and by monitoring the motion of the mobile device.
In addition to using the Field Maps mobile app, mobile workers can use app links and Google Assistant to start sharing location and set a location sharing duration.
View tracks in Field Maps
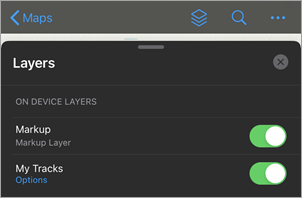
Mobile workers can access their tracks from any map in Field Maps. This is helpful for mobile workers who want to check the ground they’ve covered during a work session. Tracks appear as a layer that can be turned on and off. For more information, see Start sharing location.
View tracks in other apps
Administrators with the required privileges can view tracks in a variety of ways, such as with the Track Viewer web app, Map Viewer, and ArcGIS Dashboards. When you sign in to the Track Viewer web app, you can visualize the tracks of mobile workers by adding them to a track view.
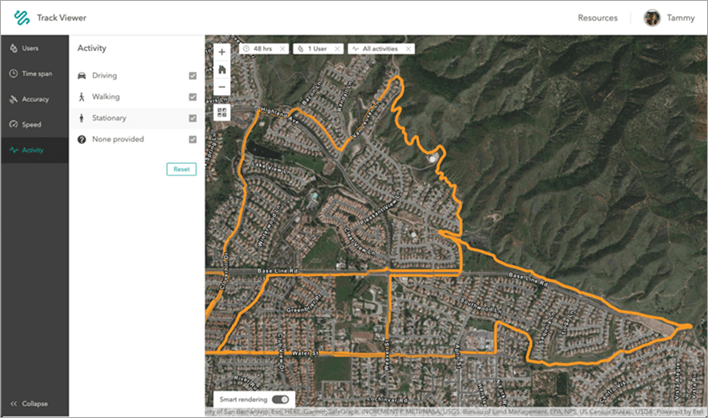
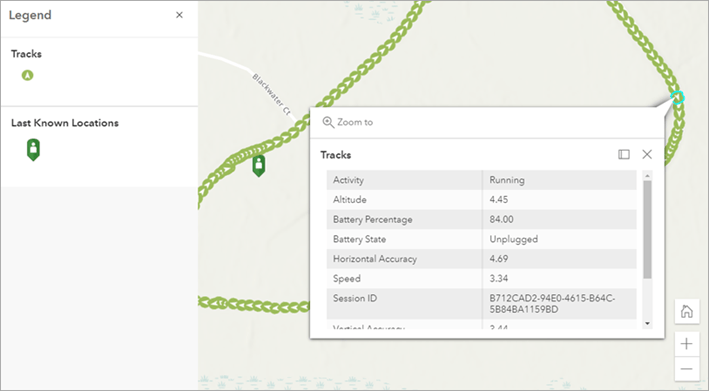
Track views appear as items in your organization and they each contain three layers:
- Tracks layer—A point layer that contains all points captured for a mobile worker. This appears as a bread crumb trail.
- Track lines layer—A polyline layer that contains lines representing where a mobile user has been.
- Last known locations (LKL) layer—A point layer that contains the last known location of mobile workers.
Track layers are dynamic, so they update when you add them to other maps or apps. Here’s what the layers look like when added to Map Viewer:
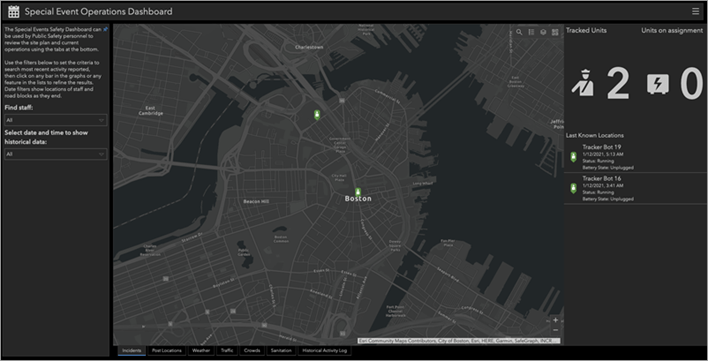
Add track data to ArcGIS Dashboards to monitor your operation in real time. The example below shows a dashboard for a special event, displaying the last known location for each mobile worker in the field.
Use track data
The Tracks, Track lines, and LKL layers contain a variety of data that can be analyzed to understand the movements and performance of mobile workers. Fields within these layers include altitude, speed, battery percentage of the mobile device, horizontal accuracy, and more. A complete list of fields can be found in Overview of the location tracking schema.
Here are a few examples of how you can use track data:
Verify inspections
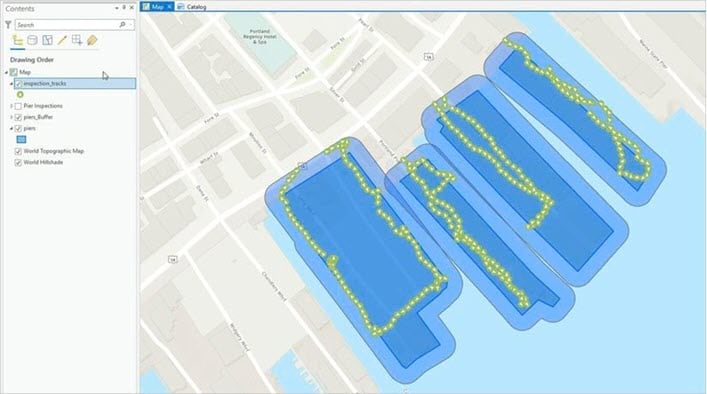
Use track data to verify inspections completed by mobile workers. The map below shows how track data can be used as proof of work for an inspection project. Learn how to verify inspections with track data .
Create a linear heatmap
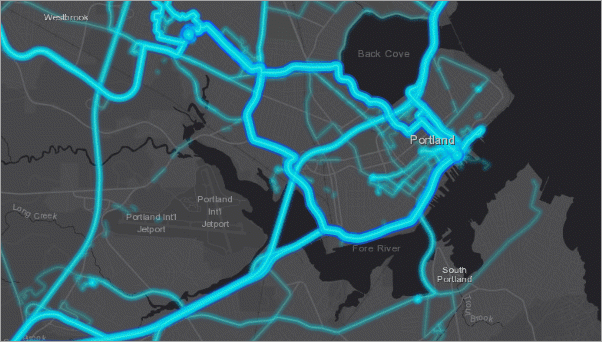
Show the most frequently traveled routes and hotspots of activity by creating a linear heatmap of track data. This allows you to understand the areas most visited by your mobile workforce. Learn how to create a heatmap with track data.
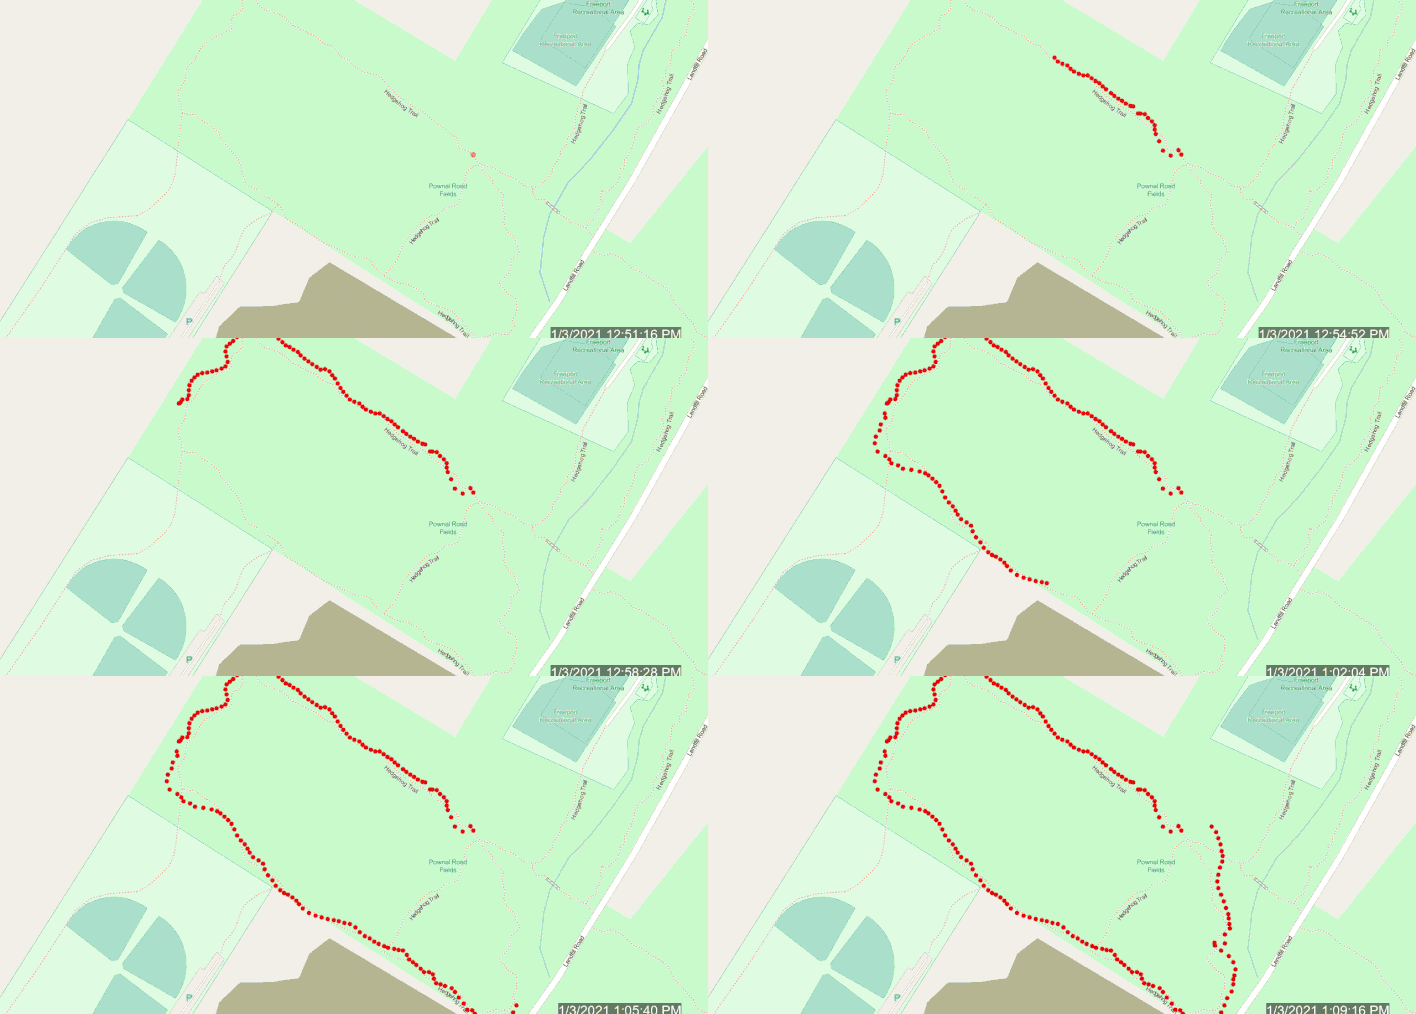
Create an animation
Visualize the patterns of mobile workers by creating an animation. Animations give you a full picture of the movements of mobile workers during a set time. Learn how to create an animation of track data.
Visualize aggregated track data
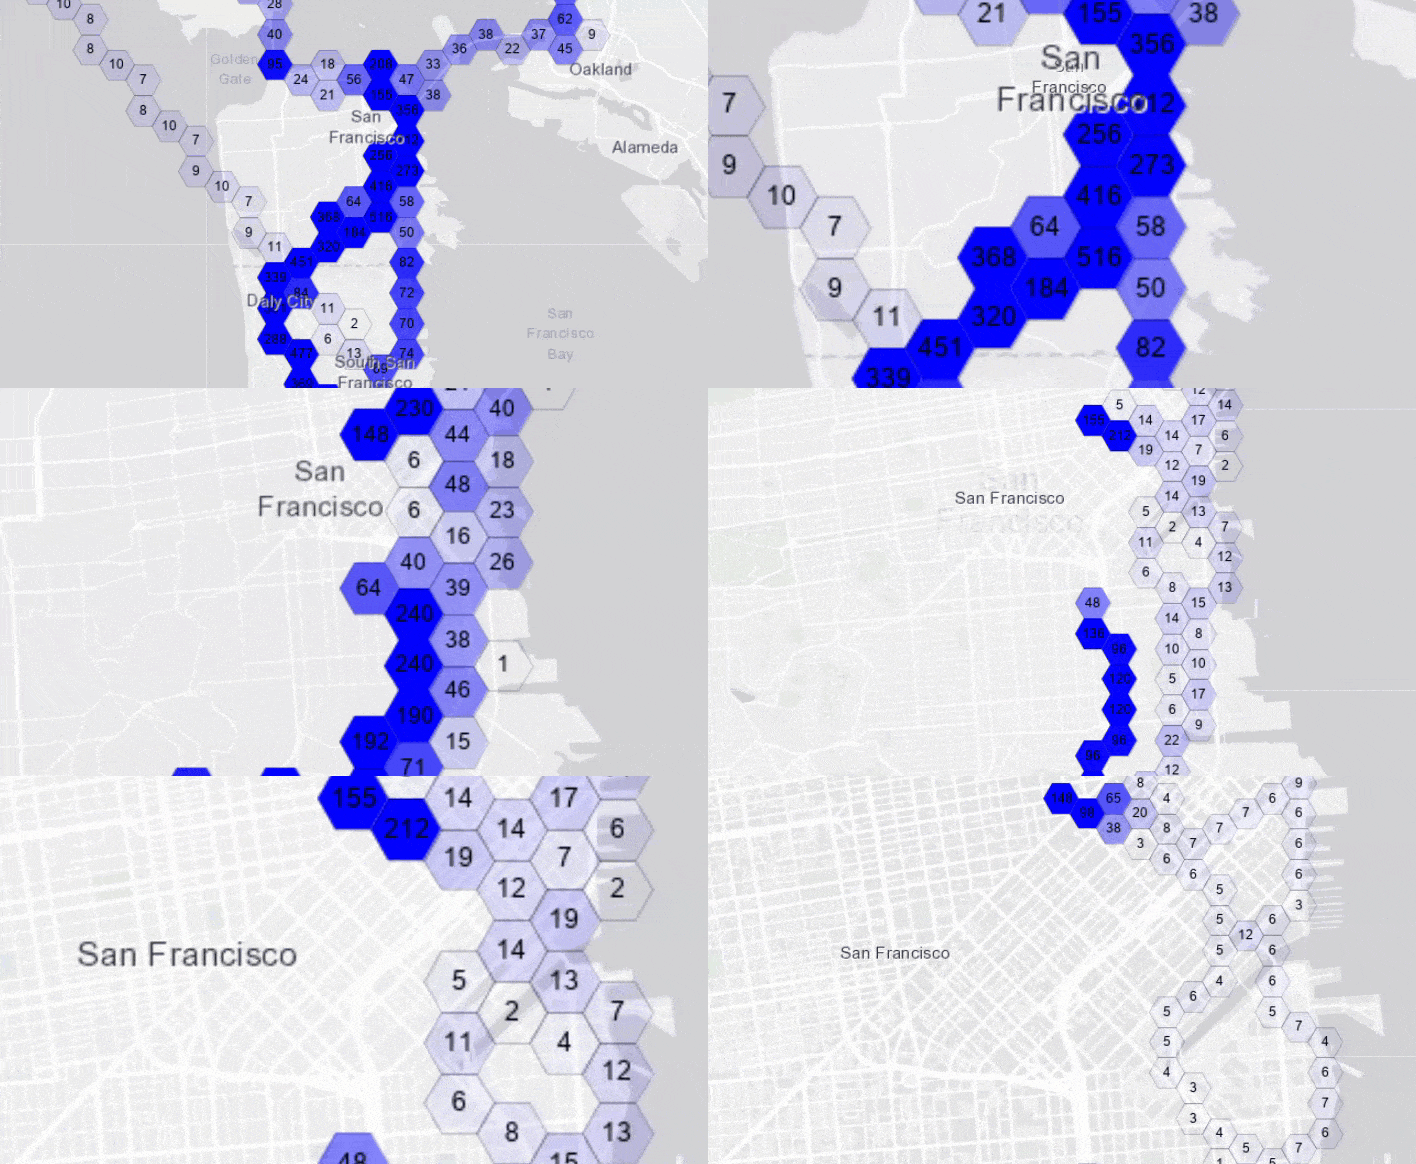
Convert noisy point data into clear bins that allow you to easily scan and determine where your mobile workforce has been. Visualize aggregated data based on track count or based on other location tracking fields such as horizontal accuracy or altitude. Learn how to visualize aggregated track data.
Additional resources
This is just an introduction of all the things can do with location sharing in Field Maps. To learn more, see the following resources:
- ArcGIS Field Maps: Location Sharing (YouTube video)
- Share location (help topic)
Have questions? Join the conversation in the ArcGIS Field Maps Community.



Article Discussion: