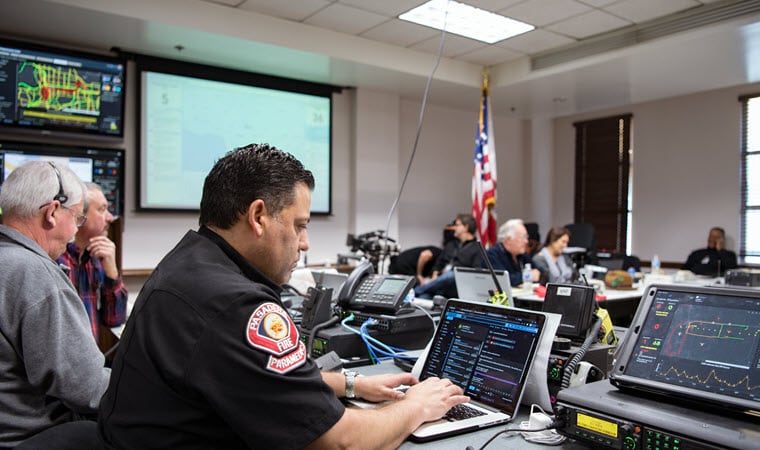
A few years ago, I marched in the Rose Parade as a member of my university’s marching band. I recall being impressed by how smoothly an event of such scale was running, but only now as a writer for the Field Apps team do I realize the technology and coordination that goes on behind the scenes (see the full Esri setup in this video).
Lots of planning goes into making sure that the event is a safe experience for everyone. Included in this effort is the use of location sharing dashboards to monitor the real-time locations of floats, staff members, and emergency service members involved with the parade. The dashboards are powered by ArcGIS Dashboards and display location sharing data captured in ArcGIS Field Maps.
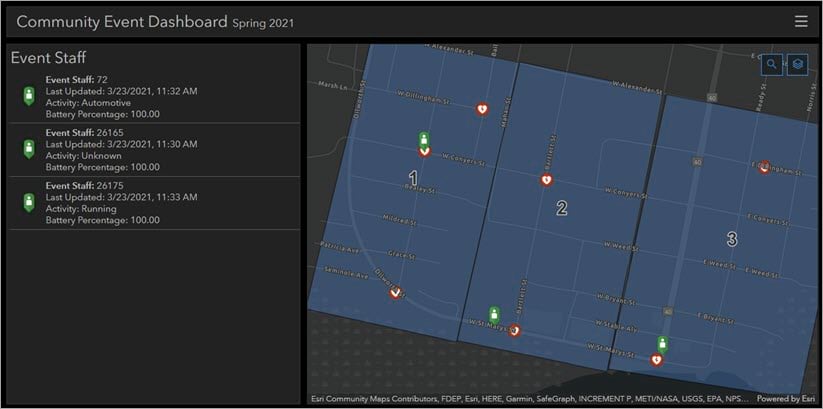
Today I’ll show you how to create a location sharing dashboard (shown below) that will have your event running with the same efficiency as one of the largest annual parades.
Create the track view
You’ll first create a track view that contains the users you want to track during the event. You can create a track view using the Track Viewer web app. When users you’ve added to the track view turn location sharing on in Field Maps, their location updates in the location sharing layers associated with the track view. See Share location for more information. Once you create a track view, you can add the location sharing layers to a map.
Prepare the map
Next, you’ll add the necessary layers to the map, configure the pop-up, set a refresh interval, and add a date filter.
Add last known locations to a map
The first layer you’ll add to the map is the last known locations layer (LKL). The LKL layer comes from the track view. When users within the track view turn location sharing on in Field Maps, their last known location updates every 60 seconds.
Browse to the My Groups tab in your ArcGIS organization and find the group that was created with your track view. Click the hosted feature layer within the group. The item page for your track view appears.
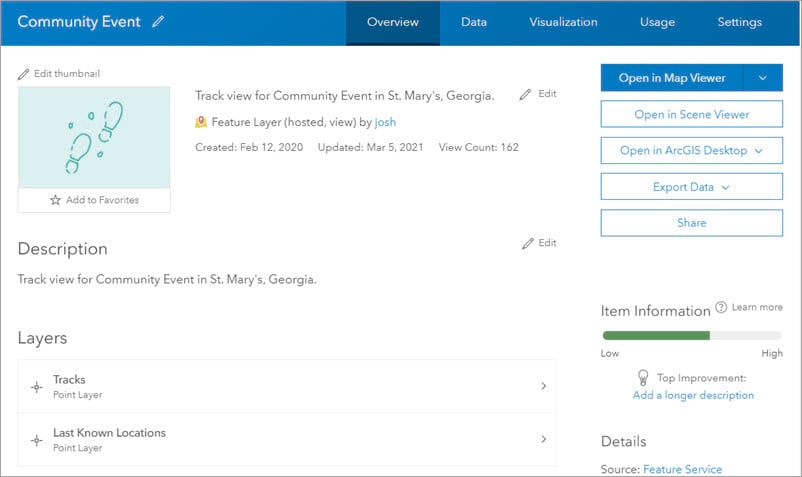
Click the Last Known Locations layer, and then click Open in Map Viewer.
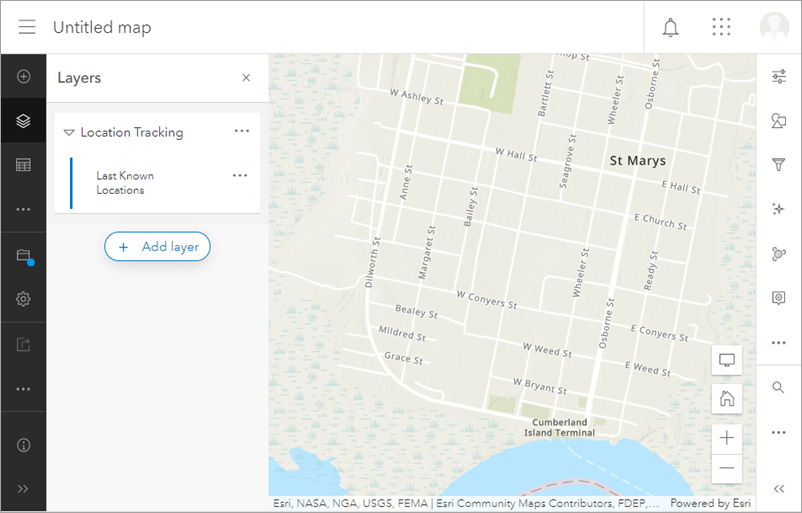
The LKL layer is added to a new map along with the Tracks and Track Lines layers. Since we only want the LKL layer, remove the additional location sharing layers.
Search for the location of the event so the default map extent for your dashboard is set. For this exercise, I’ll create a dashboard for a small community event in St. Marys, Georgia.
Configure the pop-up
Configure the pop-up for the LKL layer so you can view relevant information when you click a last known location in the dashboard. Select the Last Known Locations layer from the Layers pane and click Configure pop-ups from the Settings toolbar.
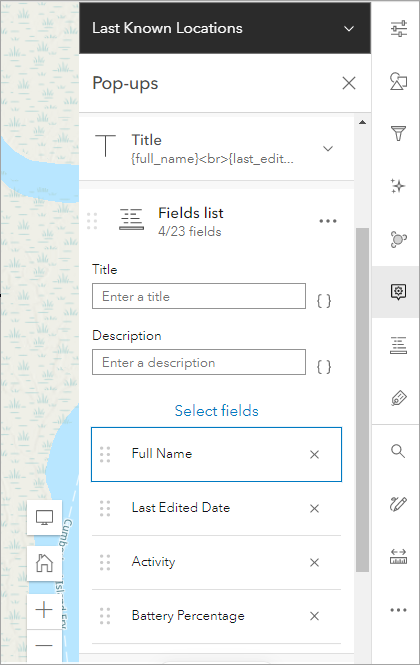
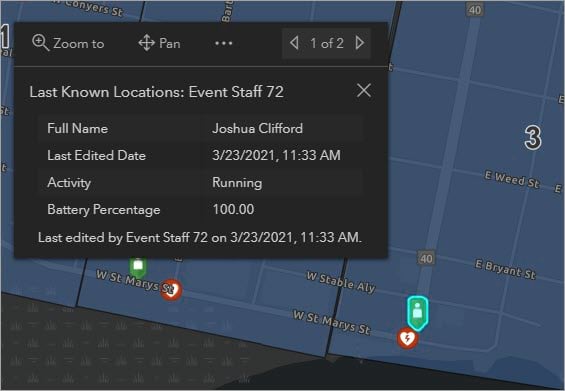
Under Fields list, customize the fields you want to appear in the LKL pop-up (shown above). You can learn about all the fields you can include in the overview of the location sharing schema. For this exercise, I’ll only display Full Name, Last Edited Date, Activity, and Battery Percentage. These are the fields I want to view in the pop-ups on my dashboard.
Add a filter
To maximize the effectiveness of the LKL layer, add a filter so only locations recorded in the last 8 hours are displayed. On the Settings toolbar, click Filter. In the Filter pane click +Add expression and add the following values:
- Field: Last Edited Date
- Operator: in the last
- Value: 8 hours
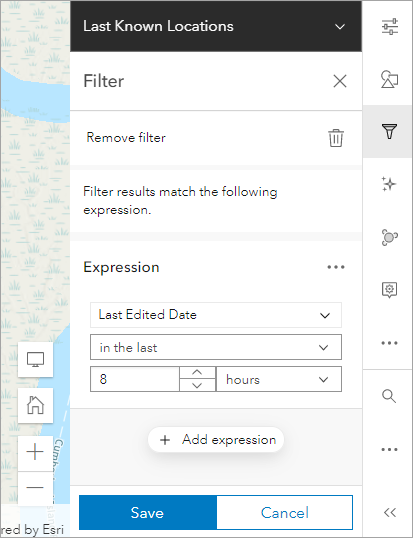
Click Save.
Set the refresh interval
The refresh interval is the rate at which the layer updates in your map and dashboard. The minimum recommended refresh interval for the LKL layer is 30 seconds. Click Properties on the Settings toolbar and scroll to the Refresh interval section. Click Automatically refresh layer and enter 0.5 next to minute(s).
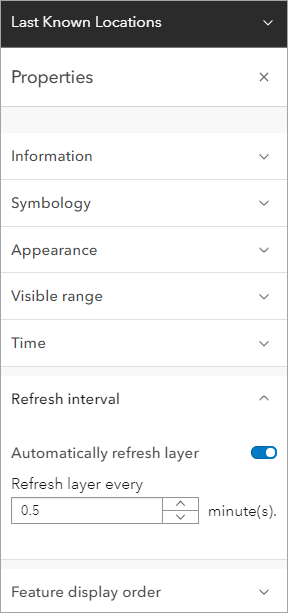
Now when I use the dashboard during my event, the last known locations of event staff will update every 30 seconds.
Add additional layers
Add any additional layers that are important when monitoring your event. For this example, I’ll add a layer of first aid stations so I know their proximity to staff members in case of an emergency. I’ll then add a layer of zones that can be used to communicate the different areas of event activity. See Add layers to maps for more information. I’ll also change the basemap to provide more color contrast for the features.
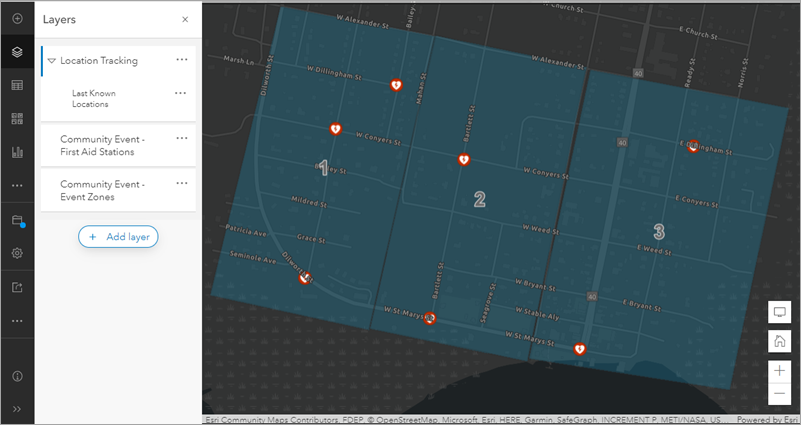
Once you have all the layers added, save your map by clicking Save from the Contents toolbar. Add a title, summary, some tags, and click Save map.
Enable searching for mobile workers
Enable search so dispatchers can search for mobile workers when viewing the dashboard. Go to the map’s item page and click the Settings tab. Scroll down to Application Settings, and under Find Locations, select By Layer.
Select the following for each text box:
- Last Known Locations Layer
- Created User
- Contains
Update the Hint text to say Search for mobile workers, and click Save.
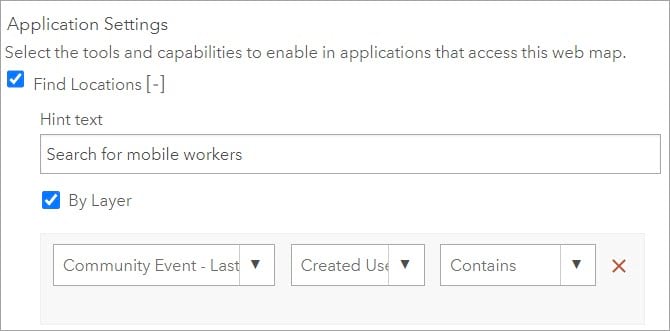
Now dispatchers can search for mobile workers when viewing the dashboard.
Create a dashboard
Create a dashboard based on the map and add elements that will help you monitor activity during your event. While viewing the map in Map Viewer, click Create app from the Contents toolbar and click Dashboards.
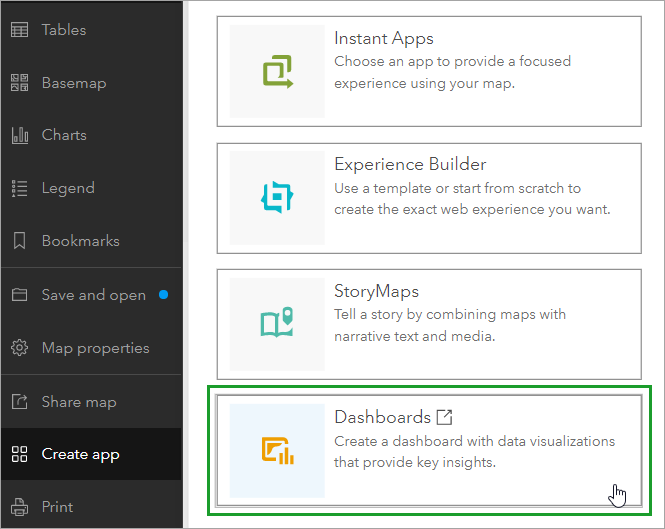
The Create a new dashboard window opens. Provide a title, some tags, and a summary for your dashboard and click Done. The new dashboard opens.
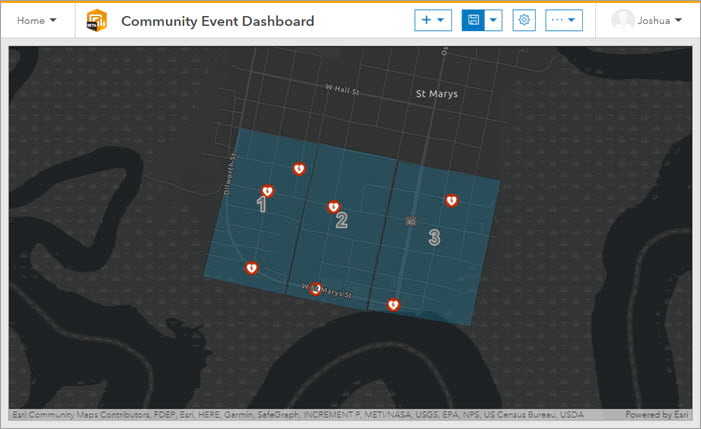
On the map element, click Configure. On the Settings tab, enable Search and Layer Visibility. This allows administrators to search the map and switch layers while viewing the dashboard. Click Done.
Add elements
Next, you’ll add elements to the dashboard that will provide information about worker activity during the event.
You’ll add a list that displays each mobile worker. Click Add and select List. In the List window, select the Last Known Locations layer.
Click the Actions tab. You’ll add two actions that cause the map to zoom to and highlight (flash) a last known location when you click it in the list. Click the Add action drop down menu and select Zoom. Click Add target and click your map. Repeat this with the Flash action.
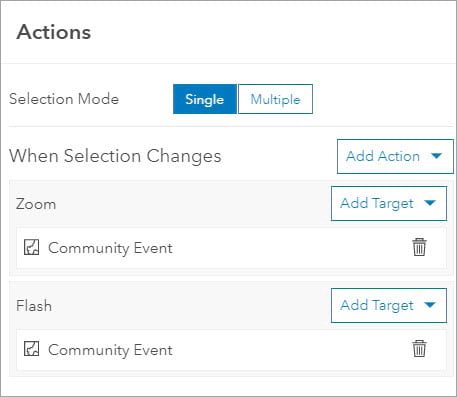
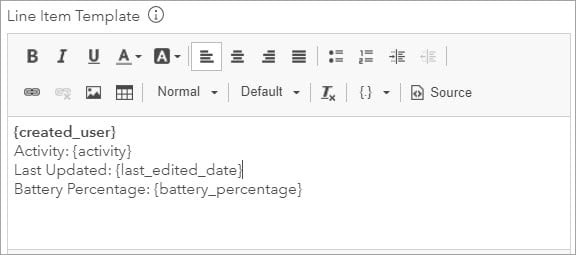
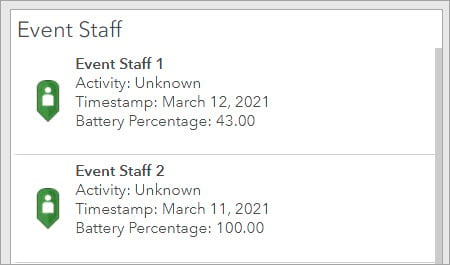
On the List tab, customize the information that will display next to each last known location. You can use fields within the layer to add information to the list. I’m adding the activity, last_edited_date, and battery_percentage fields (as shown below).
From the General tab, click Done. The list element is added to your dashboard.
Finally, we’ll add a title. Click Add and click Header. The header title automatically defaults to the dashboard title, but you can change this. Customize the title, subtitle, and other header configurations according to your preferences. Click Done, and the header is added to your dashboard.

From here, you can continue to customize the elements and theme of your dashboard in a way that makes sense for your organization’s event. Shown below is the final location sharing dashboard I created for a small-scale event in St. Marys, Georgia.

The dashboard displays a header, a list of event staff, and the community event map. You can view the last known location for each staff member and click any LKL feature to view the pop-up you configured (shown below).
Now, if an incident occurs, I’ll know exactly where staff members are and how close they are to the nearest first aid station. Location sharing dashboards can provide you with the same level of safety and assurance—whether you’re running a community event or a festival as big as the Rose Parade.
This blog post was originally published on April 14th, 2021 and has been updated.


Great article. I now have something similar for my organization related to remote work planning. Is there a way to add the last known location coordinates to the dashboard list object? The coordinate attributes don’t appear in the feature layer surprisingly..