Infrastructure development projects can significantly alter the landscape. A side-by-side comparison of digital elevation models before and after a project can provide helpful insights into the environmental transformations that have occurred.
What if you could overlay multiple profiles to visualize the differences in elevation?
You can represent elevation data for geographic areas using the Elevation Profile widget in ArcGIS Experience Builder. With the November 2024 update of ArcGIS Online, you can now overlay profiles from multiple elevation layers to compare topographic changes.
In the Hong Kong International Airport Expansion Project app below, you can visualize the ground elevation variations before and after the expansion of the Hong Kong International Airport (HKIA) – also commonly known as Chek Lap Kok.
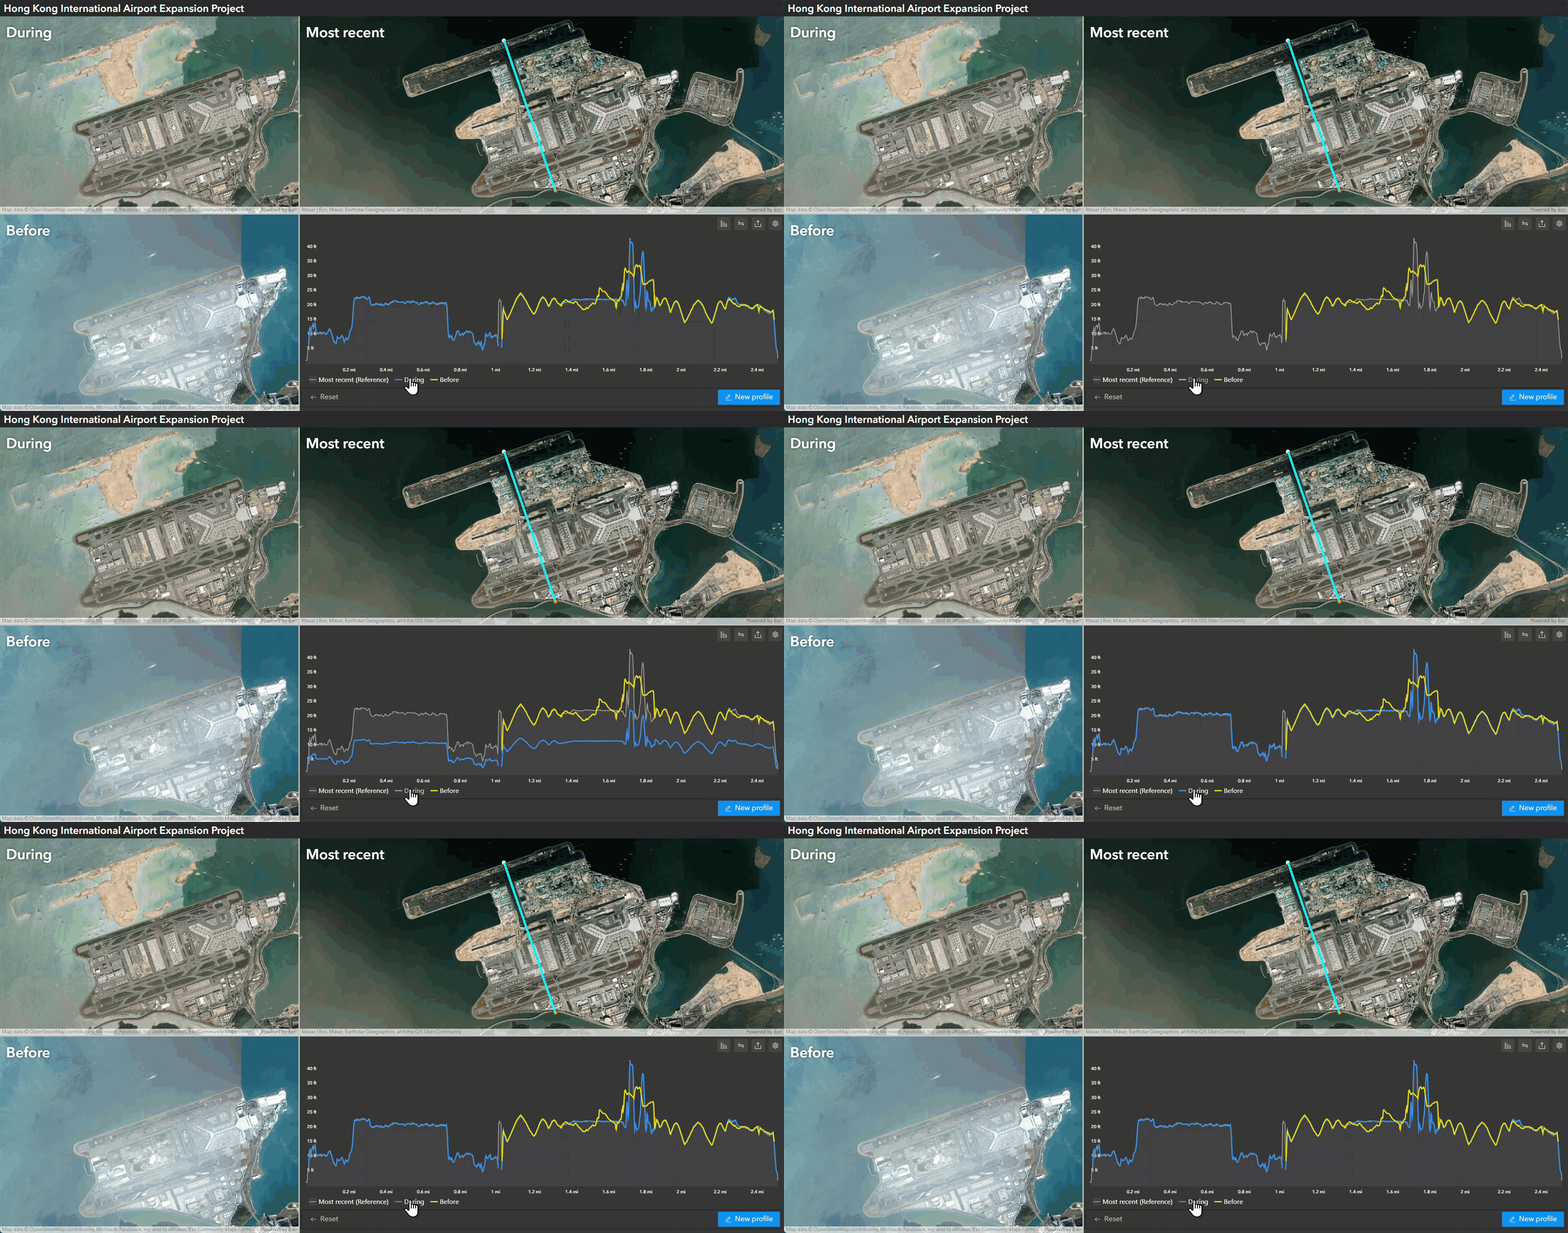
The airport’s third runway was constructed on land mainly reclaimed from the sea north of the existing airport island. You can easily see the differences before, during, and after the project by comparing imagery data from Wayback for 2014, 2020 and 2024.

Digital terrain models are also available for Hong Kong for the years 2010 and 2020, along with more recent data from the Terrain 3D World Elevation service.
How to add multiple elevation layers to your app
Follow the steps below to create a basic elevation profile viewer app with multiple elevation layers using the Elevation Profile widget in Experience Builder.
Feel free to further customize the layout, themes, and content for your own app. You’ll need an ArcGIS organizational account with privileges to create content.
Create a new app
Use a template to get started configuring the Elevation Profile widget more quickly:
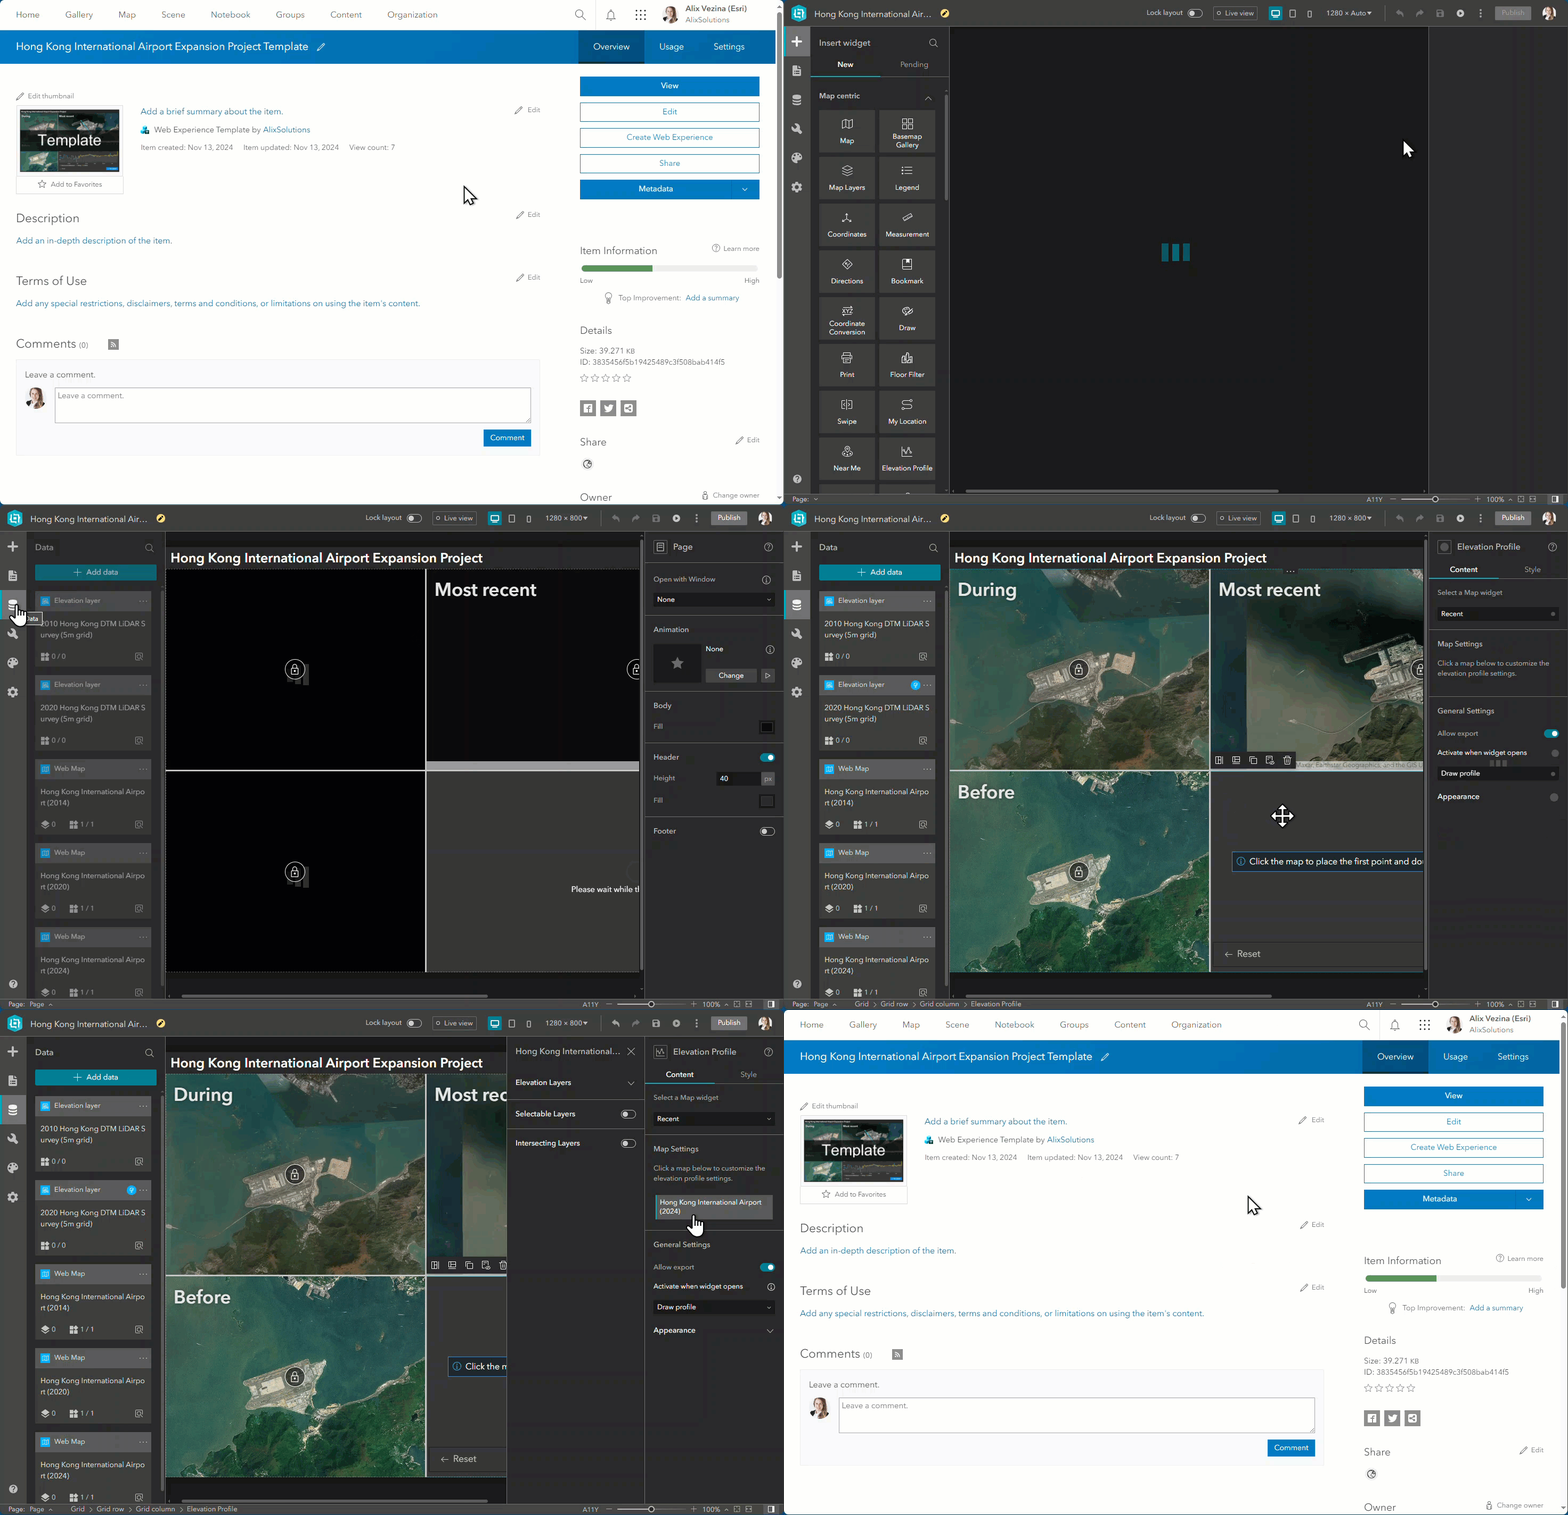
1 – Go to Hong Kong International Airport Expansion Project Template, ensure you’re signed into ArcGIS Online, and click Create Web Experience.
You’ll find three web maps and two elevation layers already added as data sources to this template.
2 – Click the Elevation Profile widget on the page to open the settings pane on the right.
The Elevation Profile widget is connected to the Map widget with the most recent imagery.
3 – Under Map Settings, click Hong Kong International Airport (2024).
Add elevation layers
1 – In the side panel, expand the Elevation Layers section and click New layer.
2 – Select the 2020 Hong Kong DTM elevation layer and update the Label.
3 – Customize the Style to define the display of this profile in the graph.
4 – Enable Show profile statistics to get statistics for this layer and click OK.
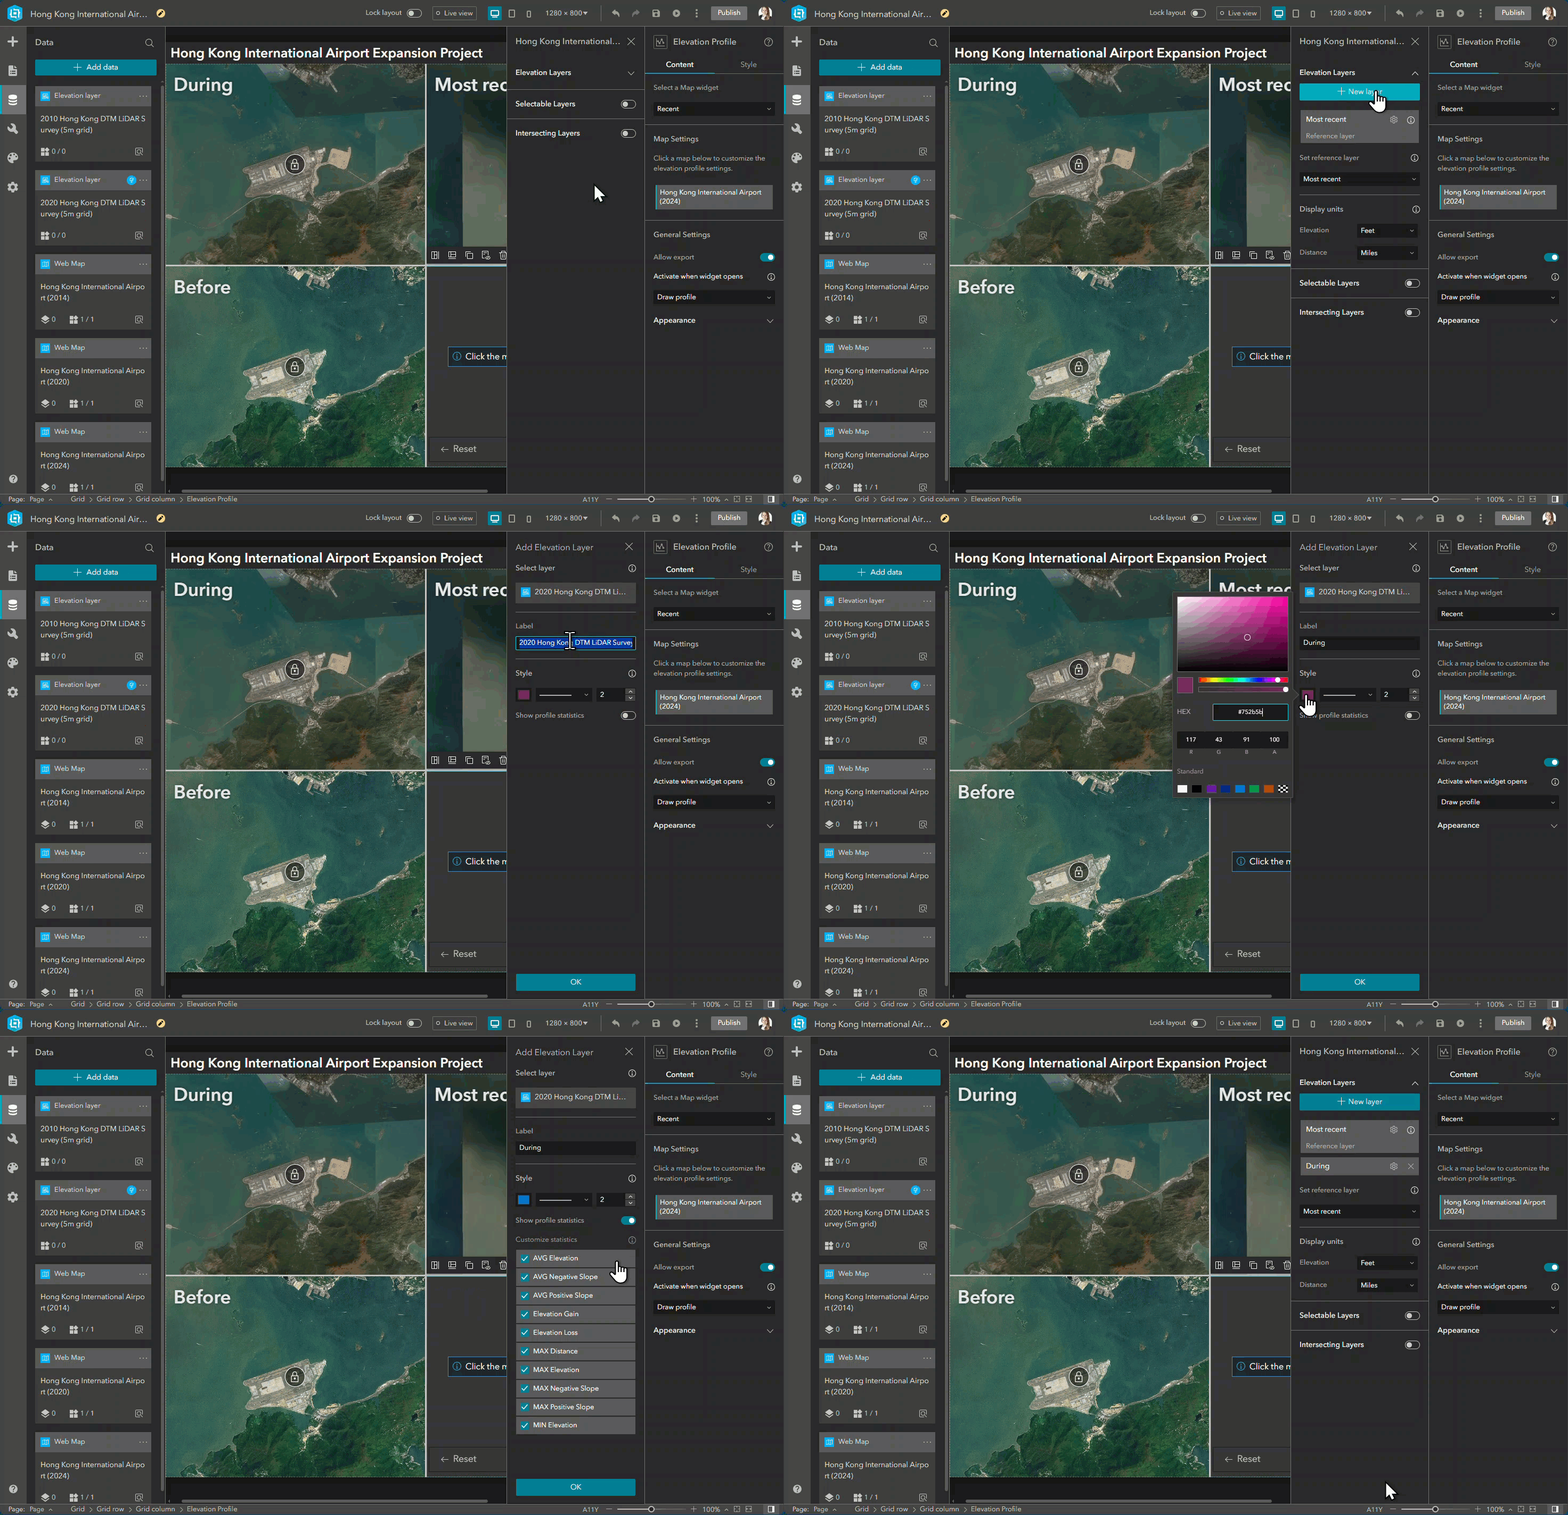
5 – Repeat steps 1 to 4 to add the 2010 Hong Kong DTM elevation layer.
You’ll be able to view and compare statistics such as slope, maximum and minimum elevation, and elevation loss and gain for each elevation layer. Statistics are calculated dynamically every time the elevation profile is updated.
Visualize the topographic changes
1 – Save your app and click Preview to launch it in a new tab.
2 – Draw a north-south line across the airport on the Most recent map to obtain profiles where land exists along the segment.

Eager to explore more elevation data using the Elevation Profile widget? Publish your own Elevation layers or browse ArcGIS Online for more layers and add them to your apps!


Article Discussion: