Many new features are introduced in this ArcGIS Experience Builder release to help users build no code and low code GIS web experiences much easier. These features include two widgets—Elevation Profile widget and Suitability Modeler widget. Other highly anticipated capabilities are support for an experience’s URL displaying page, view, and window labels instead of their original ID numbers, editing fields with conditional visibility from the form in the map, and pie charts. Let’s explore.
Elevation Profile
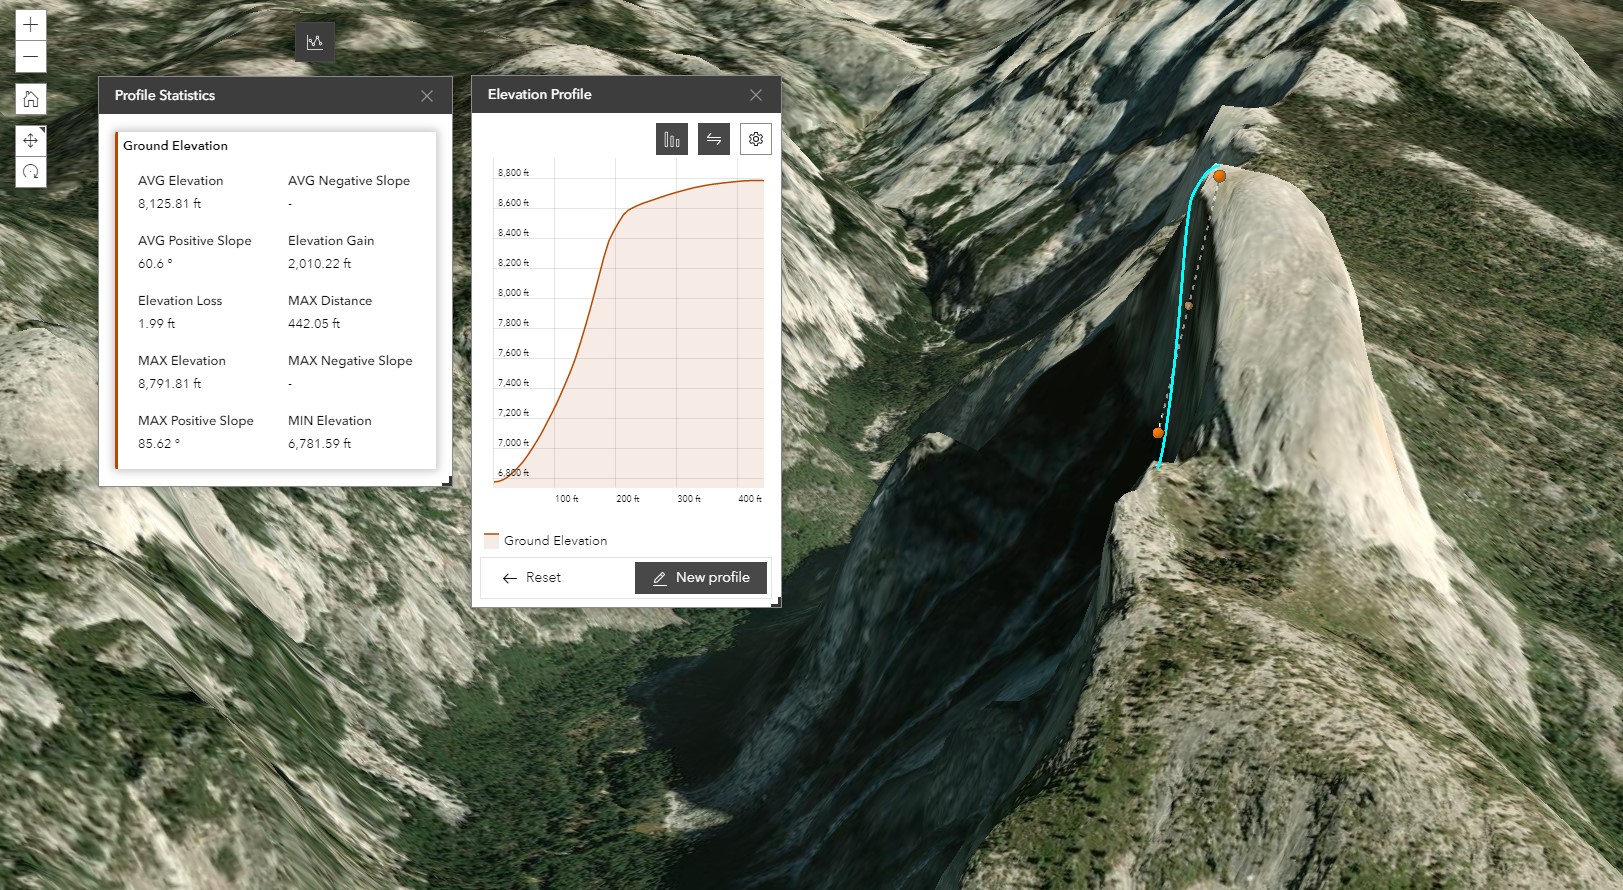
The Elevation Profile widget displays an elevation profile from an input path by drawing on the map or selecting single- or multi-segment lines from layers on the map. The image below shows that the vertical elevation for Half Dome (Yosemite National Park) is collected by drawing a line along its northwest face in a web scene. An elevation graph is provided alongside statistics for the slope, the maximum and minimum elevation, the elevation loss and gain, etc.
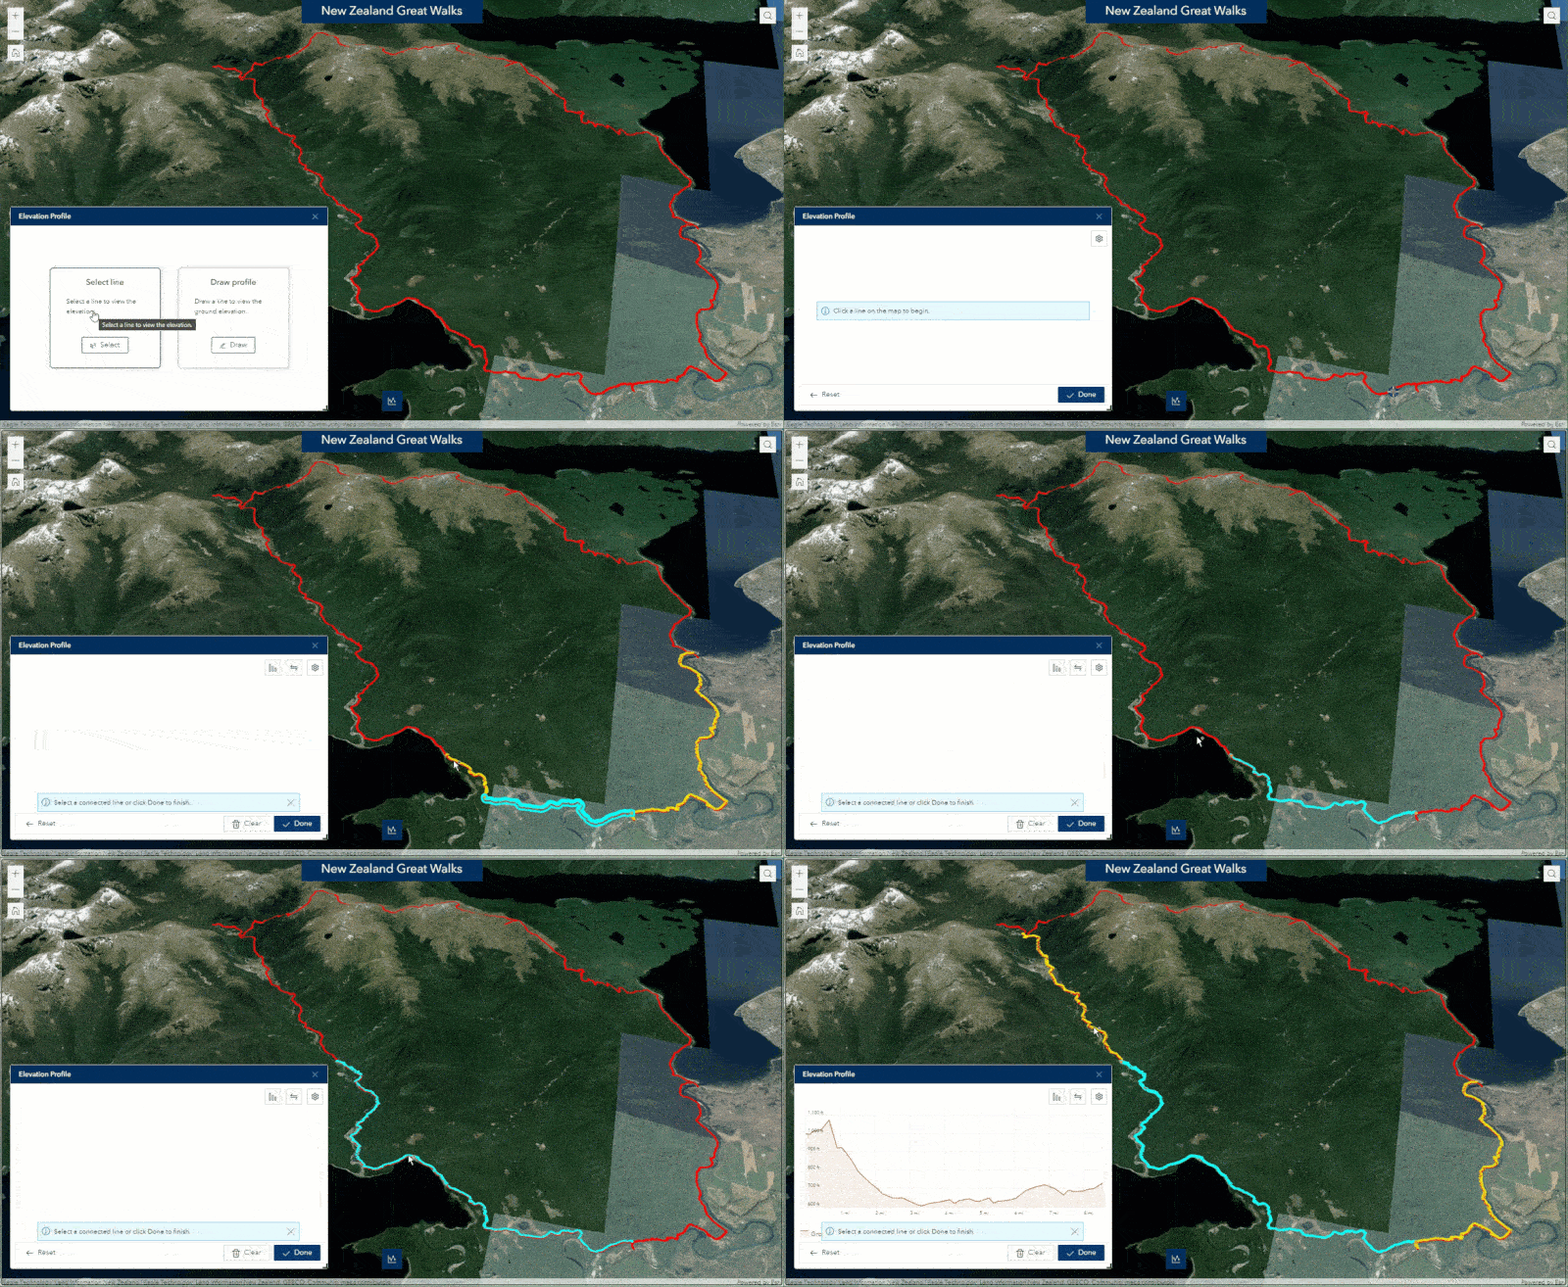
If you already have a map with hiking trails, for instance, simply select line segments one by one to get the trail profile as shown below. Note that additional connected segments are highlighted and can be selected to create your path.
Sometimes, you may want to select lines to get their profile relative to the ground using values from elevation fields in the layer. Take the map with pipelines below as an example.
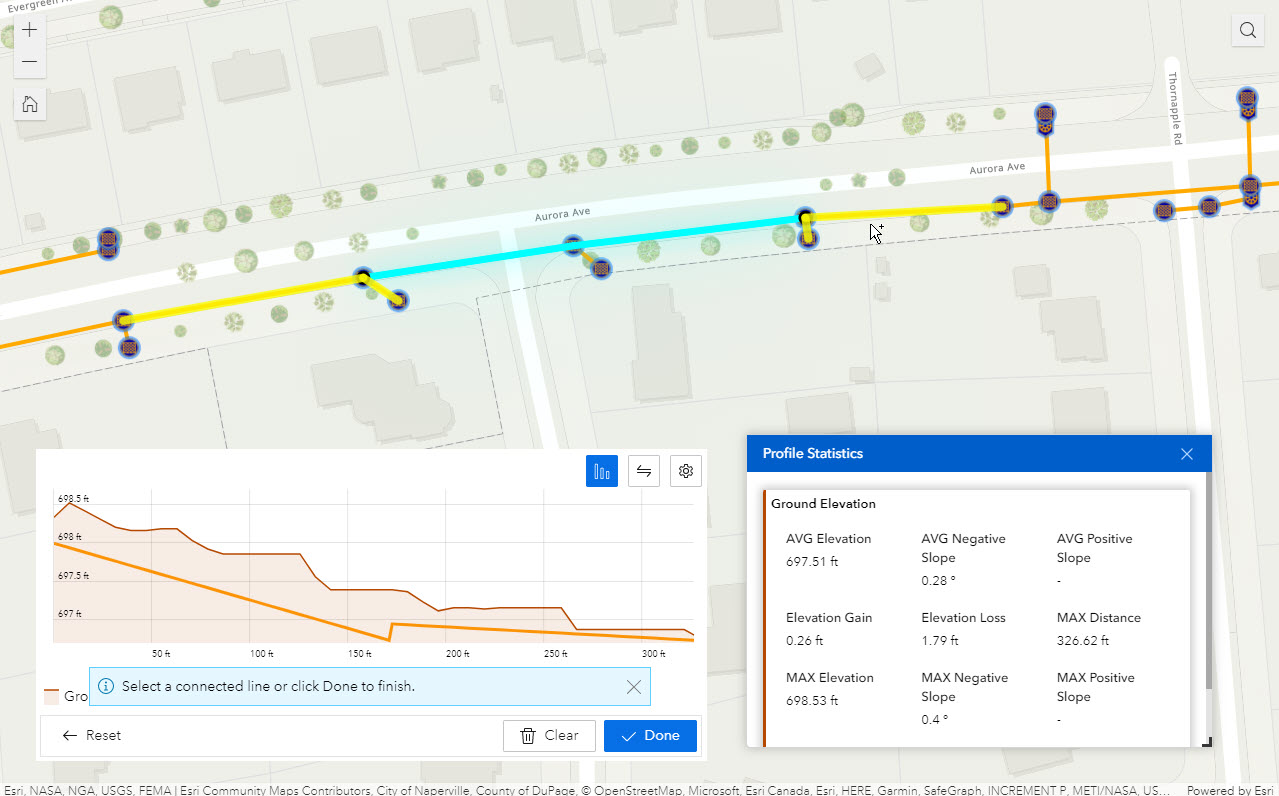
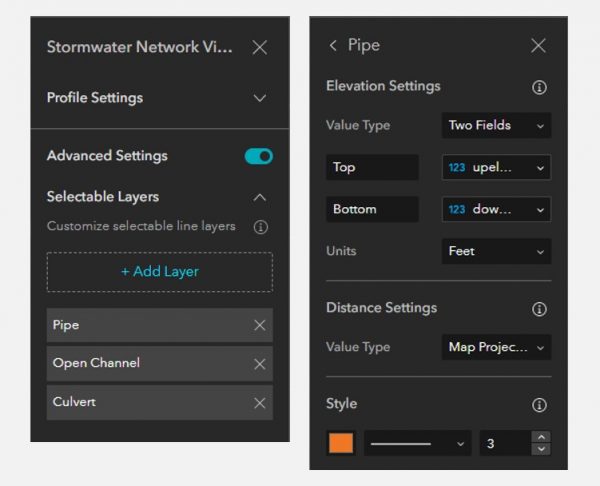
To do so, enable the Advanced Settings option and choose an elevation value type. For these pipelines, two fields are used to define the top and bottom elevations for each pipe. As a result, two profile lines are drawn on the graph—one for ground and one for the selected line features.
Suitability Modeler
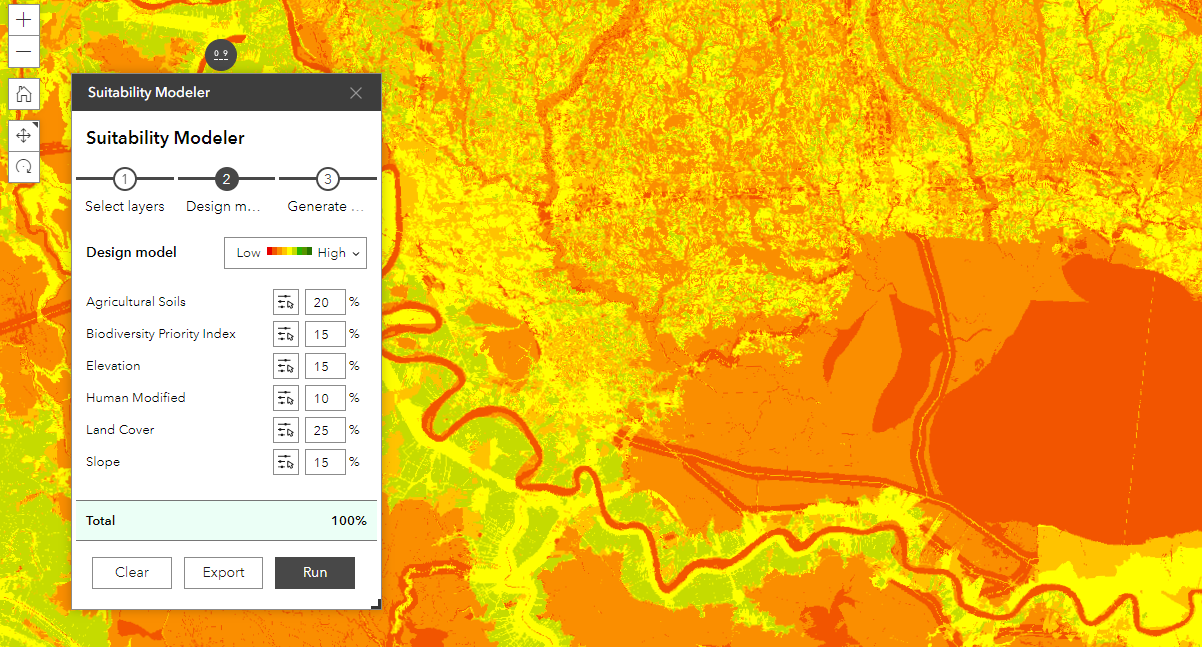
To enhance your GIS web experience, we have added the Suitability Modeler widget. This widget combines and weighs different layers so users can evaluate multiple factors at once. For example, it may help answer questions such as a) where are the greatest risks for insect damage? or b) where are the best locations for a commercial development?
To use the widget, follow the three-step guide within the widget. For more information about publishing data for weighted overlay, see the ArcGIS GeoPlanner documentation.
Major Enhancements
An experience’s URL
To help users navigate the page, view, and window in a meaningful way, an experience’s URL now displays labels instead of original ID numbers. In the URL example below, “Enhancements” is the page name (label), and “Search” is the view name (label).
https://experiencedev.arcgis.com/experience/420a0ac079884efbbaf3435750f40f6d/page/Enhancements/?views=Search
More importantly, when you update their labels, the app’s URL changes accordingly, but existing published URLs prior to this release will continue to work even after you modify and republish the app. If you have shared the links to your web experience, these links should not be broken.
Edit
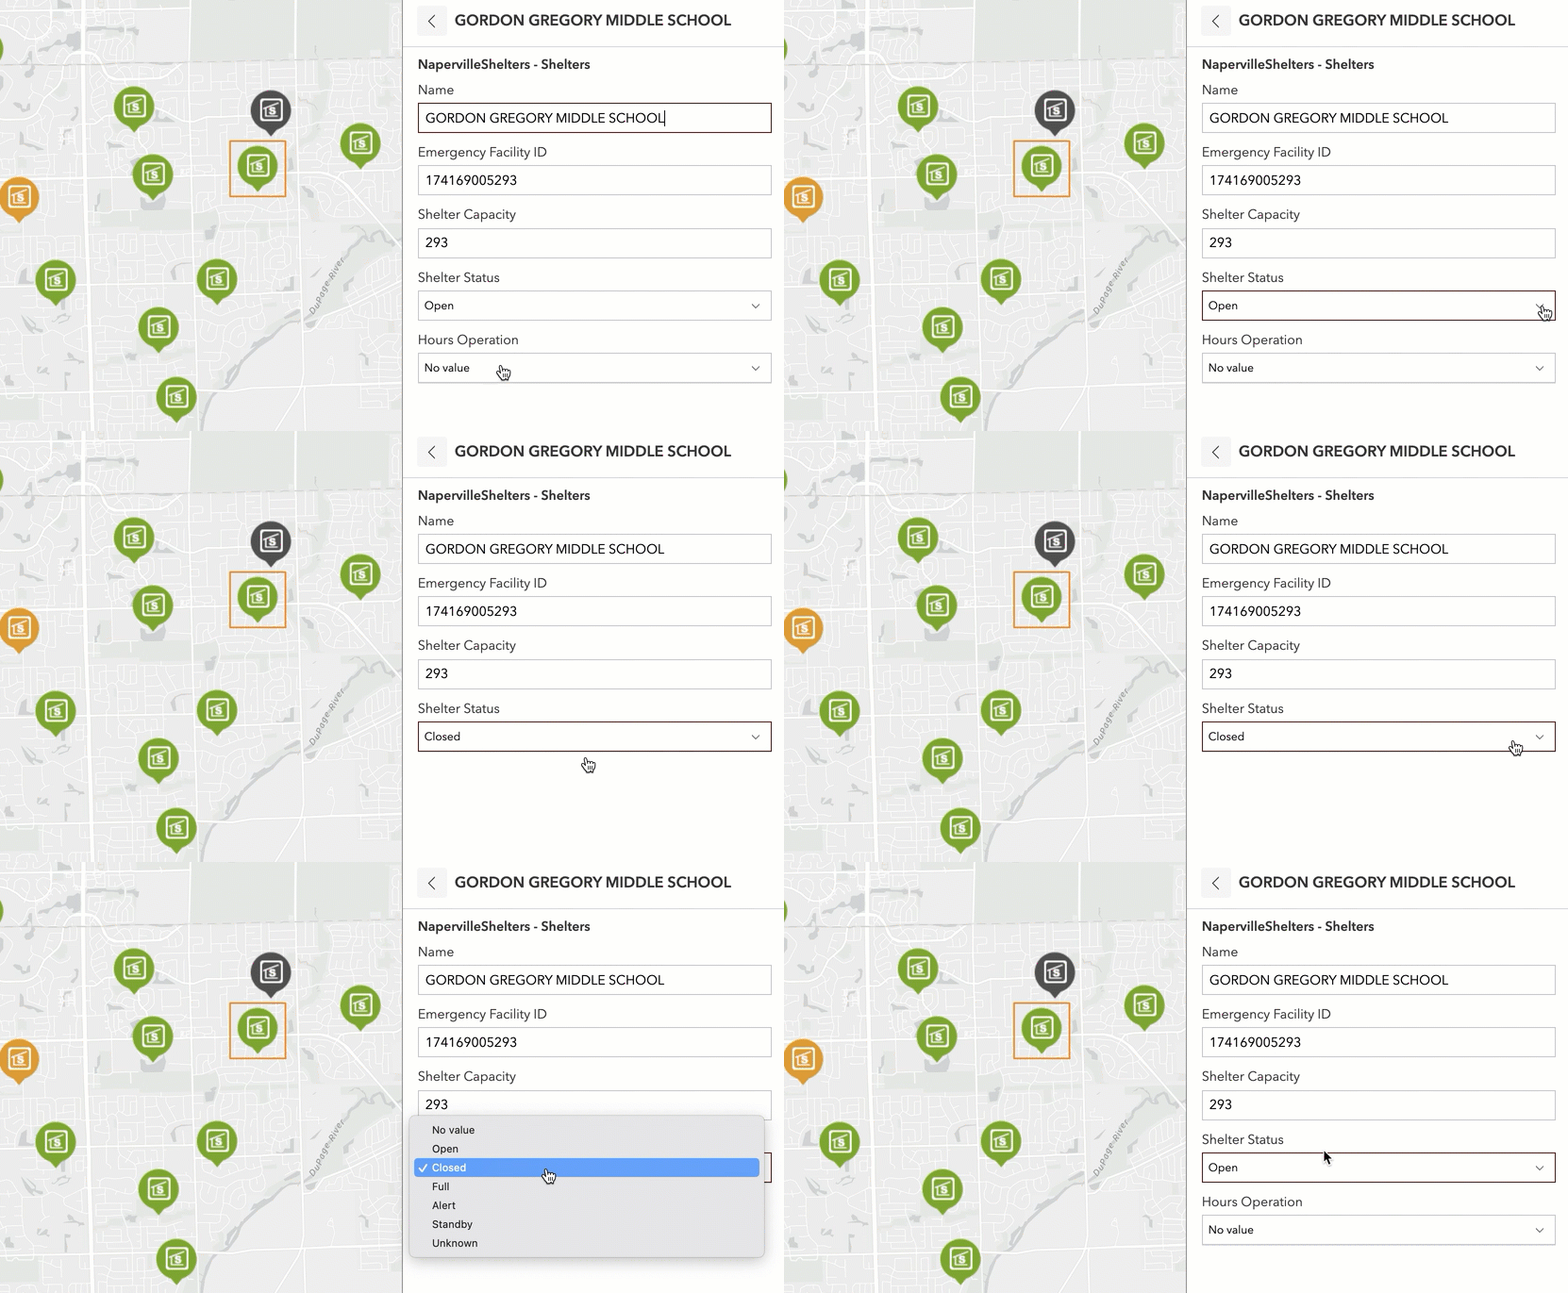
The smart form editing experience is now available in the Edit widget. With the “Using webmap settings” option, the widget honors the form with conditional visibility for fields in the map created using Field Maps or Map Viewer.
Chart
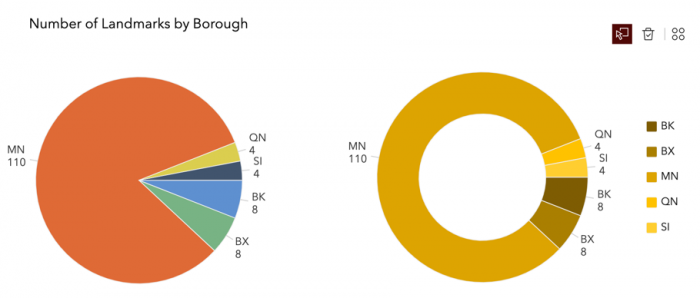
In addition to Bar and Line, the Pie chart is now available in two styles—Pie and Donut.
Search
In the previous release, the Search widget allows you to search the map on the other page, but you can only zoom or pan to the places on the map automatically with the locator source. In this release, the Data filtering changes message has been added so you can configure the map widget to listen to this message, then take actions to automatically zoom or pan to resultant features from the layer.
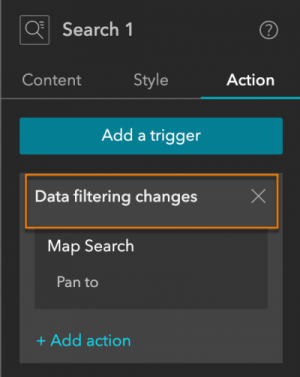
Keep in mind that when you add the widget, it automatically uses your organization’s locators.
Image
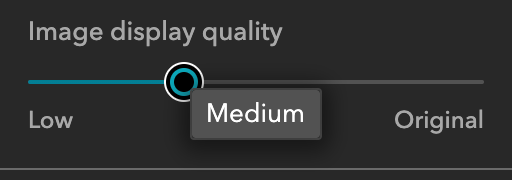
For image loading experiences, two areas have been improved. First, you can optimize the loading performance by choosing from four levels of display quality: low, medium, high, and original. Second, as images load at runtime, a compressed version of each image, instead of the standard image placeholder, is provided as a loading mask until the images fully load.
Query
You can now add descriptions for spatial and attribute filters for a specific audience. When they click the information icon, instructions tailored to them are provided.

Table
Tables now automatically honor field names from the layer’s pop-up settings.
Menu
With this release, you can also change the default icon for a folder or link on the page panel in addition to a page. As a result, enabling the Show icon option in the Menu widget will display these custom icons.

Templates
To help users easily find the right template to start with, default templates are now divided into six categories as shown below. Note that some templates are in multiple categories, such as Monitor included in Map centric and Dashboard.

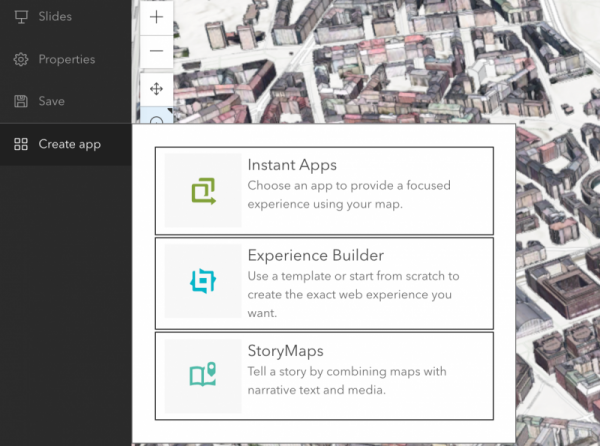
Lastly, like Map Viewer, you can create an experience with an auto-populated scene directly from Scene Viewer.
For more information as to how you can apply these updates to your web experiences, see What’s new in Experience Builder. Additionally, please reach out to experiencebuilder@esri.com for questions.
Thank you,
The ArcGIS Experience Builder team


Article Discussion: