Self-Response
As of July 13th, nearly 62% of US households have filled out their Census 2020 forms. Over 49% of those responses were made online. While off to a good start, this means there are still over 47 million households that have not yet responded. Every community is a stakeholder in getting an accurate count of their population for 2020. Around $675 billion dollars are distributed each year based on data collected from the decennial census. Numerous Complete Count Committees, outreach groups, and local jurisdictions are working tirelessly to ensure their communities are counted “once, only once, and in the right place” for the 2020 count.
To help aid in these efforts Esri is hosting six layers, updated daily from the Census API with Census 2020 Self-Response Rates in preliminary Census 2020 geography:
- States
- Congressional Districts 116th (CD)
- Counties
- Tracts
- Places
- American Indian Areas (AIA)
Access the Feature Service here
Explore Self-Response Rates in this application:
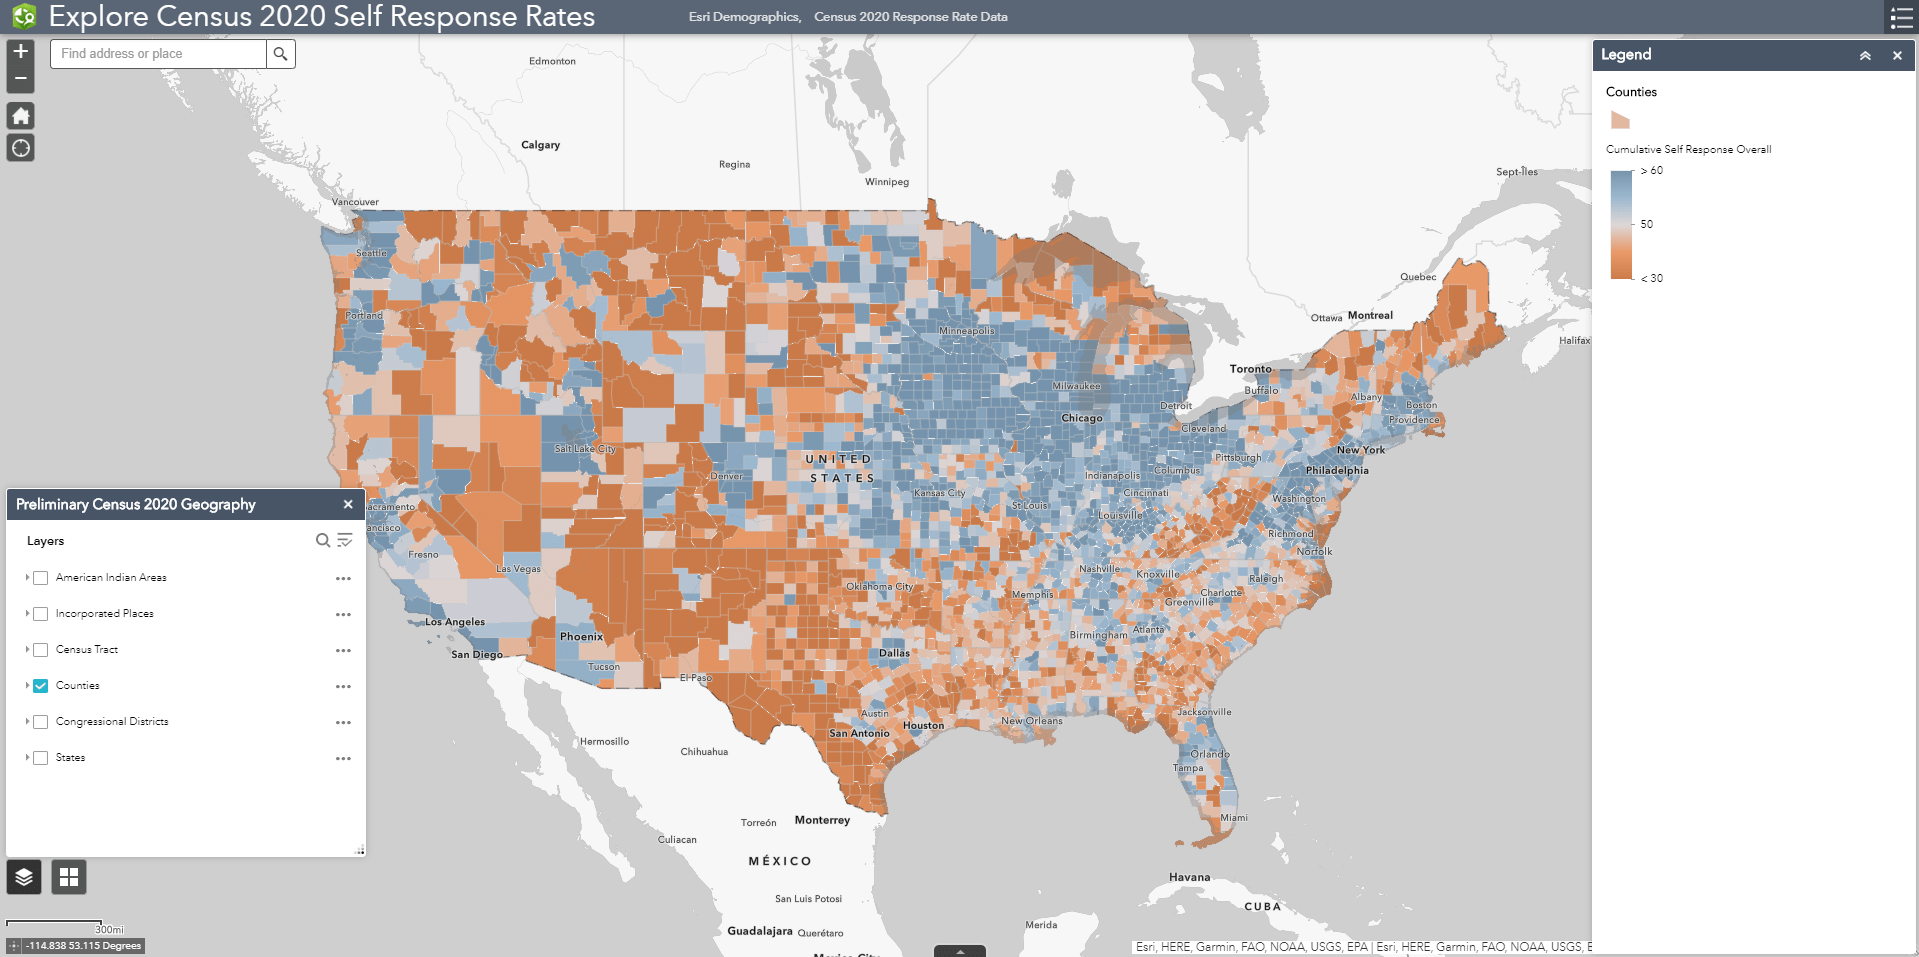
Layer attributes include daily and cumulative self-response rates for internet response and overall response (internet, phone and mail). The Census Bureau has projected a 60.5% self-response rate. They expect that over three of every five housing units that received invitations to self-respond to Census 2020 will do so. The Census is adjusting its schedule due to the COVID-19 pandemic. The self-response period that was originally planned for March 12th to July 31st will now be extended to October 31st. If the 60.5% mark is reached, the Bureau will still need to hire about 320,000 enumerators to go door-to-door as part of the Census Nonresponse Follow Up (NRFU) program. The NRFU program is expensive and NRFU households are often the source of lower quality, imputed or missing data.
Please take advantage of any spare time you may have during the COVID-19 pandemic to respond to the Census. Encourage your friends and family to do the same. Given the option to respond online, a longer self-response phase and millions of people quarantined at home we should be able to surpass the 60.5% response rate goal. Perhaps there is a silver lining here for Census 2020?

Article Discussion: