Browse and purchase demographic data in minutes with new enhancements from Esri Reports. This week marks the launch of highly requested tools, features, and processes designed to improve the purchase experience for Esri Demographics data users.
What Are Esri Reports and What’s Included in the Latest Enhancement?
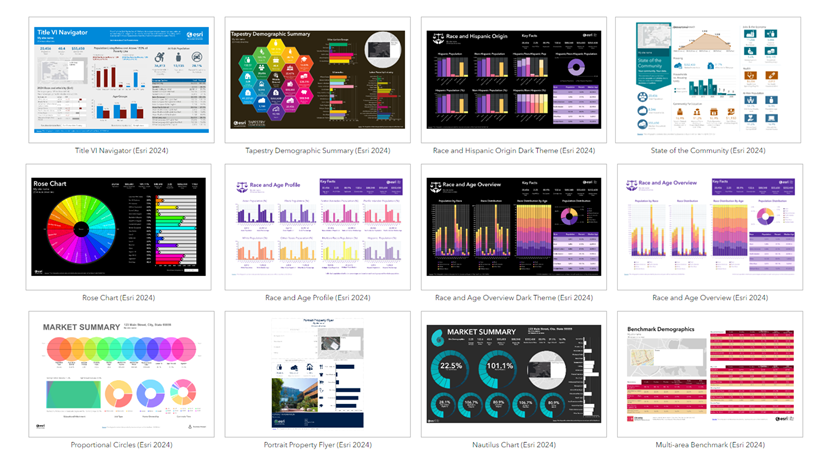
Esri Reports offer a quick and easy way to get the demographic facts you need for $50USD/report. The reports are sold through the Esri Store and will now include the three accompanying infographic reports listed below:
- Community Summary—A visual representation of demographic and socioeconomic data for a specific community.
- Population Trends & Key Indicators—A visual representation of demographic population-related data trends and key indicators for a specific area.
- Housing Market Characteristics—A collection of data and analytics visualizations that provide insights into the housing market of a specific geographic area.

Enhanced Category Options and Descriptions to Quickly Determine the Best Report for You
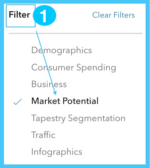
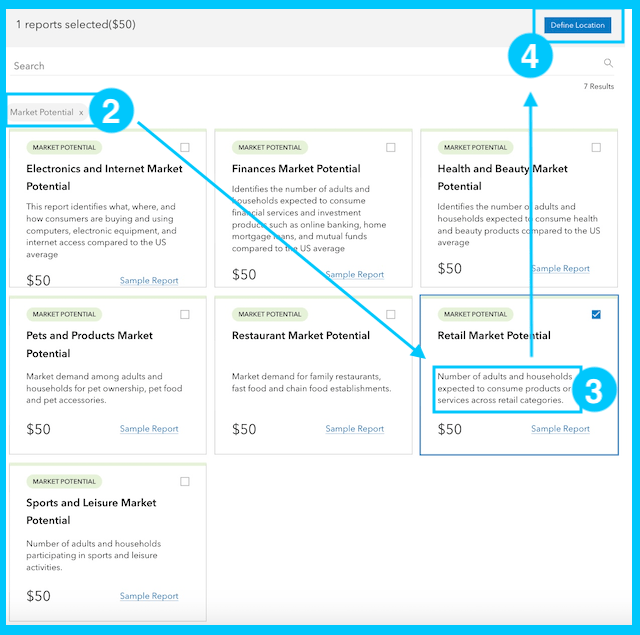
You will also have the opportunity to conveniently analyze and select the reports that best suit your needs. Unsure whether a specific report is for you? Follow the example highlighted in the steps below:
- Filter reports by Category—for this example, Market Potential reports.
2. Select from one of seven Market Potential report options.
3. Read the Market Potential report descriptions and select the one that fits your needs.
4. Click Define Location to select your Esri Report.
More Updates, More Options
The recent improvements to Esri Reports will help you save time, find the reports you need, and allow you to focus on the topics critical to your work. Additional updates include the following options:
- View and/or bookmark current and historic reports in one place after purchase.
- Access purchased reports past the 30-day purchase window.
- Order reports in either PDF or Excel format.

No ArcGIS Subscription, No Problem
Esri Reports are available with or without an ArcGIS subscription. You can find answers to questions around establishing a defined radius, drive time, sales territories, and more. Advanced users can leverage Esri Reports to:
- Conduct a feasibility analysis for a proposed commercial or residential property.
- Compare how a community has changed over time.
- Anticipate demographic change in a given area.
Are you an Esri Reports user ready to take your analysis to the next level? Explore the ArcGIS Business Analyst Web App (Business Analyst web app) for access to reports via a subscription. The next update for Esri Reports will take place along with updates to US data in June/July 2024. Release dates are subject to change.
Learn More about Accessing Demographic Data from Esri
ArcGIS Online and ArcGIS Pro
- Use the Enrich Layer tool to append location-based data to points, lines, or areas
ArcGIS Business Analyst
- Identify sites and evaluate markets with ArcGIS Business Analyst, a demographic mapping software.
ArcGIS Platform
- Enhance workflows and apps with the ArcGIS GeoEnrichment Service—enrich data with additional location-based information about people and places in a specific area.
ArcGIS for Excel
- Use the ArcGIS for Excel app in Microsoft Excel to access demographic data via the ENRICHBYGEOGRAPHY function.
Ready to buy?
- Just need a report? Visit Buy Esri Reports.
- Just need data? Email datasales@esri.com.



Article Discussion: