Your customers are inundated with choices each and every day. Using Esri’s Consumer Spending data, you can develop products and services that resonate based on your customers needs, desires, and behaviors.
To increase your chances of a successful product sale, you need to understand who your customers are and how they spend their money. What may surprise you is that where your customers are located can make a huge impact on how they will interact with your brand and/or products.
Esri Consumer Spending data can help you understand consumer spending trends and measure local demand for goods and services. You can use this data to learn more about who your customers are, how they spend their money, and how to find more customers like them. After all, successful business isn’t just about reaching your existing customers, it’s about identifying the characteristics that make your customers unique so that you can find more people like them.

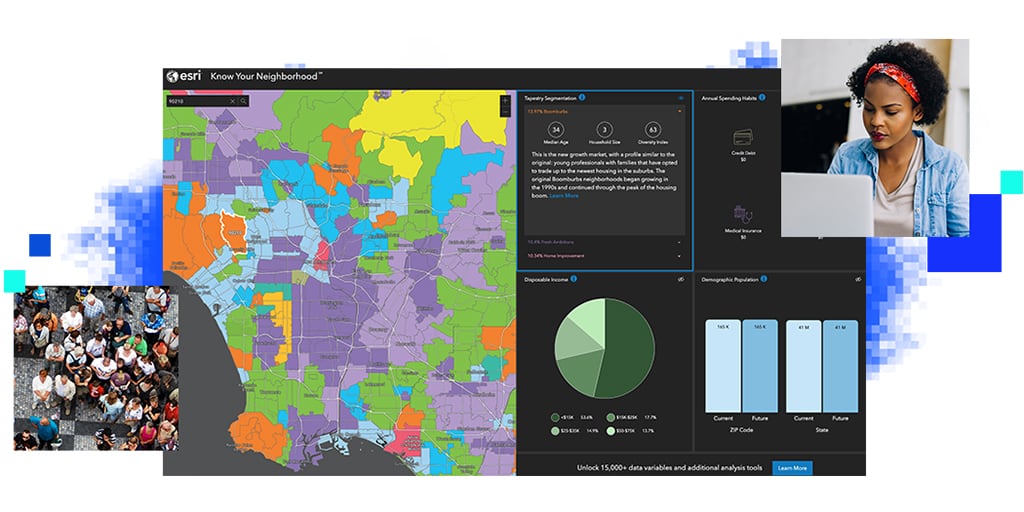
To help you better understand how Esri Consumer Spending data works, explore the Know Your NeighborhoodSM app. To use this app, simply put in your ZIP code, then watch as insights are revealed about the populations in your neighborhood. In this experience, you’ll see Consumer Spending data side-by-side with Esri’s other datasets, such as Esri Demographics, Esri Tapestry Segmentation, and Esri Market Potential data.
Try the app

What is Esri Consumer Spending data?
Esri Consumer Spending is a proprietary dataset developed by Esri’s expert team of demographers and statisticians. Utilizing the latest Consumer Expenditure Surveys (CEX) from the Bureau of Labor Statistics, Esri links the spending of consumer units in CEX surveys to all households with similar socioeconomic characteristics using a conditional probability model that integrates consumer spending with Esri’s Tapestry market segmentation system. Spending patterns are developed by Tapestry markets and calibrated to current levels of income. You can learn more about the methodology here.
The Consumer Spending database includes 20+ different data tables, with over 700 different Consumer Spending data variables. The database can tell you more about retail goods and services, recreation, medical, and other financial expenditures. Because the database is inherently location-based, it can tell you where spending is taking place. This information can help you compare market areas to give you confidence in your territory outreach when considering the different types of marketing avenues to pursue.
Consumer Spending data describes demand for products and services in US dollars. For any area, you can determine what the total annual expenditure is or look at the average annual expenditure by household. In addition, each data variable is available as an index comparing the area’s average annual household expenditure rate to the US’ rate.
Because the data are available for both current-year and a five-year forecast, you can see whether demand for certain products and services is going up, going down, or staying steady.
Often used side-by-side with Esri Market Potential data, Consumer Spending, when enriched with other datasets, can give you a complete 360-degree view of your customers and the way they spend their money. Keep in mind that Consumer Spending will vary based on demographics. Knowing who your populations are is also important to knowing how the populations spend. Seeing the customer from the perspectives of many different types of data, can help you to uncover the intricate details that make your customer unique.

What questions can be answered using Esri Consumer Spending data?
To help frame Consumer Spending data into context, you may consider the following questions that can be answered utilizing the database. Use cases for Esri Consumer Spending data are extensive and not limited to the list below. However, we hope this list inspires you to think about the different ways the data can help you solve problems at your organization.
- How much was spent on out-of-home dining during lunch hours at fast food establishments?
- What was the average amount spent in Texas on newborn baby girl shoes?
- Which ZIP code spends the most on college tuition?
- Do people spend more money on movie tickets or sporting event tickets in this area?
- Should you invest in music streaming or television ads?
- How much do people spend on pet food in this area compared to this other area?
- Does this block group need renters or home insurance?
- Would it be wise to suggest a package with boat insurance?
- Are people more likely to own a home gym with exercise equipment or pay to workout at a facility?
- How much is spent on protein food options vs. vegan food options?
- Does this neighborhood invest in lawn care and/or house cleaning services?
- Which county in the state has the most residents that own vacation homes?
You can view the complete variable list here.

Add Esri Consumer Spending to your apps and dashboards.
Esri offers Consumer Spending data in a variety of ready-to-use formats, including prepared databases and maps. Data is available as CSV, Excel, and FGDB files – or can be readily accessed throughout ArcGIS. Our extensive QA process provides an extra boost of confidence when adding Esri Data to your apps and dashboards. As with all data, it is important to utilize data you can trust to lead to qualified results.
Consumer Spending data is also available through Esri’s ArcGIS Platform where you can integrate location and data into your apps and business systems using your API of choice. This PaaS-based pricing model allows a pay-as-you-go option to enrich your data using Esri’s ArcGIS GeoEnrichment Service, granting you the ability to expand at scale. The GeoEnrichment Service uses location as a common connector. Thus, any dataset that has a spatial element to it, is ready to sync with Esri Data. GeoEnrichment can enhance data joins to provide deeper context than using your customer data alone.
Access data in ArcGIS Business Analyst.
If you are looking for a location intelligence tool to explore Consumer Spending, ArcGIS Business Analyst may be right for you. ArcGIS Business Analyst includes Consumer Spending as a part of the rich-software data suite, alongside Esri Demographics, Esri Tapestry Segmentation, and Esri Market Potential data. As an industry-leading analysis tool for market planning, site selection, and consumer segmentation, ArcGIS Business Analyst can help you make intelligent business decisions.
Since the data is already built into the software, you can access Consumer Spending data and quickly run analyses. You can also build reports and infographics to share your analysis results with others. A free trial is available to explore the possibilities of ArcGIS Business Analyst and Consumer Spending. With an easy step-by-step introductory guide and lessons to get you started, you’ll be running data-driven analysis in no time.

Purchase a ready-to-use Consumer Spending report.
If you are looking for information fast, we can deliver a location-specific Consumer Spending report to you. By simply selecting your area of interest, a ready-to-use Consumer Spending report will be generated for you. With Esri Reports, you’ll be able to see what spending habits are most prominent based on community populations. You’ll also be able to compare your area of interest to the overall US average to understand how the area compares nationally.
Explore more data from Esri and our partner community.
Whatever your data needs may be, Esri can help. From proprietary demographic data that we build in-house, to enriched datasets that can answer your questions about the people and places that matter most to you. Esri’s goal is to provide access to quality data in the form that you need, so that you have more time for analysis and less time spent looking for the data to support it.
We also have an incredible partner community that continues to raise the bar alongside Esri to provide you the latest innovations in location data. To learn more about the data available from Esri and our partners, check out our product portfolio.


Article Discussion: