In this blog post you’ll learn how to build a simple cross-platform mobile application using the new ArcGIS Maps SDK for Flutter beta, that shows countries around the world where coffee is produced.
Introduction
Coffee is one of the most popular beverages worldwide. The plant from which the bean is grown (genus Coffea) typically grows between the tropics of Cancer and Capricorn, at high altitudes, across five continents and over 50 countries. Brazil is the largest producer, exporting over 58 million bags of coffee annually, but did you know China, Tanzania and Nicaragua also produce coffee?
Intrigued by the origins of specialty coffee from lesser-known coffee producing countries, I created a Flutter app using the new ArcGIS Maps SDK for Flutter beta to map coffee production worldwide.
In this blog post (best viewed on desktop), I’ll outline how I built this app and how you can do the same, focusing on the functionality of the Flutter Maps SDK beta.
What you need for this app
To build this app, you will require the following:
- Install Flutter: Follow the instructions on the Flutter documentation get started guide. Xcode and Android Studio are required for their respective platforms, and Visual Studio Code is the recommended IDE.
- Download the ArcGIS Maps SDK for Flutter beta: Access the beta by registering on Esri’s Early Adopter website. Refer to the documentation there on how to get started.
- API key: You will require an API key access token to authenticate the basemap services used in this application. Learn how to create one on the Esri Developers website, and see an example of how to set your API key on a Flutter Maps SDK app in the Flutter beta API reference documentation.
Data required for this app
This app requires the following data:
- Basemap: A basemap is required to give the data spatial context. Basemaps are provided by the Flutter Maps SDK – for this app I chose the ArcGIS Topographic basemap style, though other basemap layers are available.
- GeoJSON data: This data format contains country borders as polygons and also contains non-spatial information about how much coffee is produced annually.
The ArcGIS Maps SDK for Flutter beta makes it straightforward to work with data from multiple sources. For this app, I created a deserializer class to transform client-side GeoJSON data to objects, but you could also work directly with server-side data from ArcGIS hosted services, or offline data such as geodatabase files.
Now you have everything you need to get started building the app! In the following sections I’ll share a high level overview of the steps required to configure the app, followed by a code snippet that shows the key points from the section. These code snippets are simplified and shortened – the best place to view the completed code in full context is on my GitHub repo.
Display a map
Let’s start by displaying the base map.
- Create a
MyHomePageclass that extendsStatefulWidget(allowing it to maintain state that might change over time). - Create a
MyHomePageStateclass to manage the main logic and state management for the map, and within that useArcGISMapView.createController()to create a map view controller (required to configure the map with data and handling user interactions). - Within a method called
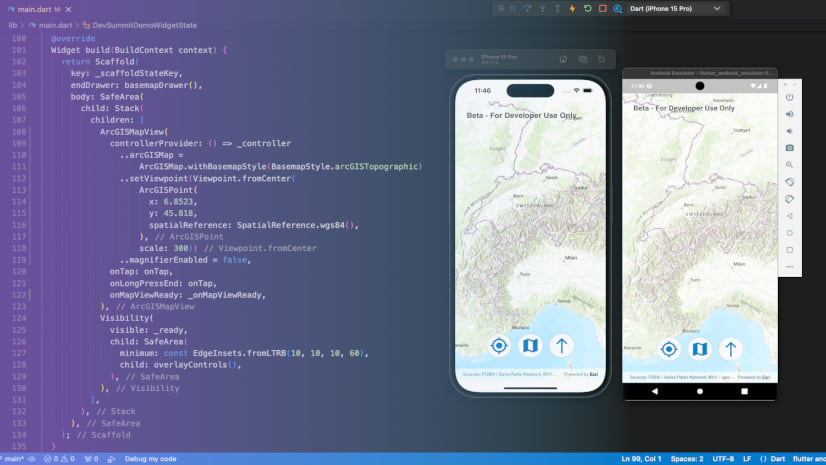
_onMapViewReady, create the map using theArcGISMap.withBasemapStyle(BasemapStyle)constructor. You can also set an initial viewpoint on the map in this method. - Assign the created map to the map view controller and add a graphics overlay (this will display the coffee country data).
- To render the UI that displays the map, use Flutter’s
buildmethod to return aScaffold(used to design the visual layout structure of the app). Add anArcGISMapViewwidget as a child to the scaffold body, using the map view controller set up earlier in the constructor. - Set the
_onMapViewReadymethod to theonMapViewReadyproperty. Additionally, set up theonTapproperty with a_selectGraphicfunction to handle user taps on the screen (we’ll cover the details of this function later).
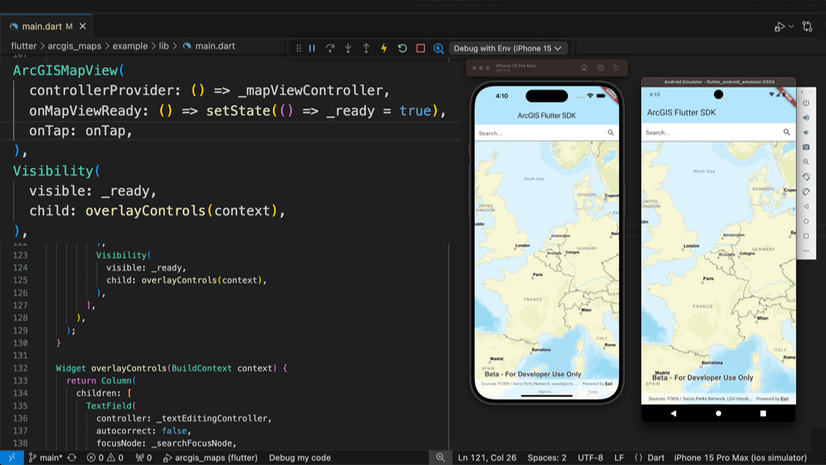
You are now well on your way to creating your mapping app. If you were to run the app now, you should see a basemap displayed on your emulator or device like below.

Add the data to the map
Next we’ll display the data on the map by reading the GeoJSON country polygon and coffee producing data, and converting it to graphics to overlay on the map view.
- First load the GeoJSON data into the app (I did this using a custom deserializer to convert the data into Dart objects).
- The country polygon data are stored as pairs of coordinates (integers), which need to be used to create
ArcGISPointobjects for drawing polygon graphics on the map. This data consists of countries represented by single-part polygons (e.g. countries with a single continuous border such as Burundi) and also multi-part polygons (e.g. countries with multiple islands, such as Indonesia). - To handle the single-part polygons, check if the feature’s geometry type is “Polygon” and then loop through each country’s coordinates to create a new
ArcGISPointobject and add it to aPolygonBuilderto create a polygon. Then create a graphic from the polygon and apply a symbol style. - To handle countries with multi-part polygons, additional logic is required. Check the geometry type is “MultiPolygon” and loop through each part to create a
MutablePart, and then as before, loop through the coordinates of each part to create anArcGISPoint. Add each point to theMutablePart, and then build a polygon from the mutable parts. - Finally, configure attributes for the graphics that will be used to display information about each country, and add the graphics to the graphics overlay to display the coffee boundaries on the map.
The app is now configured to display the countries where coffee is produced as polygons overlaid as graphics on the map!

Interact with the data
Now that our app is displaying data on the map, we can set up user interactions with the onTap callback parameter (handles taps on the map).
- Create a new asynchronous function that takes an `
Offsetparameter (this represents the local position on the screen the tap occurred). Then callmapViewController.identifyGraphicsOverlayto asynchronously identify the graphic tapped on the map. - After identifying the graphic, zoom to the tapped location on the map (we’ll look at this in more detail in the next section).
- Finally, return and display the graphic attribute information configured in the previous section. You can then set up a custom Flutter dialog to display this information.
Now when you tap a coffee producing country on the map, it displays a dialog that shows the country name and the amount of coffee bags produced.

Zoom to a country
Now the app allows a user to interact with the data and show information about it, we can fine tune this further by zooming to the country that was tapped on.
- To zoom to the country that was tapped on , use
mapViewController.setViewPointAnimated, passing in aViewpointcreated from a target extent (i.e. the country tapped). - This will result in the extent of the country filling the screen, possibly obscuring that country’s context. Add a buffer around the extent using
EnvelopeBuilderto build an expanded envelope.
Now when you tap on a country, the map view will zoom to that country’s extent, leaving a margin between the edges of the polygon and the device screen.

Flutter widgets and user interactions
The main functionality of the app is complete! All that remains is to add some Flutter widgets to allow further user interactions. These UI changes can be configured and changed quickly and easily thanks to Flutter’s hot reload feature, meaning you don’t have to recompile the app to view your UI changes.
- When the user taps on a country, the viewpoint of that country is preserved when the custom dialog is closed. To make it easier for the user to zoom out, add a floating action button to navigate the view point back to a world view.
- Then to give the user more ways to explore countries where coffee is produced, add an interactive grid view using a third party sliding up panel widget. Configure the widget so that when a country name is tapped, the map automatically zooms to that country by checking the country’s name against the graphic attribute name.
Now the finished app has additional UI improvements which allow the user to not only interact with the map, but also a floating action button to reset the map view, and a list of coffee countries to browse via the sliding up panel.

Summary
You now have a cross-platform mobile app built with the ArcGIS Maps SDK for Flutter beta, which can used as a quick reference guide to discover the countries coffee comes from! We’ve covered a lot here, so here is a high level recap of what we’ve done:
- Installed Flutter and the ArcGIS Maps SDK for Flutter beta, and created an API key for location services authentication.
- Displayed a map on a cross-platform mobile app
- Loaded GeoJSON data as single and multipart polygons
- Displayed polygons as graphics on a graphics overlay on the map
- Added identify operations to the graphics for querying data information
- Set up interactions with the map view and other Flutter UI elements to navigate around the map easily.
What’s next?
If you haven’t already, you can access the ArcGIS Maps SDK for Flutter beta from the Esri Early Adopter Site. If you’d like to view the source code and/or give this app a try for yourself, you can find it here on GitHub.
I hope this has inspired you to play around with building your own Flutter mapping applications – we’d love to hear your feedback on how you find using the Flutter Maps SDK beta. You can leave feedback on our dedicated developer forum on the Early Adopter site, which is monitored and responded to regularly by our developers.
If you haven’t already, you can sign up for an ArcGIS Location Platform account to generate an API key.

Commenting is not enabled for this article.