The R-ArcGIS Bridge combines the power and flexibility of open-source R packages with authoritative datasets, advanced spatial analytics, and mapping and visualization capabilities from ArcGIS. One example is the R package for ArcGIS Pro integration, {arcgisbinding}. At the 2024 Esri Developer Summit, the R-ArcGIS Bridge team will be announcing a new, open-source package that facilitates interacting with ArcGIS location services from R. Join us at the following events to learn more about this exciting development!
Plenary
Attend the plenary to hear the big R-ArcGIS Bridge news and learn about the many ways developers are using ArcGIS to build new solutions and solve problems.
Plenary Day 1
Tuesday, March 12 | 8:30 am – 12 pm | Oasis 3-4 | PSCC
Plenary Day 2
Tune in for the R-ArcGIS Bridge announcement and demo
Wednesday, March 13 | 8:30 am – 10 am | Oasis 3-4 | PSCC
Technical Workshops
Join us for technical sessions catering to different levels of R and ArcGIS experience.
Spatial Data Science in ArcGIS Using Python and R
Python and R are crucial in data science and provide powerful functionality that expands the capabilities of ArcGIS. This technical session will teach you how to integrate both open-source statistical packages with ArcGIS tools for spatial data science workflows. See how to take the guesswork out of transferring data between ArcGIS and the Python and R environments. The session will expect some knowledge of data manipulation in Python and R, as well as familiarity with running ArcPy geoprocessing tools.
Session Level: Intermediate
Thursday, March 14 | 10:30 – 11:30 am | Mesquite C | PSCC
What’s New with R and ArcGIS
Solving the world’s complex problems requires bringing together the best available tools, which often means integrating functionality between platforms. The R-ArcGIS Bridge establishes a seamless connection between the vetted spatial analysis powers of ArcGIS and the thousands of cutting-edge libraries for data science and statistical analysis in R. Come see this functionality in action and learn how you can incorporate the newest R-ArcGIS Bridge into your workflows.
Session Level: Beginner
Friday, March 15 | 8:30 – 9:30 am | Mesquite GH | PSCC
User Presentation
Learn how users are engaging with the R-ArcGIS Bridge in their work.
From Turing to Tobler over the R-ArcGIS Bridge: Code to Identify Key Scales
Imagine you need to identify environmental factors influencing bird diversity in London, but know you first need to determine at what spatial scales to begin your analysis. We present a generalizable approach for determining where the action is in a dataset through this bird diversity example. Crossing the R-ArcGIS bridge several times, we leverage sampling theory from Alan Turing and scale variance analysis proposed by Waldo Tobler to help answer our question and suggest broader applications.
Session Level: All Attendees
Thursday, March 14 | 2:30 – 3:30 pm | Mesquite C | PSCC
Expo
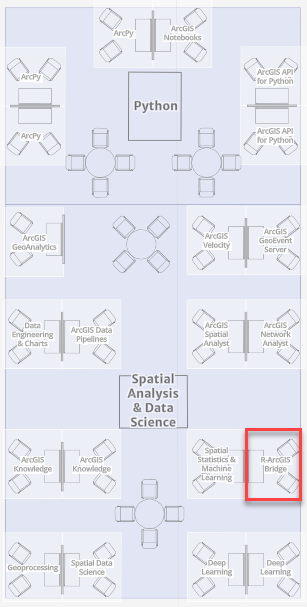
Visit our team in the Esri showcase in the expo to talk all things R. We enjoy hearing about your use cases, questions, and ideas for integrating R and ArcGIS! We will be located at the R-ArcGIS Bridge kiosk in the Spatial Analysis & Data Science island from Tuesday, March 12 through Thursday, March 14.


Article Discussion: