Void analysis is a powerful tool that allows organizations and policymakers to identify gaps in services or resources in specific geographic areas. This method uses points of interest (POI) data to compare a target area with a reference area to detect businesses, services, or amenities that are lacking. In practical terms, void analysis reveals what exists in one area but not in another, pinpointing which services are underrepresented.
For businesses, void analysis helps identify market opportunities by revealing the specific types of services that are lacking in an area. For instance, a retailer might use this tool to discover whether an area lacks their type of business. But void analysis is equally useful for addressing social issues, such as assessing the distribution of healthcare centers, educational facilities, or public services in one area compared to another. It plays a vital role in helping decision-makers allocate resources equitably, ensuring all communities have comparable access to essential services.

Scenario: Identify counties lacking senior care centers
As populations age, the demand for senior care increases, yet not all counties have enough facilities to serve their aging residents. This represents a serious social issue, as elderly populations in underserved areas may struggle to access the care they need. Identifying these gaps and rectifying them is essential for ensuring that older adults, especially those in rural or underprivileged areas, can age with dignity and receive adequate care.
Governments often focus on counties as their primary geographical units for analysis because counties are large enough to reflect significant population trends but small enough for targeted interventions. Counties are also standard units for federal and state-level policy implementation, making them ideal for programs designed to allocate resources like senior care.
While senior care services are often provided by private entities and non-profits, with support from local and state governments, void analysis can help both sectors by enabling a systematic comparison of counties to identify areas lacking senior care centers. This helps inform the development of targeted policies to address these gaps.
This blog article guides you through each step of the void analysis workflow, showing how you can leverage POI data to identify underserved areas and take action to improve access to senior care services in your region.
How void analysis can help: Steps to address senior care gaps
By using the ArcGIS Business Analyst void analysis workflow, policymakers can follow these steps to identify and address gaps in senior care centers:
- Select the analysis area
Choose the location you want to assess. In which counties do you suspect increased senior care services may be needed?
- Select the reference area
Identify a well-served county with adequate senior care centers to compare against.
- Create a list of senior care centers
Compile a custom list of POIs that capture senior care facilities, such as nursing homes and assisted living centers.
- Analyze the results
Review the results to identify gaps in senior care facilities between the analysis and reference areas. These insights will help pinpoint specific service gaps and highlight the level of unmet need.
Step 1: Select the analysis area using smart map search
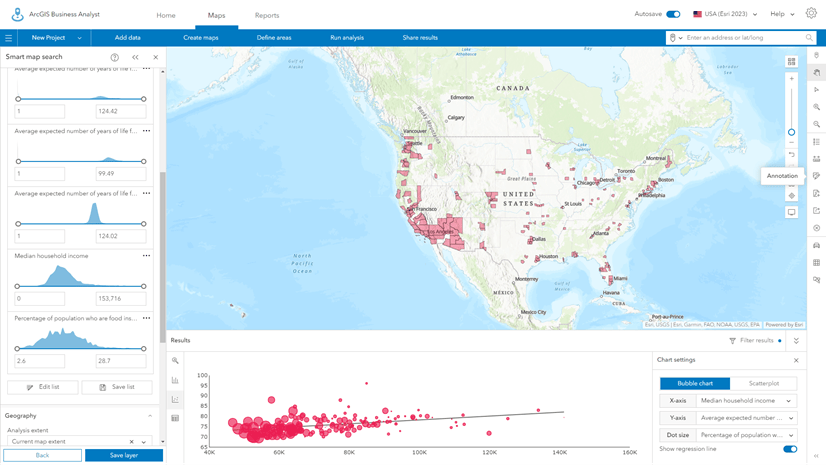
The first step in addressing gaps in senior care services is to select the analysis area. To identify areas in need of senior care services, you can use the smart map search (SMS) workflow in ArcGIS Business Analyst Web App. Using SMS, we can apply relevant demographic and socioeconomic filters to find and focus on counties where the senior population is large but underserved.
-
-
- Click Create maps and select Smart map search.
- Click Browse all variables to explore different demographic and socioeconomic indicators relevant to your analysis.
- Select these two variables as percentages and click Apply:
- 2024 Senior Population (Age 65+) (%)
- 2022 Population w/Income Below Poverty Level (ACS 5-Yr) (%)
- Filter the map to prioritize areas where the senior population is substantial and economically disadvantaged. Ensure that Counties is selected as the level of detail for the analysis.
- Senior population: minimum set at 30%.
- Population living below poverty level: minimum set at 25%.
-

Once these filters were applied, we found that Sierra County, New Mexico, was highlighted as an area with a high proportion of senior citizens and a high proportion of residents living below the poverty line:
- 38.24% of its population consists of seniors.
- 25.2% of its population is currently living below the poverty level.
These key indicators reveal that Sierra County has an especially high need for senior care facilities, and may be underserved, making it a prime candidate for further analysis.

After identifying Sierra County as the analysis area through the smart map search, the next step is to create a site for more detailed analysis. This allows you to perform comparisons with other areas and compare Sierra County to better-served areas. Here’s how:
- Click on the highlighted county (i.e., Sierra County).
- In the pop-up window, click Create site (as shown in the screenshot below).

Now that you have a site for Sierra County, NM, you can use this location for many Business Analyst workflows, including void analysis.
Step 2: Select the reference area using a comparison
Once you’ve identified Sierra County as the target area for your analysis, the next step is to select a neighboring, well-served county to act as your reference area. This allows you to assess Sierra County’s senior care service gap in relation to a “successful” location for senior care services. For this, you’ll compare Sierra County with nearby counties, focusing on key variables like the senior population percentage and poverty rates.
- Select the Sierra County site and click Comparisons in the pop-up. This will allow you to run a comparison between Sierra County and its neighboring counties.

- In the comparison window, click Add sites. Then select Neighboring geographies and check the box for Counties. Add all neighboring counties, including Catron, Grant, Doña Ana, Luna, Lincoln, and Socorro Counties, and click Apply.

- The comparison report displays the senior population and poverty levels for each county. Analyze the results to identify which counties would make an appropriate comparison. Based on the data:
- Sierra County has a senior population of 24% with 22.5% of households below the poverty level.
- Catron County, with a senior population of 45.02% and a lower poverty rate of 16.9%, emerges as an ideal reference area.
- Create a site at Catron County, NM.
After analyzing the data, you can select Catron County as your reference area due to its high senior population—even higher than Sierra County’s. Despite the higher percentage of seniors, Catron County has a significantly lower poverty rate, which may indicate that more of its elderly population can access or afford senior care services. By selecting Catron County as the reference area, you can now perform a void analysis to compare the presence of senior care centers, helping you to determine if gaps exist in Sierra County.
Step 3: Perform a void analysis to identify gaps
With your analysis and reference areas set (Sierra County as the analysis area and Catron County as the reference), it’s time to perform a void analysis to see whether senior care facilities are lacking in Sierra County. A void analysis is a bit like a points of interest search in Business Analyst Web App—but rather than just showing you the number and location of points, a void analysis can indicate whether the number of points is sufficient or insufficient relative to the population that lives there, when compared to another site.
Here’s how to perform the analysis using a custom list of business types relevant to senior care.
- Click Run analysis and select Void analysis.
- Click Select analysis area and from the list, choose Sierra County, NM as the area you want to analyze, which you previously identified using smart map search. Click Apply.

- Next, you’ll set Catron County, NM as your reference area. This will allow you to compare the services in Sierra County to the neighboring Catron County. Click Change reference area, choose Select area manually, and choose the Catron County site. Click Apply.

- In the Void analysis pane, click Next.

- After selecting the analysis and reference areas, the next step is to choose the types of businesses you’ll use to compare them. In this case, we’ll choose businesses related to senior care. For this analysis, you’ll use Esri-provided business data categories.
- Click Create custom list to define the types of services that are relevant for this analysis.
- In the Create custom list window, click the Category drop-down menu to view categories of data available. In the Category search bar, type “senior care” to bring up a variety of relevant categories, such as:
- Adult Care Facilities
- Senior Citizens Service
- Elderly & Disabled Person Services
- Senior Citizens Housing
- Retirement & Life Care Communities
- Residential Care Homes
- Community Care Facilities-Adult Care
- Day Care Centers-Adult
- Adult Congregate Living Facilities
- Senior Citizens Service Organizations
- Life Care Communities
- Nursing Home Services
- Retirement Communities & Homes

- Select these categories and click Done.
- Click Save list. In the Save list window, for List name, type “Senior Care”.
- Click the List icon drop-down menu. In the search bar, type “senior” and select an icon.

- Click Save and run analysis. (Note: Business data updates periodically. Your results may not match the example images and data values.)
When the analysis is complete, senior care facilities in Sierra and Catron Counties are added to the map as point locations.

Next, you will explore the results of the analysis.
Step 4: Review the results of void analysis
Now that you’ve run the void analysis for senior care facilities, it’s time to interpret the results. Follow these steps to review and understand the data. The results are displayed in both standard and advanced view, which can help you interpret the gaps by normalizing the data based on variables like senior population.
- Review the results:
- In the Void analysis results pane, you’ll see a summary showing that 3 voids were identified in Sierra County. These are senior care facilities that exist in Catron County (your reference area) but are missing in Sierra County (your analysis area).
- There are 4 locations in Sierra County and 4 locations in Catron County, but the voids indicate Sierra County lacks certain facilities that are available in Catron County.

- To see the detailed breakdown of the locations, click the Full results button at the bottom of the pane.

The Void analysis pane expands, showing a table with the names of all the facilities available in the reference area (Catron County) but missing in the analysis area (Sierra County). Rows highlighted in red represent voids, meaning the senior care facility exists in the reference area (Catron County), but not in the analysis area (Sierra County). For example, facilities like the Catron County Commission on Aging and Reserve Senior Center show as voids, indicating these services exist in Catron but not in Sierra County.

- Looking at the results by the specific names of senior care facilities might be useful if you were focusing on chains or large providers. However, for the purpose of this analysis, you are more interested in senior care centers as a category, rather than individual facility names. Click the Settings button.

- In the Result table settings window, check Show categories only.

- Next, click the Advanced view toggle button.

The advanced view provides more details about the analysis results and has automatically normalized the results based on population.

Normalization is the process of adjusting values to account for differences in scale, such as population size, to provide a more accurate comparison. For example, your void analysis shows that Sierra County and Catron County each have senior care facilities, but this simple count does not consider the differences in their senior populations. Counties with larger senior populations will have higher demand for senior care services than those with fewer senior people. When results are normalized, the analysis adjusts for these population differences.
Next, you will normalize the results by senior population in each county.
- From the Normalize results by drop-down menu, browse for 2024 Senior Population (Esri).

The advanced view of the Void Analysis results table now displays the senior populations of both the analysis area (Sierra County) and the reference area (Catron County), as well as the difference in senior population between them.

Rows highlighted in red represent voids, meaning the senior care facility exists in the reference area (Catron County) but not in the analysis area (Sierra County). Rows highlighted in blue represent senior care facilities that exist in both counties.
Normalizing by senior population adjusts the results based on the projected number of seniors in each county, giving you a better sense of whether Sierra County is truly underserved compared to Catron County. For example, Sierra County is expected to have 10 senior care facilities based on its senior population size, but only 4 facilities are currently present. This indicates a deficit of 6 facilities.
- The Expected in analysis area value shows how many senior care facilities Sierra County should ideally have, based on the senior population density in Catron County.
- Hover over the Expected in analysis area value to see how this number is calculated.

The formula divides Sierra County’s senior population (4,358) by the reference area density of senior care facilities in Catron County (433). This gives the expected number of senior care facilities in Sierra County, which, in this case, is 10.
In other words, normalization calculates the number of senior care facilities per senior person in Catron County and applies that ratio to the senior population in Sierra County, revealing that Sierra County should ideally have 10 senior care facilities to meet the needs of its senior population.
You can also normalize the results by other variables. For instance, if you want to understand demand based on total households, you can select 2024 Total Households (Esri) from the Normalize results by drop-down or click Browse for a variable to select other demographic or socioeconomic variables.
Conclusion
The void analysis revealed a significant gap in senior care services in Sierra County compared to Catron County. While Sierra County has four senior care facilities, the analysis shows that, based on its senior population, it should ideally have ten facilities if it wants to serve its senior population as thoroughly as Catron County. This leaves a deficit of six facilities, indicating that Sierra County is underserved. Addressing this gap is crucial to meet the growing needs of the senior population and ensure adequate care services are available.


Article Discussion: