New Data Axle business location data for the US and Canada is now available with the June 2023 release of Business Analyst!
Data Axle business locations are part of a comprehensive portfolio of points of interest (POI) data offered by Esri. Points of interest data from Data Axle focus specifically on business information, containing key content such as industrial classification codes, employee counts, and estimated sales volume.
This year, Esri is making more Data Axle business attributes available such as secondary industrial classification values, business category, associated shopping center name, and professional specialties. Improvements also include precise brand capitalization for company names and translated attribute values instead of codes. These enhancements create new pathways for querying, analyzing, and displaying Data Axle business data.
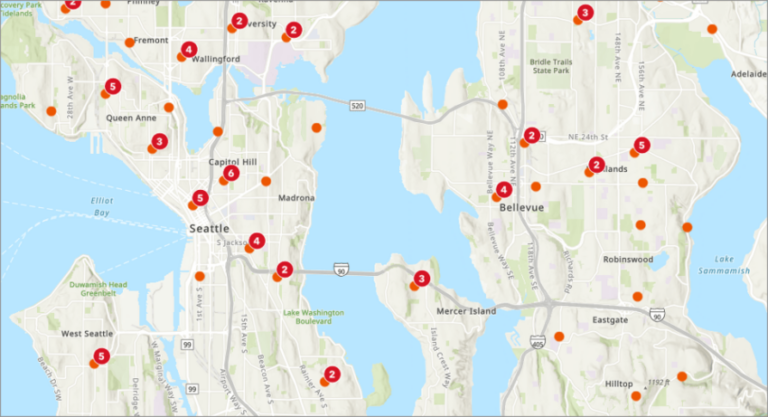
What can I do with these new features?
There are many possibilities for making use of this updated dataset in Business Analyst. Here are just a few ideas!
Filter and map new attributes
New attributes from Data Axle have been added that enhance the dataset with rich business information. Have you ever wanted to run an analysis on small businesses, focusing on only those that are independently run? Find out what medical specialties a doctor’s office may provide? Look for coffee shops that are located inside another store? Answering these questions is possible with this new data release.
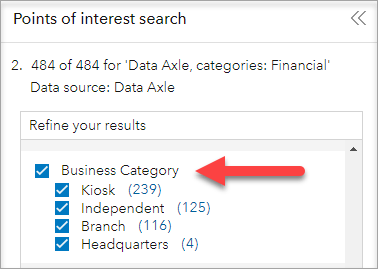
The new Business Category attribute allows you to filter specifically for headquarters, chains, independent, or kiosk locations. The filter selection for this attribute is shown below. For instance, if you are interested in “branch” financial institutions specifically, using this attribute to filter allows you to quickly focus on those records.
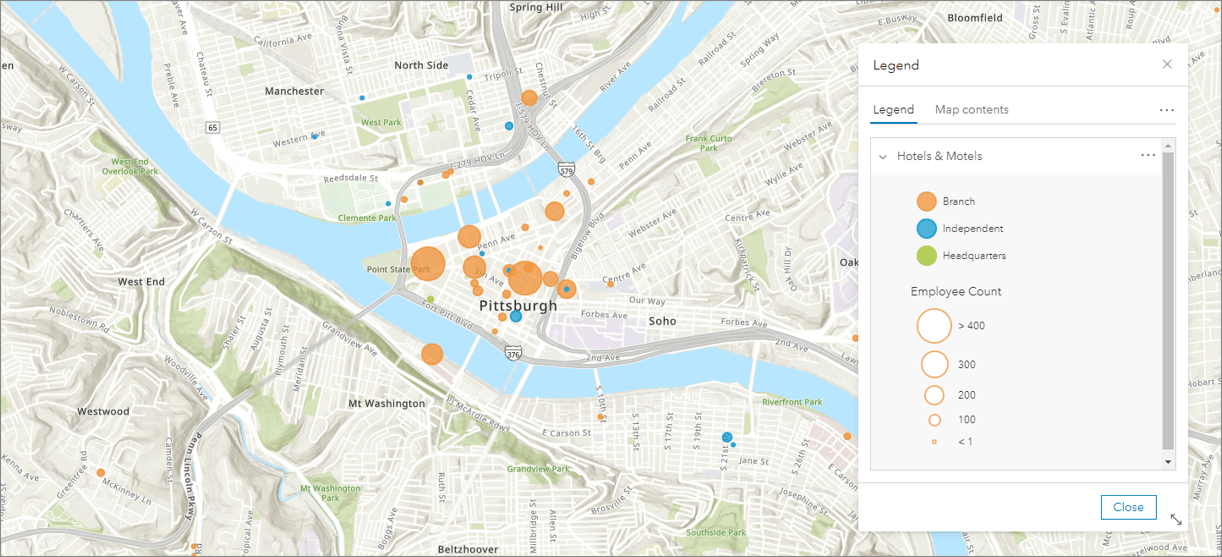
These new attributes can also be used to symbolize your map data. Did you know you can symbolize points in Business Analyst using multiple attributes? In the graphic shown, the new Business Categories attribute and the Employee Counts attribute are mapped using the Types & Size style.
One thing to keep in mind is that a business may not have values in all of these new fields, either because the attribute is not available or it is not applicable to that business. For example, an independent business will not have a Headquarters Name value.
Explore rich new business categories
The Data Axle category search has been significantly expanded and reorganized in this release, providing more coverage across business sectors and richer sub-category detail.
For instance, in the new category Manufacturing, you can drill down through multiple hierarchies to find very specific business types. As shown below, you can see particular vehicle manufacturing businesses such as recreational vehicle and electric car manufacturers.
The previous Data Axle category search in Business Analyst provided only a few hundred options to browse; with this release, that number has grown to almost 12,000.
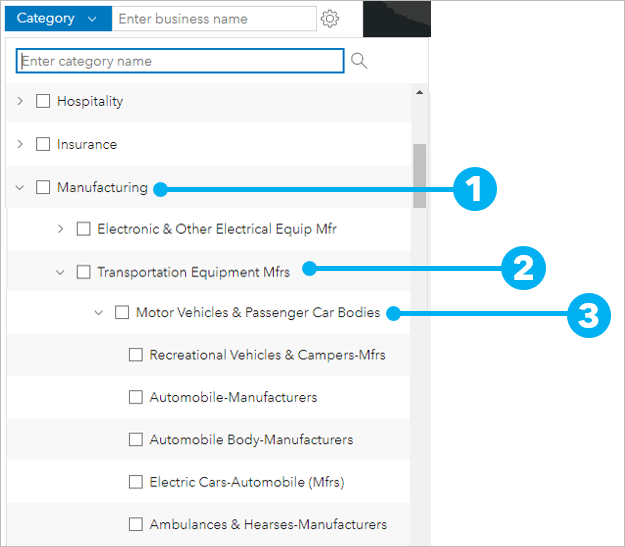
The new detailed categories are also available when building Nearby infographics and running Void Analysis in Business Analyst, providing improved selection of businesses for market and competitive analysis.
In future releases, Esri will be using these new categories to expand the collection of infographics to include more sectors and industries.
Use a field to search for POIs rather than a category
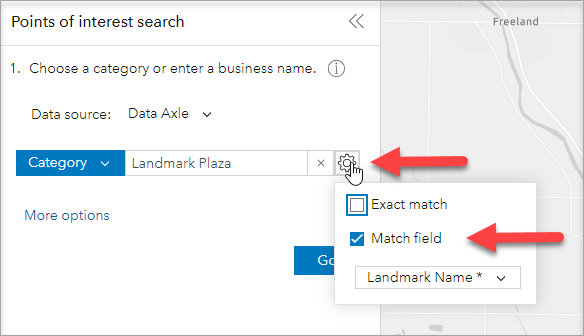
Rather than just using a business name or industrial classification category to search through businesses, you can now use multiple other fields as well. Click the cog icon in the search interface as shown below to view the full list of searchable fields.
For example, the new attribute Landmark Name, which identifies the specific shopping center or complex location for the business, can be searched to retrieve only those businesses in a shopping center of interest.
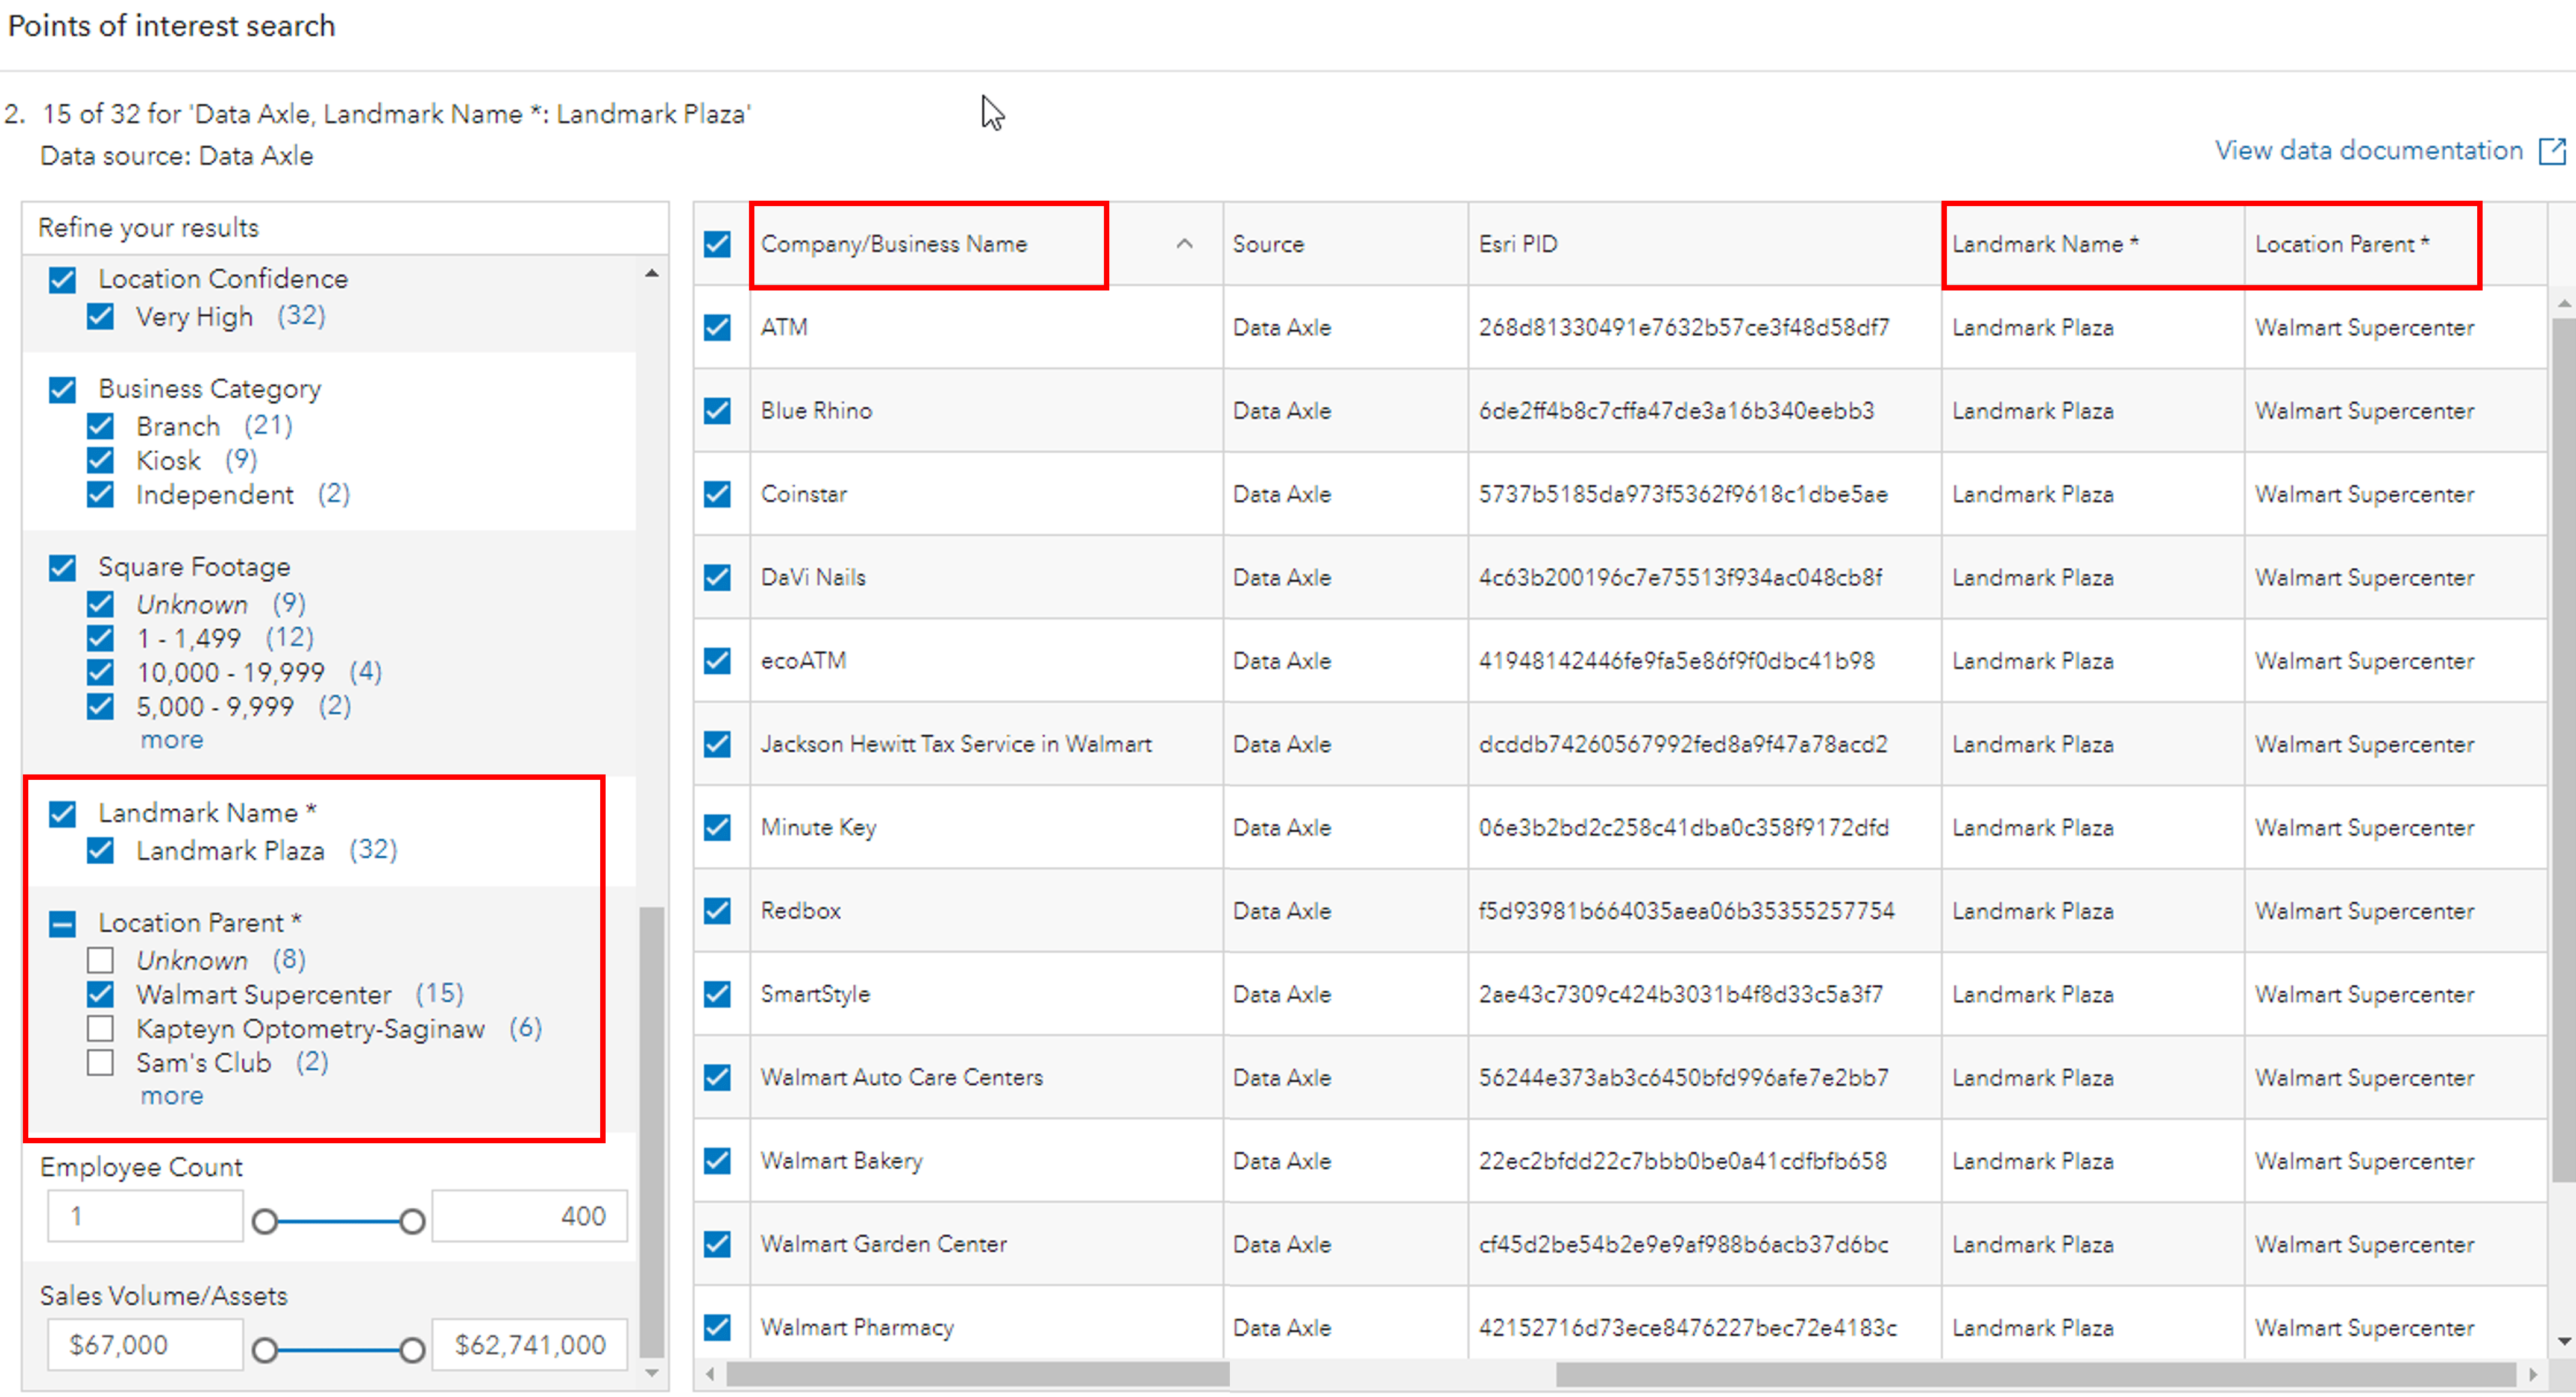
You can further filter records to those that have a Location Parent. The Location Parent is another attribute that is new with this release. At a location containing multiple businesses, this attribute designates the “parent” location; for instance, if a pharmacy is located inside a larger retail store, the retail store is the “parent”.
In the example below, using this approach, we have been able to identify sub-businesses within a Walmart Supercenter (the Location Parent), at Landmark Plaza (the Landmark Name) that include tax, nail and hair services, restaurants, and auto care. We’ve now refined the candidates down to the records that we want to analyze.
Understand corporate and group business affiliations
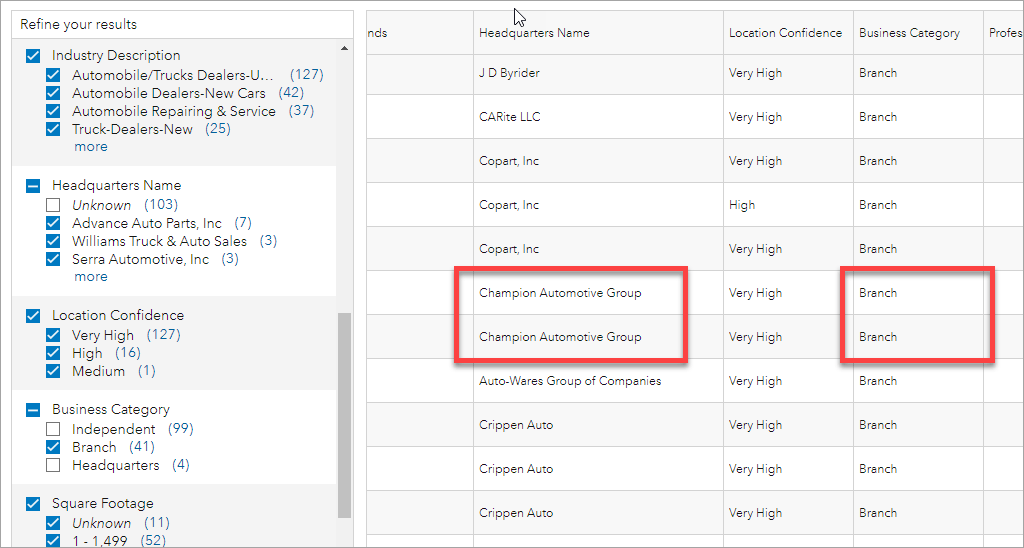
The Business Category type is a powerful way to understand dealerships, franchises, and groups of businesses. When using this field together with Headquarters Name you can better understand these relationships. For example, you can see related branches reporting to a particular automotive group in this area.
Search by secondary NAICS-based and SICS-based codes
Businesses have primary NAICS-based and SIC-based code designations that reflect their main line of business, but they may also have secondary designations. For example, a hotel might have a secondary code assignment for convention hosting, or a pet supply store might have a secondary assignment for pet grooming.
With the latest release of Business Analyst, POI search will now look through all associated NAICS-based and SIC-based codes to return business locations.
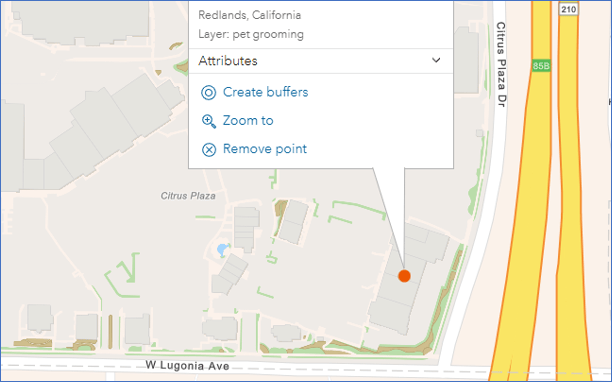
In the below example, the previous version of Business Analyst returned no results for “pet grooming” in this shopping center. In the latest release, however, a “pet grooming” location is now found in the shopping center because a pet supply store has a secondary code for the pet grooming facilities located inside.
Add new attributes to your infographic template
The new attributes can be added to your infographics in Business Analyst as well. Here is an example using the Nearby element in a new infographic. With Nearby, you can create a table of business locations near your site and display specific attributes of interest.
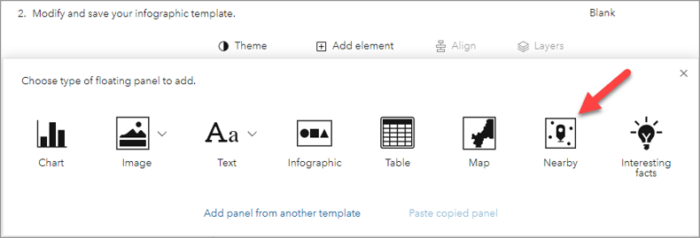
To add a Nearby element to your infographic, start by clicking Add Element, and selecting the Nearby button:
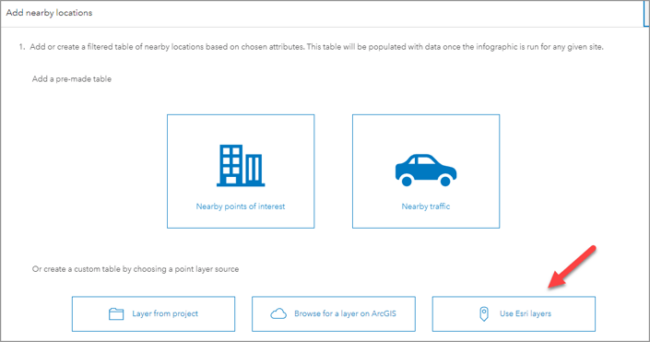
Now select Use Esri layers:
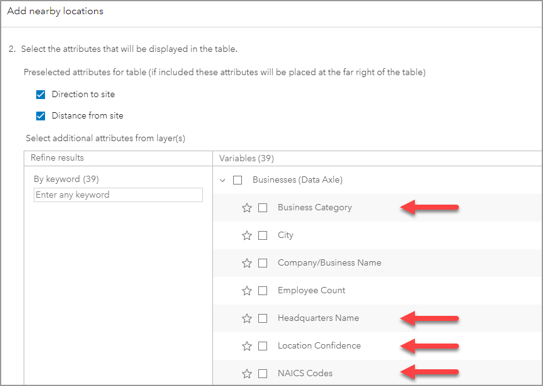
Expand the Businesses (Data Axle) drop down as shown below. You should see new attributes such as Business Category, Headquarters Name, NAICS codes, and so on. These can be added as variables to your Nearby table.
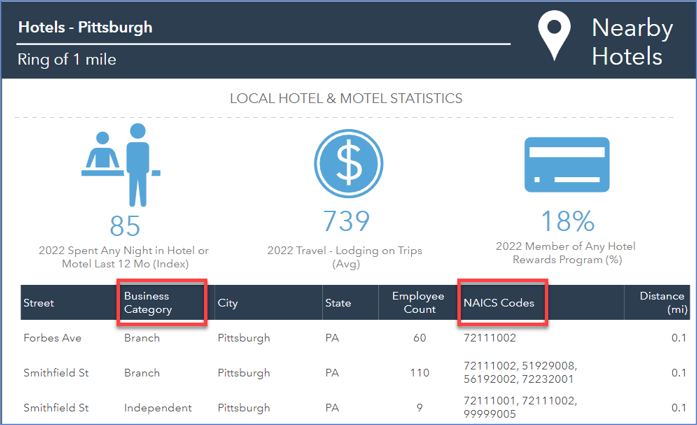
Follow the prompts to add any additional filtering criteria. The new Nearby table will then be added to your infographic. Here’s an example where the new Business Category and NAICS Codes attributes have been added to the Nearby table:
Where do I get more information?
We hope this has been a useful introduction to some of the new capabilities in Business Analyst using Data Axle business data. Look for more Business Analyst infographics featuring Points of Interest data to come!
Check out these links below for additional information:
- Learn more about Data Axle as a data provider, including data availability, reference documents, and sample reports and infographics.
- Learn more about all the data accessible in Business Analyst and how to work with it.
Happy exploring!


Commenting is not enabled for this article.