The data browser is a powerful interface that allows you to search for and add demographic data variables to your map. With thousands of variables to explore, the data browser can help you find which ones are available for a given country or region.
When paired with the GeoEnrichment service, you can add data to the geographic boundaries of your choice, such as counties and census tracts (standard geographies) or wards and drive-time areas (nonstandard geographies). This kick-starts any spatial analysis, bringing together the data you need and the places you’re interested in.
In ArcGIS Business Analyst Web App, the data browser plays an essential role when creating color-coded maps, conducting suitability analysis, building infographics, and performing other workflows.
What new data has been added to the Business Analyst data browser?
The June 2023 release brings an array of new variables to both U.S. and global demographic data collections, offering valuable insight into consumer spending, income distribution, and other areas of focus. Some of the highlights include the following:
- 129 new Esri Market Potential attributes covering food delivery/take-out, video streaming services, IM/video chat, digital payment services, and more
- New index and indicator variables, including Socioeconomic Status Index, Gini Index, Ratios of Income Inequality, and Households in Income Tiers
- 53 new attributes in Japan for 2020 for households, housing, jobs, population, education, income, and age, and three new spending attributes for 2023

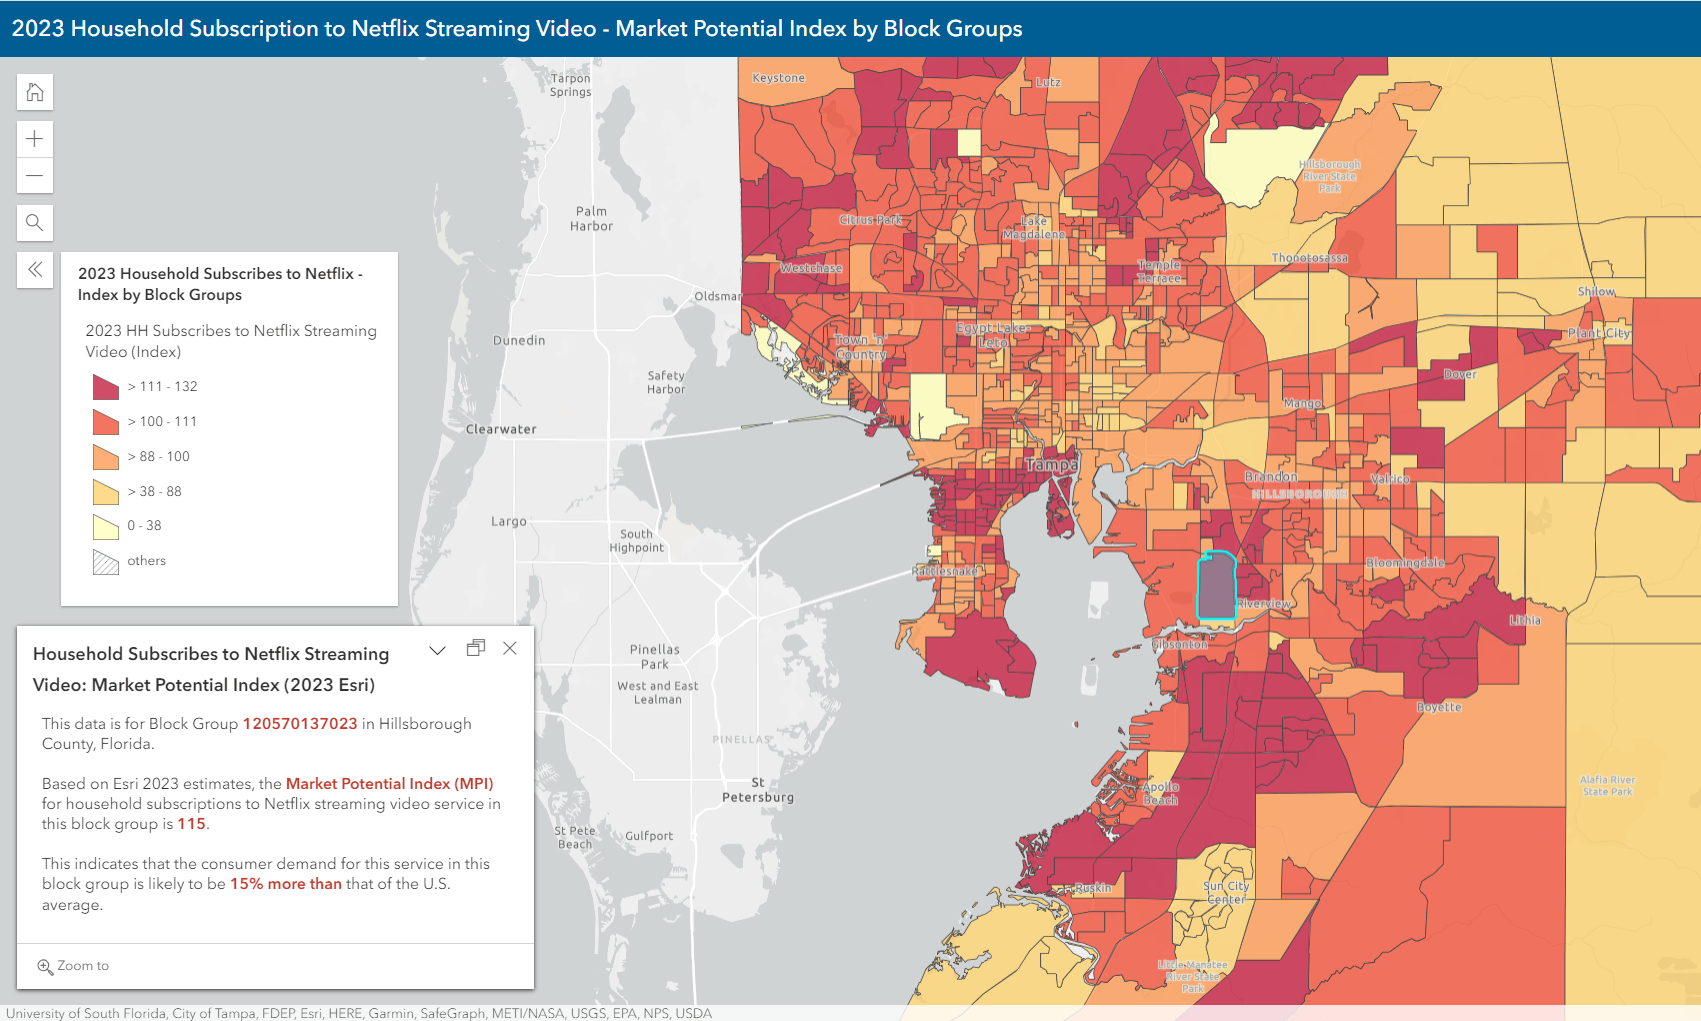
Above, a color-coded map shows Market Potential Index (MPI) values for household subscriptions to Netflix streaming video services by block groups based on Esri 2023 estimates. This is one of several new Market Potential variables available for use in Business Analyst Web App.
Learn more about what’s new in Esri Demographics as part of the June 2023 release, including updates to Standard Demographics, Advanced Demographics, and Places and Points of Interest (POI) data.
What new capabilities are added to the Business Analyst data browser?
In the June 2023 release, the data browser has new capabilities to improve your browsing experience and search results. For instance, if you search for winter sports in the new release of the Business Analyst data browser, you will retrieve 183 results that pertain to winter sports. In comparison, searching for winter sports in the Classic app only yields 3 results.

Behind the scenes, when you enter your search term, the ArcGIS Rest API converts the search term into a meaning vector representation using a pre-trained AI language model. The meaning vector of the search term is compared to the meaning vectors of variable descriptions to find the most semantically similar variable descriptions to the search string. This means that when you search for something that is phrased differently than how the variable is named in the data browser it will still return results that are similar in meaning to the search string.
One of the key developers working on the data browser, Nirvan Theethira, describes the technical background of this enhancement:
The core of the improved search experience is the meaning vector representations of variable descriptions. This is done using a pre-trained sentence transformer language model based on the BERT neural network architecture that has a latent understanding of the colloquial English language. This understanding is leveraged to create meaning vector representations of variable descriptions that embed semantic meaning of text in mathematical form. These meaning vectors can be compared using common distance measurement techniques to find the most similar variable descriptions to a user input search string in the data browser.
The language model gains latent understanding of English in two stages of pre-training. In the first pre-training stage, the language model is trained on a large corpus of English text giving it an understanding of the syntax of the language. In the next pre-training stage, the language model is trained on similar and dissimilar phrases giving it an understanding of semantic similarity and dissimilarity.
Additionally, there is a new find similar variables option related to your search terms that is active by default. To turn off this option, click the gear icon next to the search bar.

This enhancement enables a more sophisticated semantic search compared to the previous exact word match search. While this expands the number of variable results to variables that may not exactly match your search, the longer list of results is ordered in decreasing semantic similarity to the search string.
Additional resources
We hope that you find these new demographic data variables and data browser enhancements useful. For more information about the June 2023 Esri Demographics and ArcGIS Business Analyst Web App releases, check out these resources:
- What’s New in Esri U.S. Demographics (June 2023)
- What’s new in ArcGIS Business Analyst Web App | June 2023
- What’s new with business data in ArcGIS Business Analyst
- Migrate U.S. standard geography sites to the Esri 2023 data source in Business Analyst
- Measuring Relative Social Position with Esri’s Socioeconomic Status Index
Card image courtesy of Glenn Carstens-Peters on Unsplash.


Article Discussion: