Fall is in the air, and a new season brings new opportunities to explore the business landscape using ArcGIS Business Analyst Web and Mobile Apps. Whether you’re creating infographics on your iPad at a socially distanced café or sharing map layers with coworkers working from home, the September 2020 release of Business Analyst has you covered. Highlights of this release include business data search capabilities using highly sought-after SafeGraph data, more compact and modular sharing options for Business Analyst projects, and streamlined infographic viewing on phones and tablets.
This article describes the following updates:
- New business search data
- Improved sharing options
- Infographic viewing optimized for phones and tablets
- Demographic content updates for Canada (Environics) and Germany (Nexiga); updated business, shopping center, and traffic locations for USA
New business search data
SafeGraph data, which was previously available through ArcGIS Marketplace, is now built into Business Analyst Web App. This update allows you to seamlessly incorporate SafeGraph points of interest (POIs) in your Business Analyst workflows, including Business and Facilities Search and Void Analysis. You can take advantage of SafeGraph’s Places data in your analyses and reports by switching your data source or setting the app’s default business location data to SafeGraph. The data, updated quarterly, populates the following variables:
- Business name comes from the SafeGraph Place ID, a name that stays consistent across data releases. SafeGraph defines a place as a location where people spend money or time, so in addition to traditional businesses, these POIs can include locations such as museums, hospitals, and parks.
- Address, City, State, ZIP, and Street are derived from SafeGraph’s street_address data fields.
- NAICS code corresponds to business establishment categories in the North American Industry Classification System used by the U.S. Census Bureau. SafeGraph uses six-digit NAICS codes, which allow for searching by brand category.
- Brand name allows you to search and perform analyses with a specific chain of stores.
- Phone number reflects the ten-digit phone number at the POI, not a corporate-level phone number.
A major benefit of using SafeGraph data for your analyses is that you can share POI information, complete with a detailed street address. This new ability means that communicating about competitor and companion businesses is much easier—export as a spreadsheet or infographic and Business Analyst automatically includes full business address information from SafeGraph.
For example, you are a market analyst for a national bakery chain, and you want to analyze the potential for future expansion in Iowa City, a college town in eastern Iowa. You want to get a sense of key competitor locations near the university. Using SafeGraph data, you can research retail bakeries in the area by category or NAICS code.
To use SafeGraph data in Business and Facilities Search:
- Define your area of analysis (by point, geography, or drawing a polygon) in Define Areas at the top of the map.
- At the top of your map, click Create Maps. Select Business and Facilities Search.
- Change Data source to SafeGraph and click Apply.
- Browse for business types in Category, search business names, or click More options to browse or search by NAICS code.
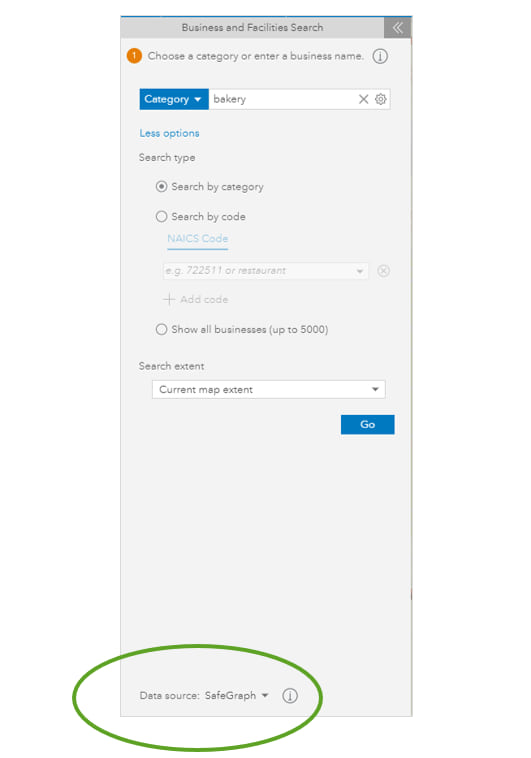
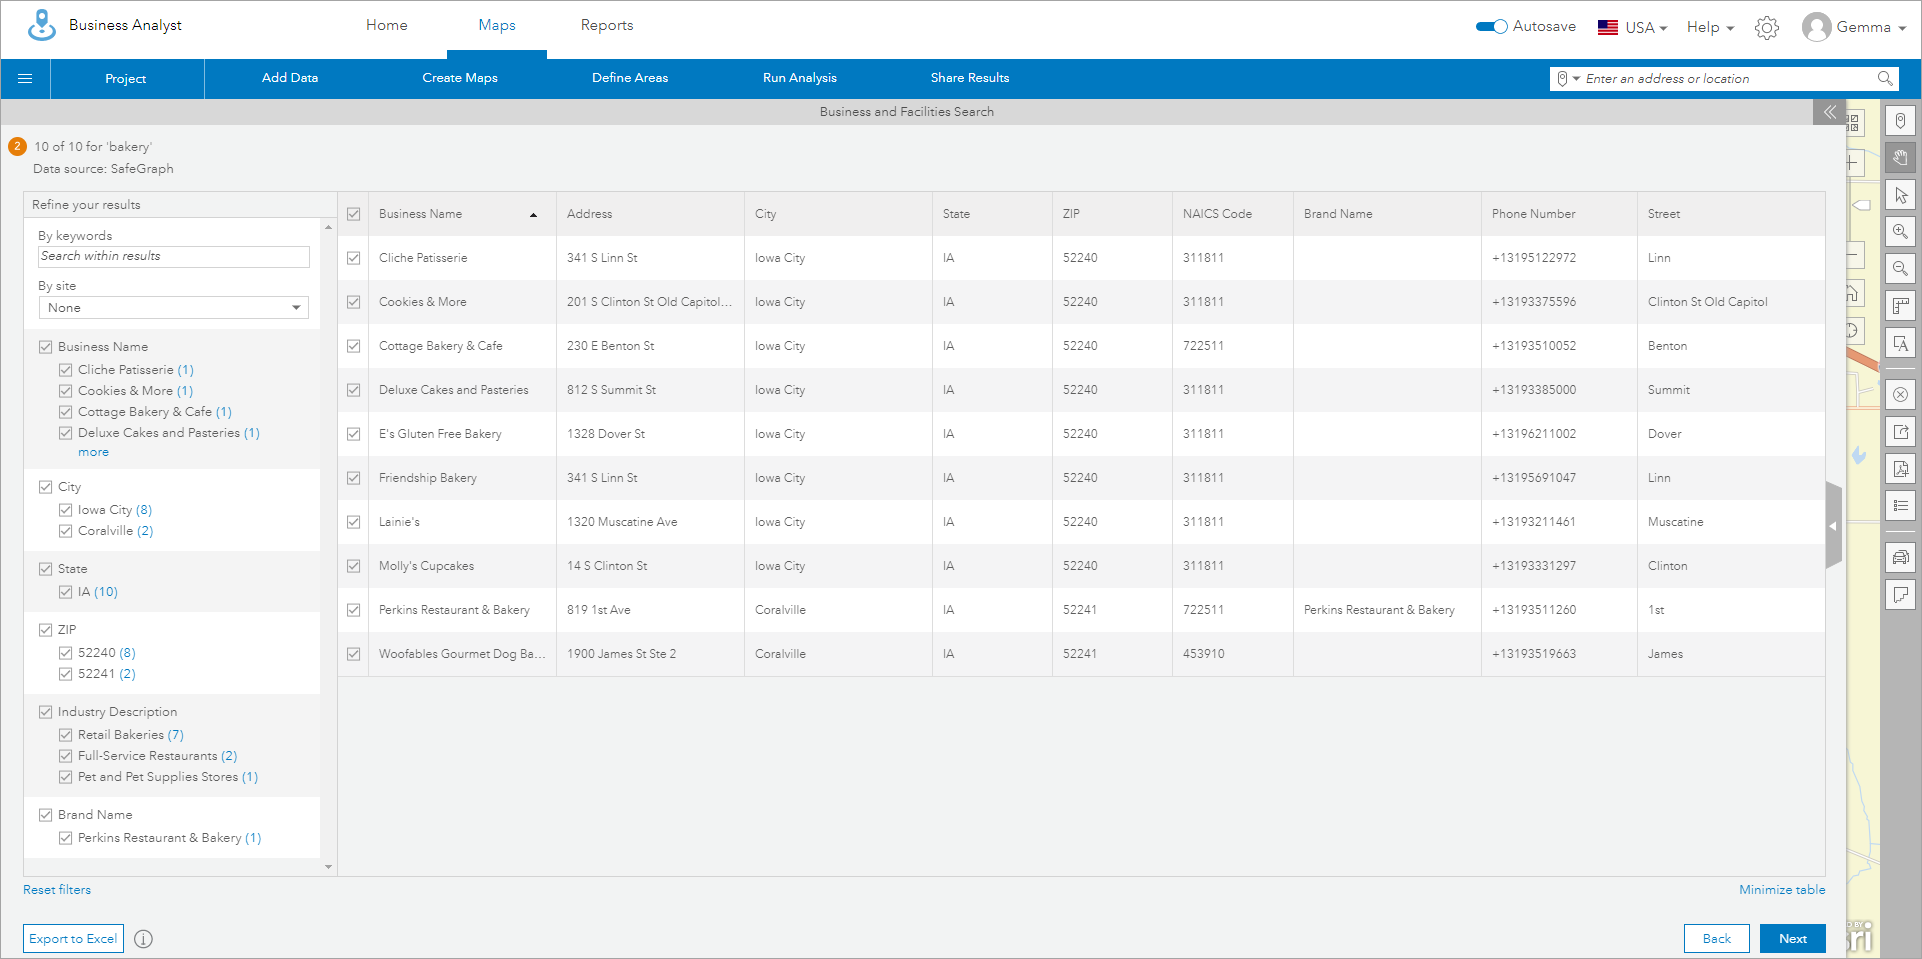
- Click Go to see businesses listed by SafeGraph attributes, including name, city, industry description, and affiliated brand. Click the arrow on the right of the search results to view the attribute table.
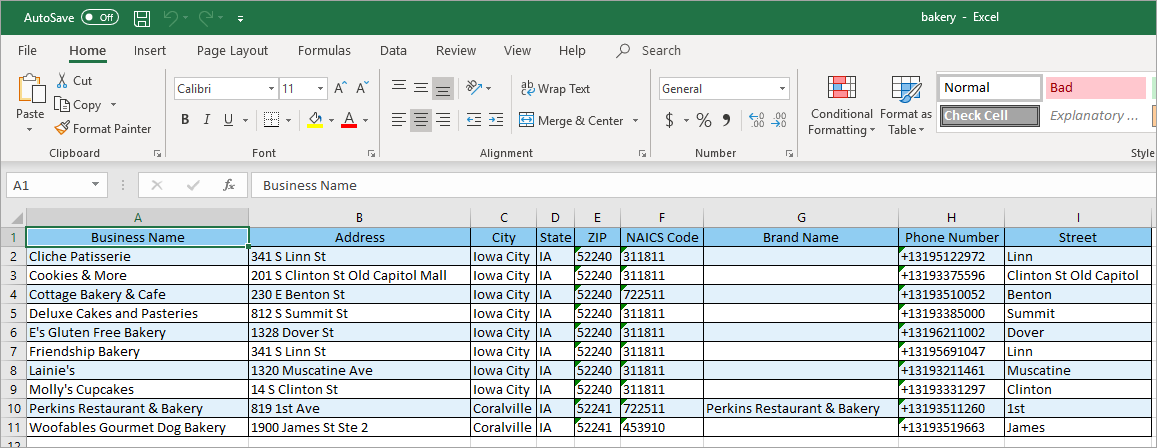
- Export the information to a spreadsheet with full business addresses and phone numbers or incorporate this information into popular Business Analyst workflows, such as Suitability Analysis.
For more information about working with SafeGraph data, visit the Business Analyst help documentation about Business and Facilities Search, Void Analysis, infographics, and default settings.
Improved sharing options
Teams formerly coworking in office spaces continue to find new avenues for productivity in work-from-home settings. The September 2020 release of Business Analyst includes sharing options that make collaborating, whether in-person or virtually, smoother than ever. You can now share individual layers within a project rather than sharing the entire project.
- In Maps, click Share Results. Select ArcGIS Web Map.
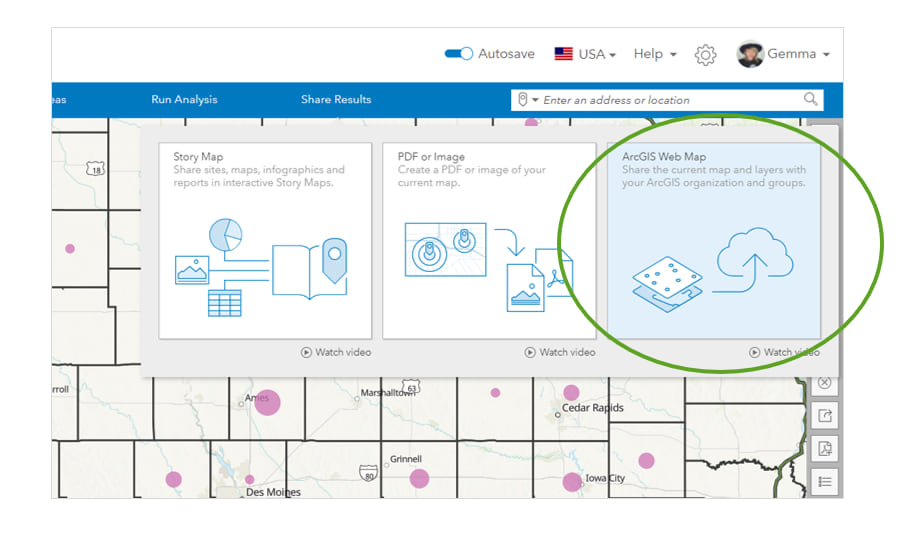
- In the Share Map dialog box, in the Select layers to share section, choose specific layers within your project.
- In the Share map with selected groups section, select an organization or groups to share access to the selected layers.
- Under Enter map details, enter a title in the Title field. The name of your new hosted feature service will be auto-populated with the title you entered. Check Export map layers in a new hosted feature service. Click Share. The information is exported as a new hosted feature service.
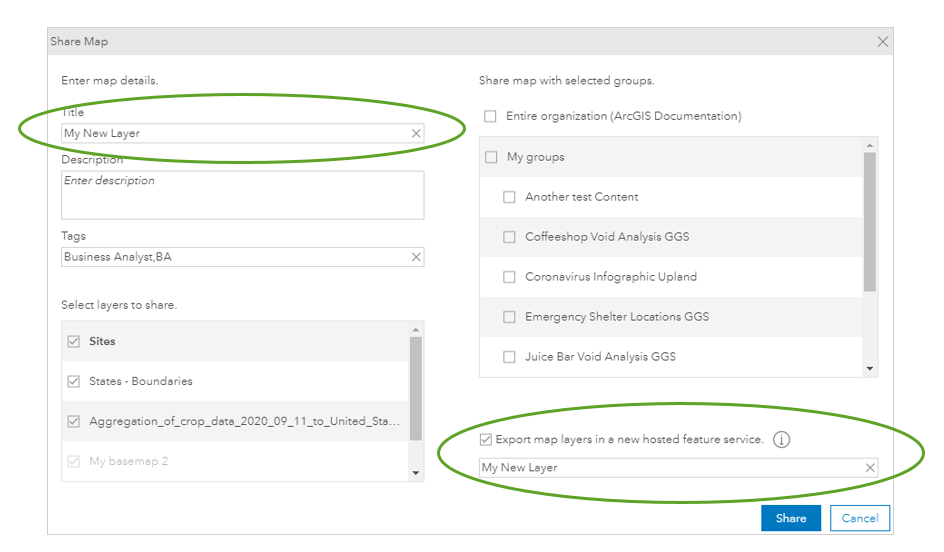
- Once the map layer has been shared, you will see a modal. Click the link Click here to access the map to view your shared content.
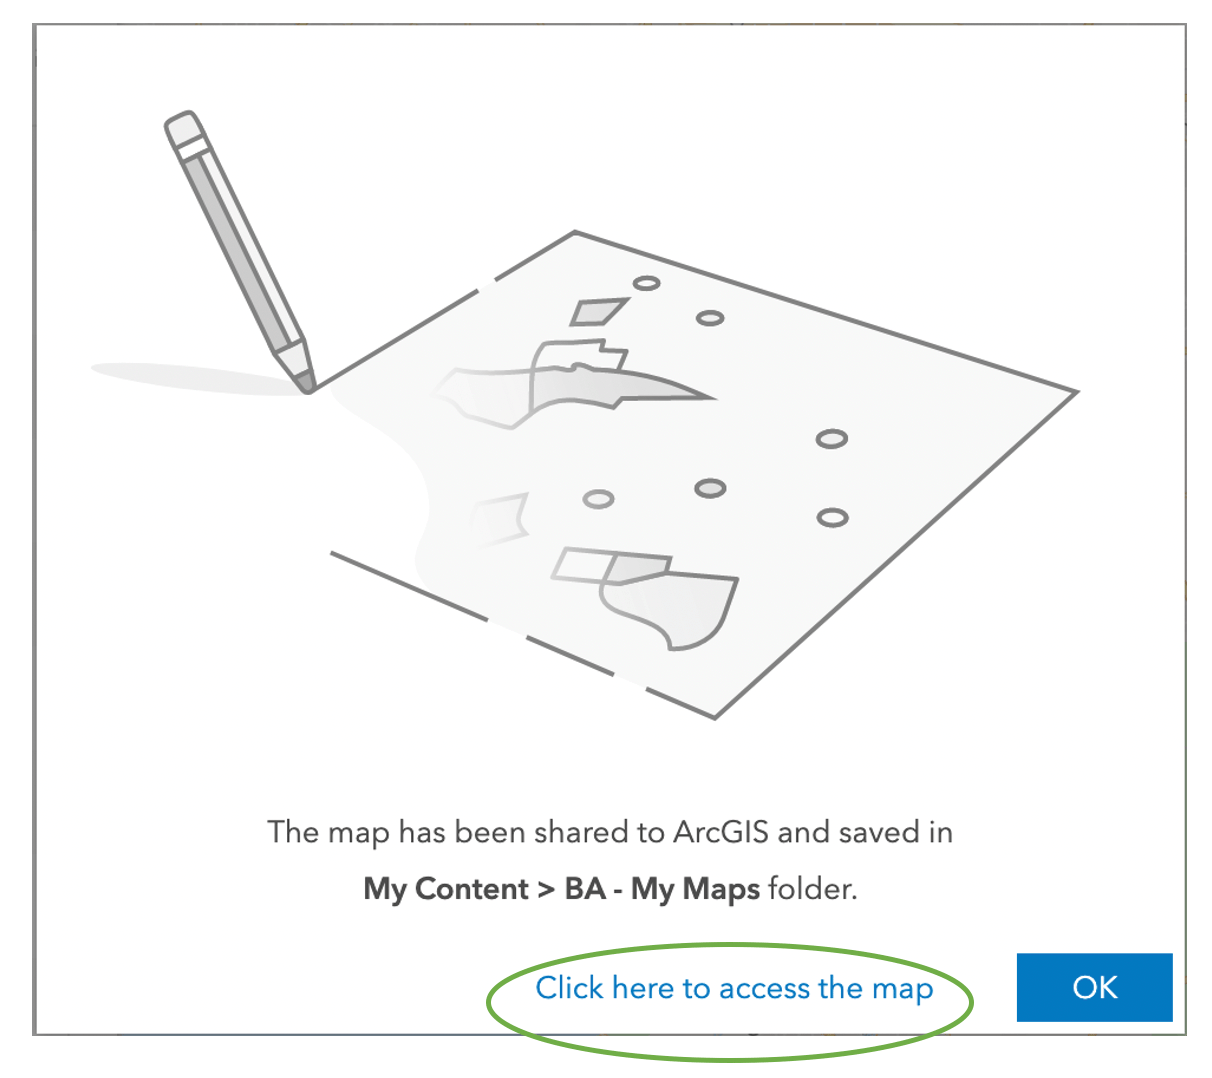
The new layers will be visible in your ArcGIS organization’s My Content > BA – My Maps folder as new hosted feature layers. For more information about these sharing options, visit the Business Analyst help documentation about sharing sites, maps, and layers.
For example, you may be a market analyst for a company that is assessing the plausibility of future store locations. Your job is to validate potential sites. These updated sharing options allow you to select relevant portions of the project list to send to your on-site auditors as they meet with clients.
Infographic viewing optimized for phones and tablets
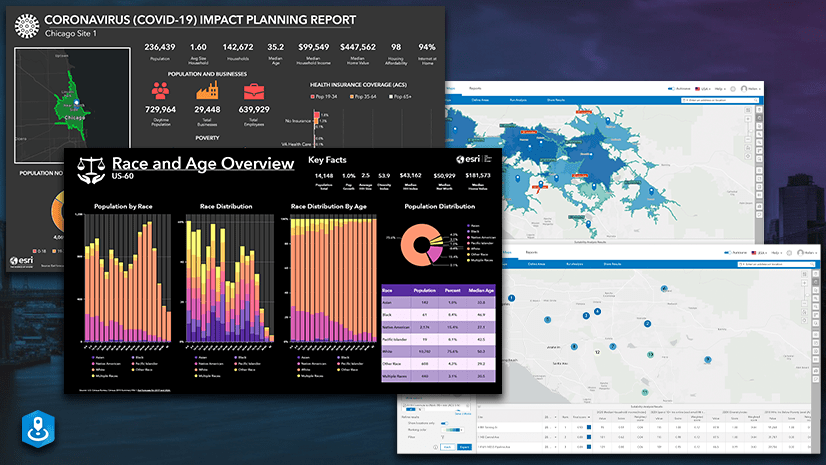
Infographics, one of Business Analyst’s most popular features, are now optimized when viewing on mobile devices using Business Analyst Mobile App. The September 2020 release ensures that your infographics look great and function well in any digital setting. Infographics automatically appear in full-screen mode when you rotate your tablet screen to landscape orientation. Previously, infographics were only viewable in portrait mode and did not respond to changes in tablet orientation.
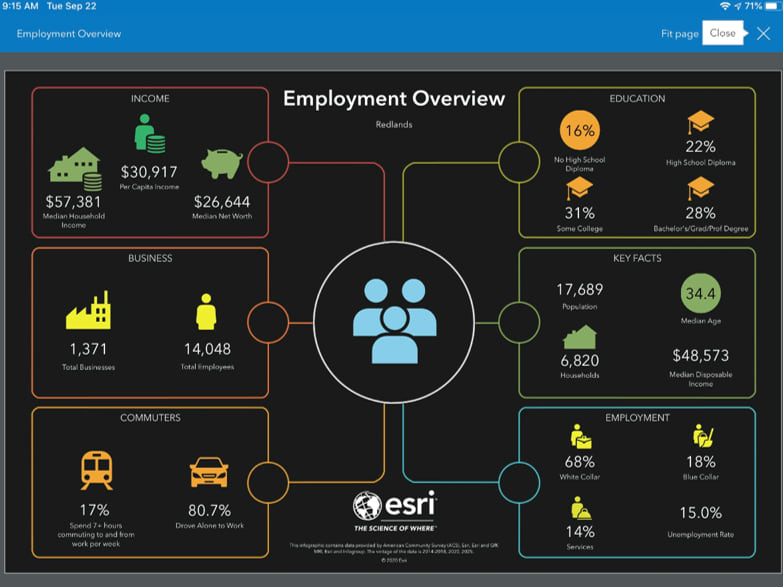
For example, you work at a nonprofit providing employment coaching for under-employed citizens. You are on-site at a job fair and want to show job applicants an Employment Overview infographic for their region. You can use your phone or tablet to display full-screen infographics with high readability and full functionality.
- On your tablet, select a site by searching a location or by tapping a point on the map. Tap Create Site.
- Enter a radius distance, drive time, or walk time. Tap Apply.
- Tap the site menu and select Run Reports.
- Select Infographics and choose a template from My Infographics or Esri Infographics. The infographic opens in the orientation (portrait or landscape) you are holding your device.
- Optionally, rotate your device to view in portrait or landscape mode.
Additionally, a small-screen version of your infographic appears on mobile phone screens rotated vertically. This update ensures that your infographics will not be fragmented or have blank space when viewed on phones. You can change these settings.
- On your phone, create a site on Business Analyst Mobile App.
- Create an infographic by tapping your site and selecting Run Reports > Infographics. Choose a template from My Infographics or Esri Infographics. The infographic automatically opens on your phone screen in an optimized viewing mode.
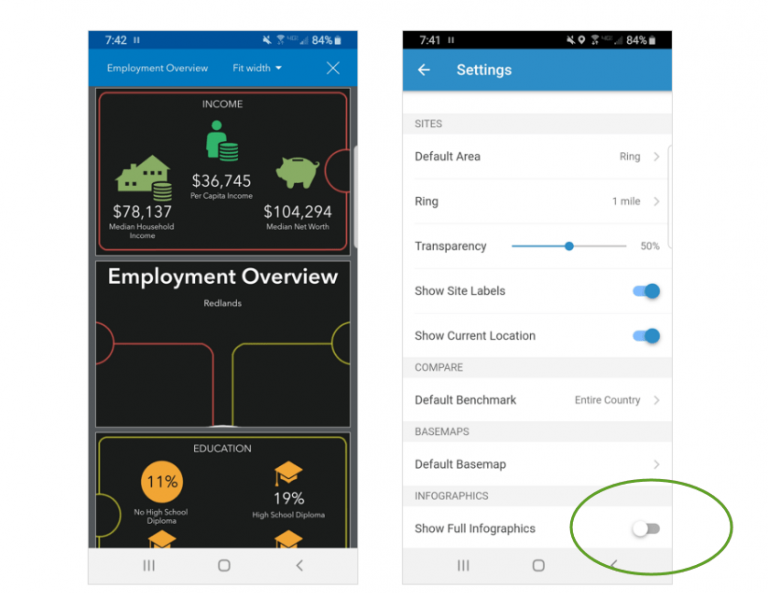
If you prefer to view the traditional full infographic layout on your phone, complete the following steps:
- Change your viewing mode by opening the app’s main menu and tapping Settings.
- At the bottom of the screen, turn on Show Full Infographics.
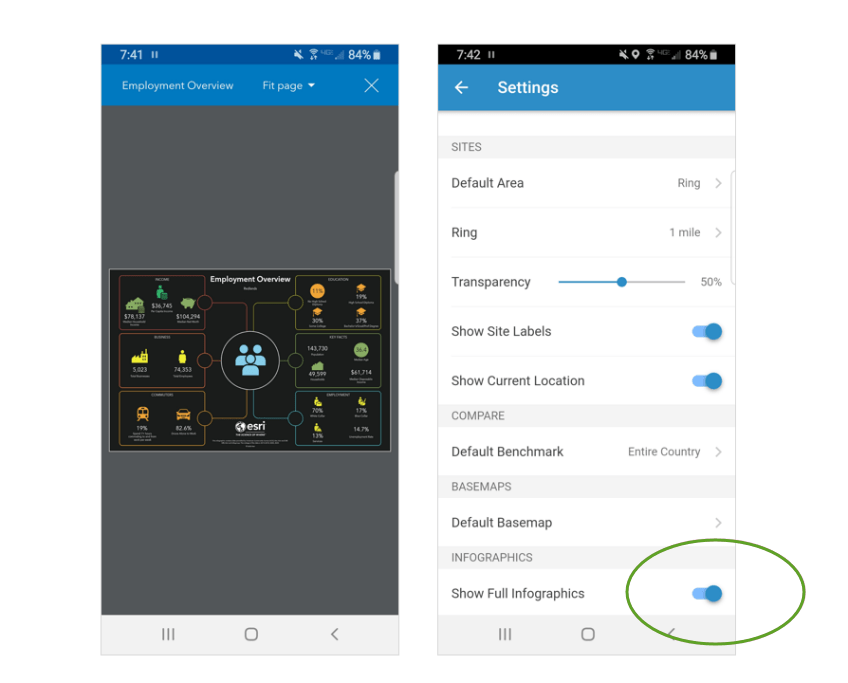
For more information about these viewing options, visit the Business Analyst help documentation for mobile reports and infographics, mobile settings, and what’s new in Business Analyst Mobile App.
Demographic content updates for Canada, Germany, and USA
The September 2020 release also includes demographic content updates for Canada (Environics) and Germany (Nexiga), as well as updated business, shopping center, and traffic locations for USA. To read more about the data included in Business Analyst and how often it’s updated, you can read more on our ArcGIS Business Analyst data documentation page.
Banner image by Levon Vardanyan on Unsplash.


Article Discussion: