
With the recent release of ArcGIS Pro, we’re excited to bring you seven new features to use directly in the ArcGIS Business Analyst extension for ArcGIS Pro. Many users have been asking for these new features and we’re happy to deliver them to you.
This is the first blog in an eight-part series that highlights new capabilities in the Business Analyst extension for ArcGIS Pro Feb. 2020 release. We’ll be releasing a new blog each week for the next seven weeks, covering new tools and features. Though we’re only covering the Evaluate Site workflow in this blog, you can view the other blogs in the series as they’re released here.
Evaluate Site
Whether your site is an existing store, a proposed new clinic, or a community center in development, you need to evaluate the site based on characteristics important to you. In the recent past, the process to uncover insights about a site took multiple tools and steps. Now, the process has been combined into a single workflow and just three steps:
- Find a point.
- Define the area.
- Run analysis.
To see the process in action, we’ve created the two-minute overview video below. Check out the video and then rejoin me for an example and helpful links at the bottom of this blog.
After launching ArcGIS Pro, you can access the Evaluate Site workflow from the Business Analyst menu. Once there, just find a point by typing in an address or clicking on the map. Next, define a trade area with rings, drive time, or network distance. Lastly, run your analysis with infographics, summary reports, or by enriching the layer. This will give you an informed, initial understanding of your site.
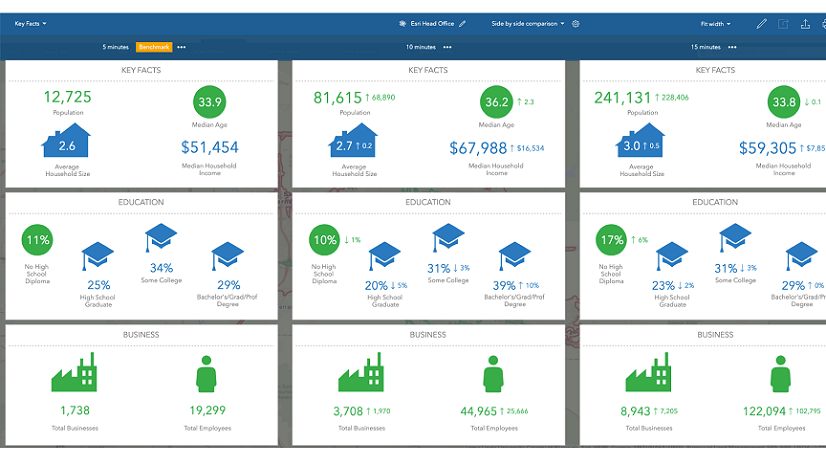
Business example: Sonny is an analyst at a commercial real estate agency in Chicago. He’s particularly interested in a new property in the Lake Shore East Park area of downtown Chicago and wants to evaluate the potential site. After launching the Evaluate Site tool in the Business Analyst extension for ArcGIS Pro, Sonny types in the address, chooses a 15-minute walk time around the site and selects an infographic template. After the infographic is generated (example below), Sonny gains a better understanding of the demographics around the area. This infographic can be used to make decisions about how to move forward. Of course, he can also share it with his colleagues across the organization.

Additional Business Analyst for ArcGIS Pro Resources
You can read more about the Evaluate Site tool in the Business Analyst extension for ArcGIS Pro documentation.
If you’re interested in reading the rest of the blogs in this series, click here.
Bookmark these ArcGIS Business Analyst Links:
- Business Analyst product overview page
- Business Analyst resources page
- LinkedIn user group
- Business Analyst YouTube playlist
- Business Analyst GeoNet community
- Esri global data overview
- Esri U.S. data overview
We are so very happy to share the new tools available for ArcGIS Business Analyst. If you have questions about this tool or any of the tools in the upcoming blog series, please reach out via the email address below.
- Email the team: businessanalyst@esri.com

Hello and thanks for the good information on the embedding process. I have read the blog, but I am having trouble with getting a “guided tour” app put inside another App. I have practiced using another App I have to embed in the current app, but it is not seamless. I mean one has to click “Open” to bring up the App, instead of it just automatically opening and fitting into the original App.
I can send you some images if that would help to show you what I mean.
Hi Mark, I think we might want to move this question to the StoryMaps GeoNet space, where we can easily share screenshots for better clarity. It sounds like you’re trying to embed a story that includes a guided tour block into another story? Or a different configurable app? If you can start a new question thread on GeoNet and provide some images as well as a few more details, my teammates and I will be better able to assist. Thanks!
Hi Hannah, in your article you mention photographs are not interactive but I wonder if it is possible to embed 360 images via an embed code – e.g Google Tours
Paddy,
Good catch! Using an iframe code (which Google provides) to embed a 360-degree photo does indeed allow interactivity with that photo. See this demo story.
Dear Hannah,
Any chance you can help me with an embedded vimeo video? I’ve embedded it into a sidecar container with an autoplay function
. And it works perfectly fine in the editing mode – the video just starts playing automatically. However, the autoplay is not working in a published story. When I scroll to a point when the video appears there is no autoplay action and I need to press a play button in order to make it play. Any chance this can be fixed?
Thank you!
Taras
Hello Hannah! Thank you for an excellent post. I work as a tech support analyst @ Esri Sweden. I have a customer who used this technique to embed photos and show them as cards. But after the latest update of StoryMaps, it seems like this is not an option any more 🙁 It seems like StoryMaps recognize the URL as an image and therefor does not present the same functions as when embedding other content. The customer really want their image to be shown as a card, but we can not find a way. Do you have any suggestions for… Read more »