The year is winding down and that means that the final ArcGIS Business Analyst release of 2024 is here! We are thrilled to announce the latest updates and enhancements to ArcGIS Business Analyst Web App, ArcGIS Business Analyst Mobile App, and ArcGIS Community Analyst. This quarter has been a busy one for the Business Analyst team, so hold on tight and get ready to dive into the latest, greatest product updates to improve your workflows.
ArcGIS Business Analyst is Esri’s location-based market intelligence tool designed to help you make smarter decisions for market potential planning, site selection, and customer segmentation. You can identify under-performing markets, pinpoint the right growth sites, locate your target audience, and share the market research across your organization. If you’d like to learn more or want to try ArcGIS Business Analyst Web App, sign up for a 21-day free trial.
The November 2024 release includes loads of new features and enhancements to your favorite workflows, including:
- New benchmark comparisons workflow
- New USA school district boundaries
- European Cross-border Data (Beta)
- Enhancements to point of interest (POI) search
- Additional workflows and docking options available in Business Analyst Assistant (Beta)
- New infographics and improvements
- Data updates
- Other enhancements
- ArcGIS Business Analyst Mobile App
- Business Analyst widget in ArcGIS Experience Builder enhancements
- ArcGIS Community Analyst deprecation
Keep reading to learn all the details on how you can employ these new features in your daily mapping and analysis.
New benchmark comparisons workflow
In the November 2024, release, benchmark comparisons replaces comparison reports. The previous chart-based workflow has now been integrated into the map to offer enhanced analysis and visualization capabilities and is accessible from the Maps tab in the Run analysis menu.This new workflow is available with both Standard and Advanced licenses and includes industry-specific variable lists, a new Results pane, and incorporation of more comparison methods for statistical analysis.
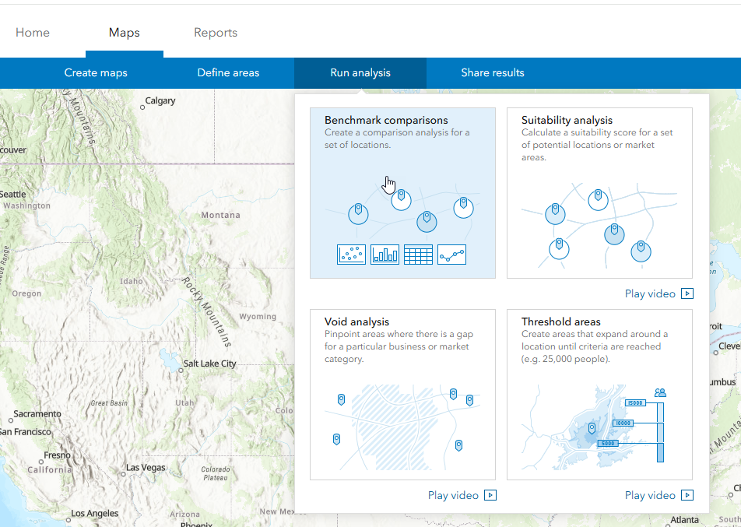
You may notice that the first few steps in the new workflow match our redesigned workflow for suitability analysis. The Business Analyst team is continuing to streamline designs for ease of use across workflows, including providing the Results pane with quick analysis, statistics, and visualizations. To improve your analysis, you can now view your comparison results while visualizing the features on the map at the same time. And just like our other mapping workflows, benchmark comparisons can be used directly with geographies and hexagons without the need to create sites first. You can quickly compare up to 10,000 features at one time.
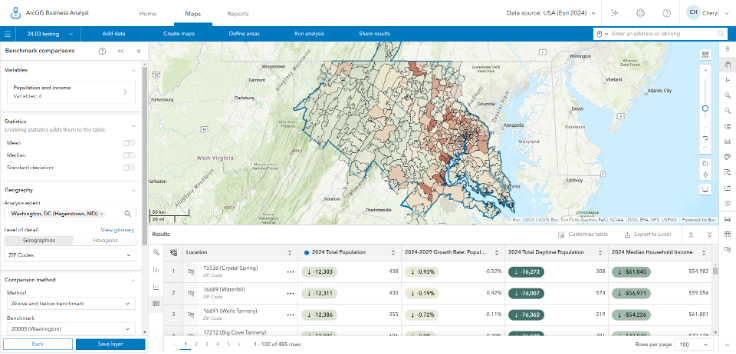
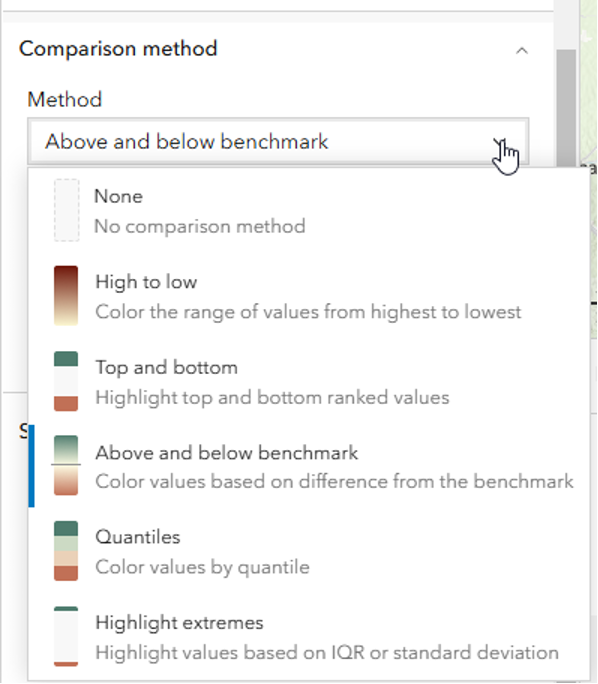
Select comparison methods such as high to low, top and bottom, quantiles, standard deviation, and outlier highlighting.
Once your analysis is complete, easily export the table including raw data and all the available comparison methods to Excel. The comparison method tabs include default styling in each spreadsheet to help interpret the results.
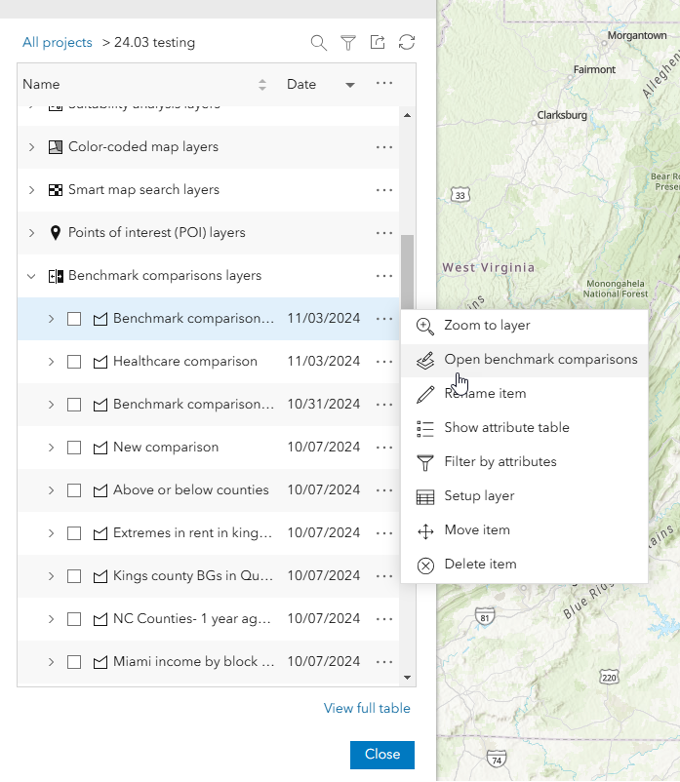
Do you have a favorite or frequently used benchmark comparison? Great news! You can now save variables and site layers for future reuse to streamline your work. Saved layers can be found in the project contents, in the section for Benchmark comparisons layers.
New USA school district boundaries
In addition to the wealth of data enhancements available in this update, the Business Analyst team has introduced even more datasets and boundaries to explore. We have added three geography levels for school districts to our collection of authoritative geographic boundaries: Unified School Districts, Elementary School Districts, and Secondary School Districts. You can use the Info icon in the select geography workflow to see a detailed description of each level in the in-app glossary.
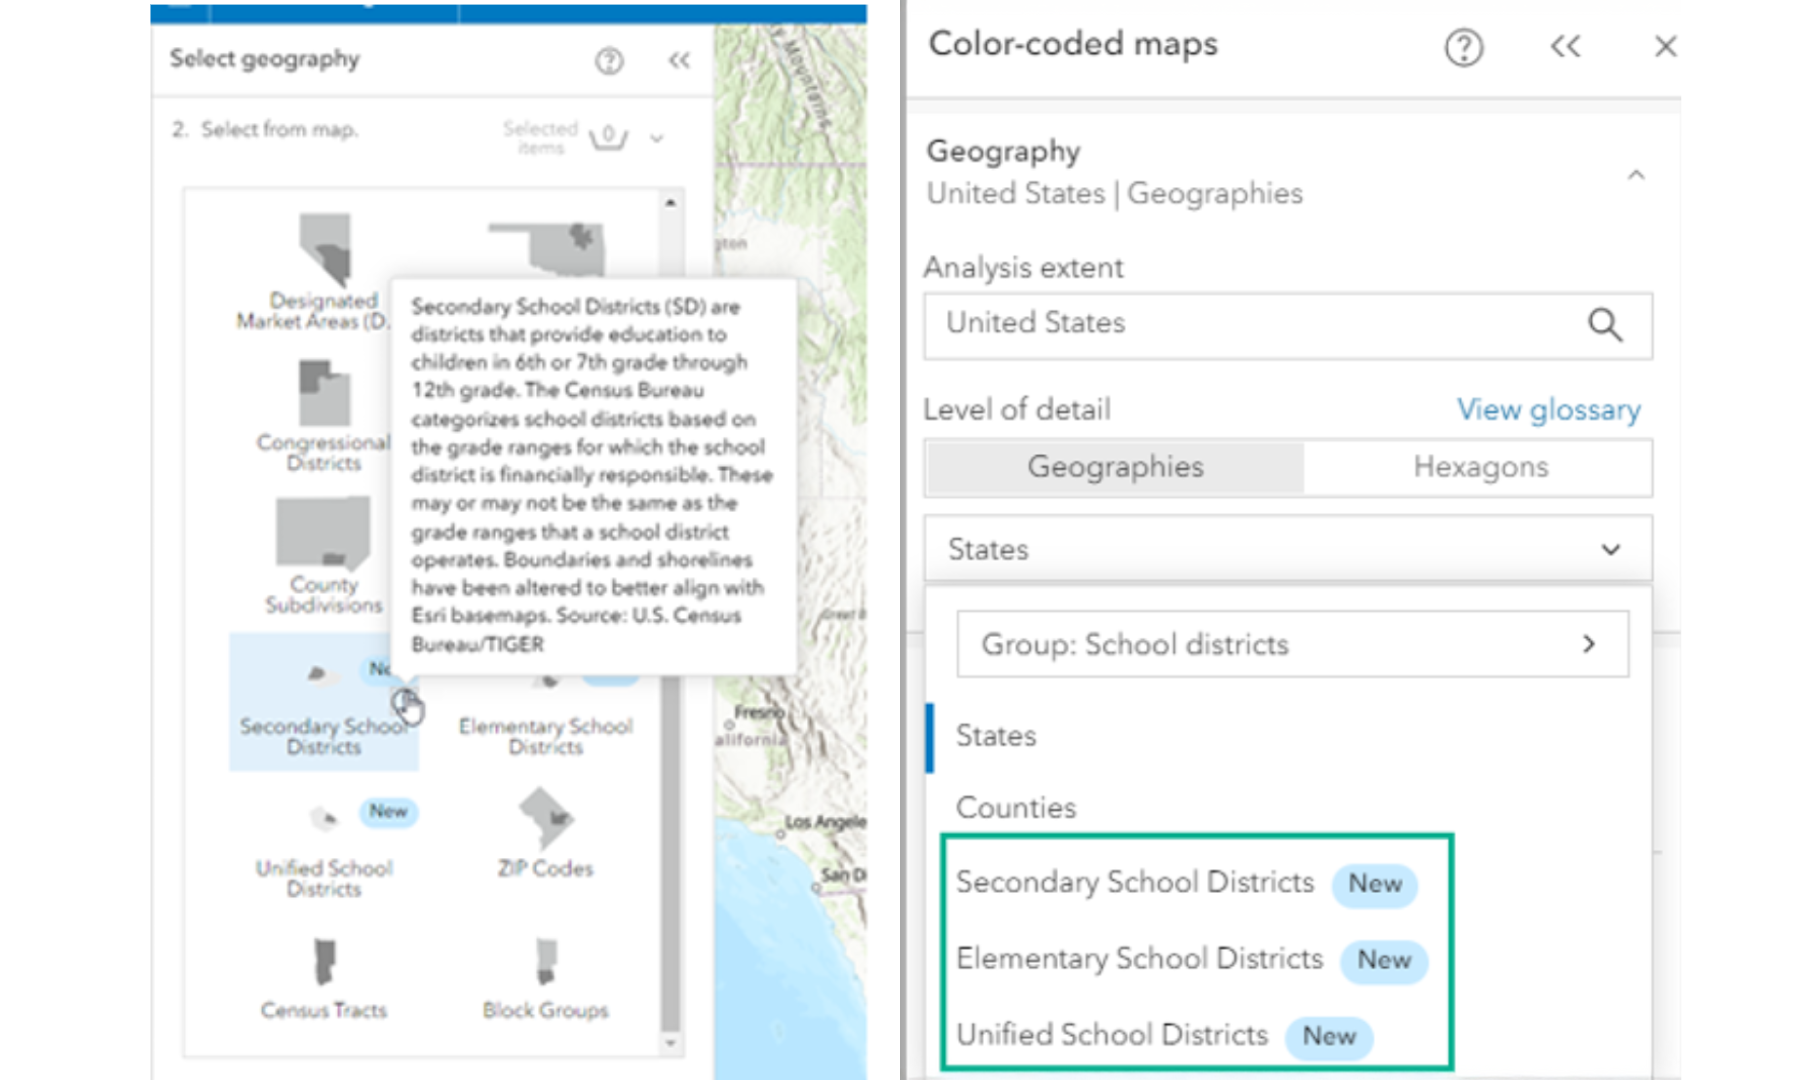
School district boundaries are available for your mapping and analysis in all workflows that use geography levels. Look for the New label on these levels when accessed through relevant workflows and use them in mapping workflows or to create sites when choosing a level of detail. To help support these new geography levels, we have also updated our mapping workflows to make all geography levels available through the Geography section.
European cross-border data (beta)
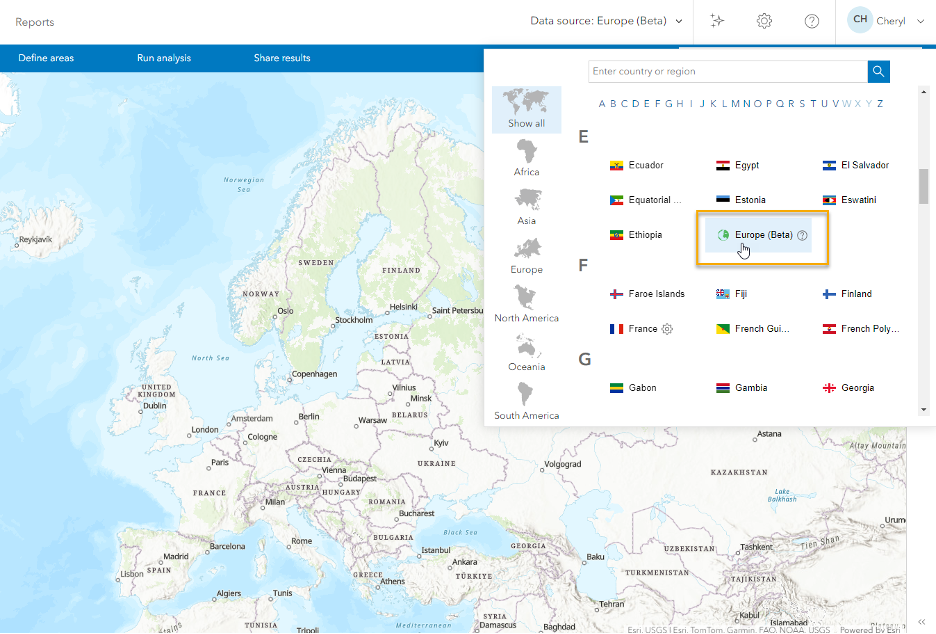
Looking to conduct cross-border analysis? Good news, the Europe (Beta) data source has now been introduced! This dataset covers 39 countries and can be used for mapping, running reports, and performing analyses that span country borders. This new cross-border dataset is available for use in popular workflows using hexagons or standard geographies. You can access this new dataset in the Data source drop-down menu.
Enhancements to points of interest (POI) search
Want smarter search results? The Business Analyst team is on it! ArcGIS Business Analyst provides information about specific locations – such as businesses, government buildings, landmarks, tourist attractions, and more through points of interest (POI) data. With POI data, you can identify key businesses and community locations, plan for future expansion, identify market gaps, and perform competitive analysis.
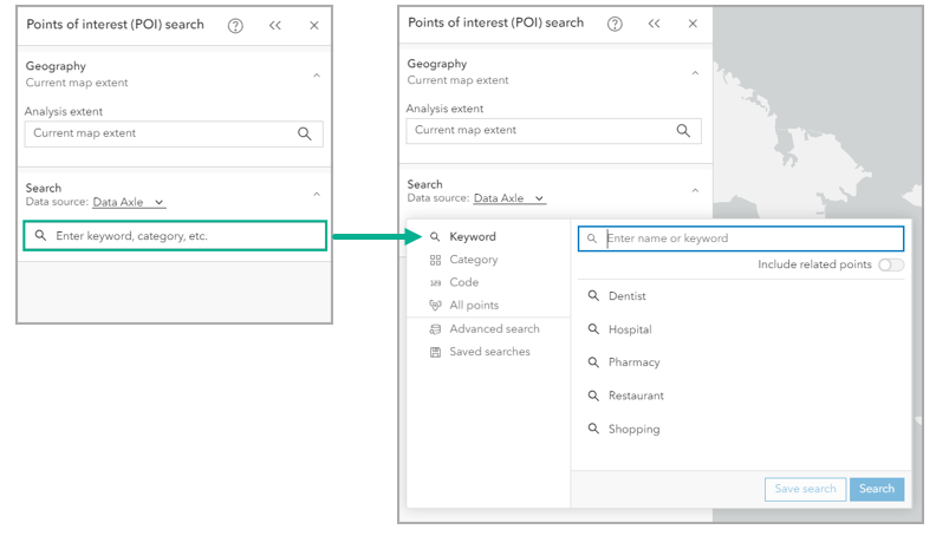
With this release, users will be thrilled to know that the POI search workflow is even better. Enjoy a new advanced search that uses conditions to enhance search queries. This enables users to set filters before initiating the search for a more efficient search experience. Click the Enter category, keyword, etc. field and use the tabs to search by category, keyword, or code, and optionally add all points, add an advanced search, or browse saved searches.
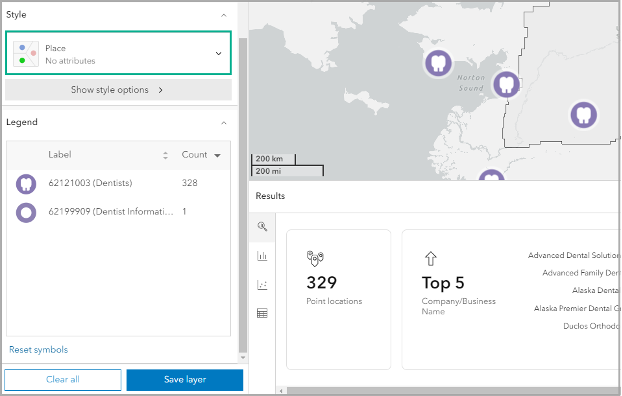
Take customization even further with new Places icons available for map styling. In the Style section, use the Places map style to apply unique point-based symbols based on location type. These new icons are the same icons used in the ArcGIS Places API. For this release, you can access the new Places map styling when working with Data Axle, SafeGraph, and Foursquare data sources.
Additional workflows and docking options available in Business Analyst Assistant (Beta)
This June, the Business Analyst team proudly unveiled the beta launch of Business Analyst Assistant, a significant leap forward in our technological journey as we strive to keep pace with the swift advancements in artificial intelligence (AI). This AI productivity tool guides you through your workflows by providing intelligent suggestions, responding to prompts and search queries, and guiding you through the app using tips and resources.
The most recent update expands the capabilities of Business Analyst Assistant (Beta), which now supports smart map search and find location workflows. To perform these workflows, use the Next button on the Assistant window and check out the new Create a site and Find areas prompts. The Create a site prompt suggests creating a map that highlights areas based on variable values.
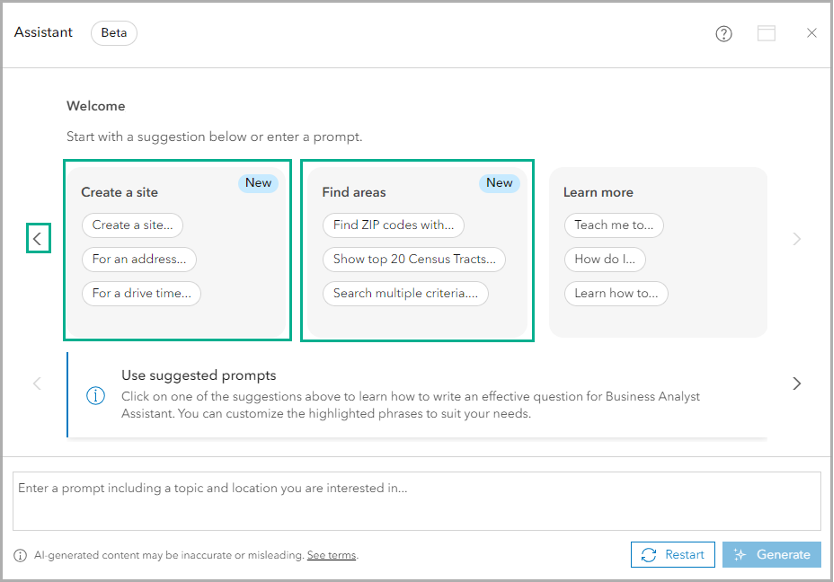
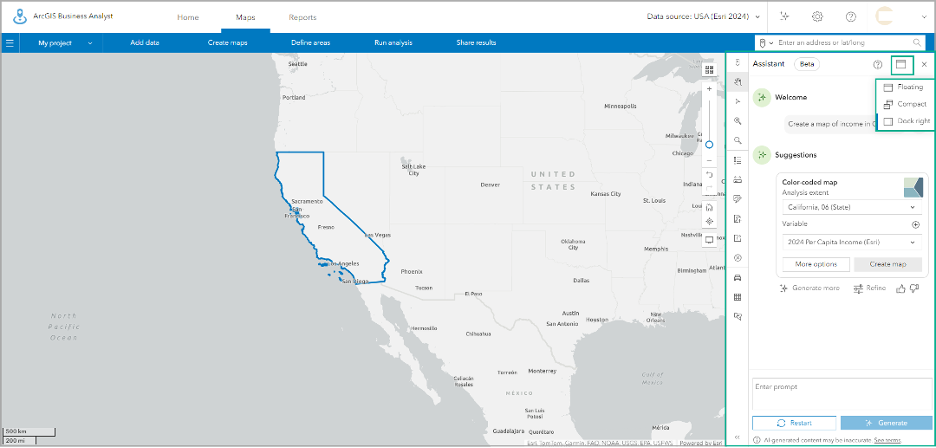
Additionally, the assistant now offers multiple docking options, enhancing organization and providing users with more flexible viewing choices. After generating results, you will see the assistant automatically docked in the right side of the app. Use the Display options to change the position from Docked to Compact or Floating. When using Compact or Floating, you can drag the assistant to your desired location on the screen.
Note that access to beta and AI assistants are now administered at the ArcGIS Online level. This means ArcGIS Online administrators, or those with administrator privileges, must opt-in to enable use of generative AI capabilities. For more information on how to enable Business Analyst Assistant (Beta) visit the help documentation.
New infographics and improvements
We know how much everyone loves infographics as a tool for visualizing complex data into unique, presentation-ready reports that summarize key indicators and information for easy display on your sites.
That’s why with this release we proudly unveil several new Standard and Gallery templates for your use. For this release, there are 16 new Standard templates and 10 new Gallery templates. These templates are open to enhancement based on feedback. Please use the feedback option at the bottom of this blog article or post on Esri Community.
Let’s highlight some of our new infographics!
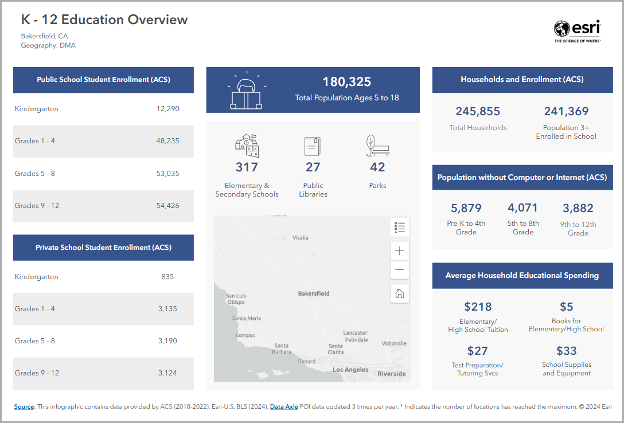
New! K-12 Education Overview
We are excited to highlight the new K-12 Education Overview Standard infographic. This infographic may be useful for businesses in the educational services sector looking to better understand student needs in a community.
New! Urbanicity Type
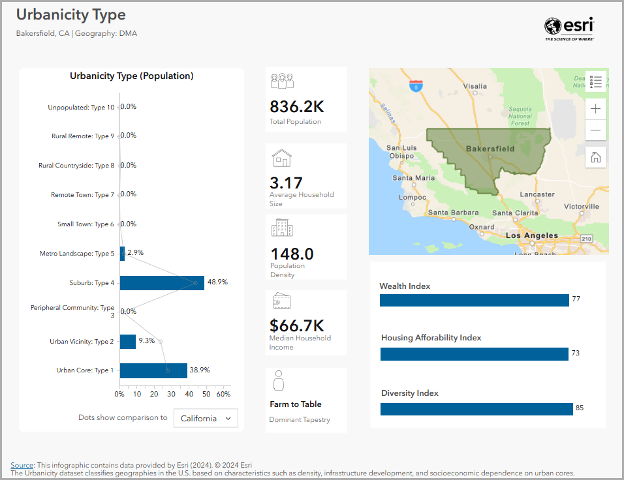
We are introducing a new Gallery template: Urbanicity Type. This infographic uses the new Esri Urbanicity Type dataset. Urbanicity refers to the degree of urbanization in a specific area ranging from highly urban environments (like big cities) to rural settings.
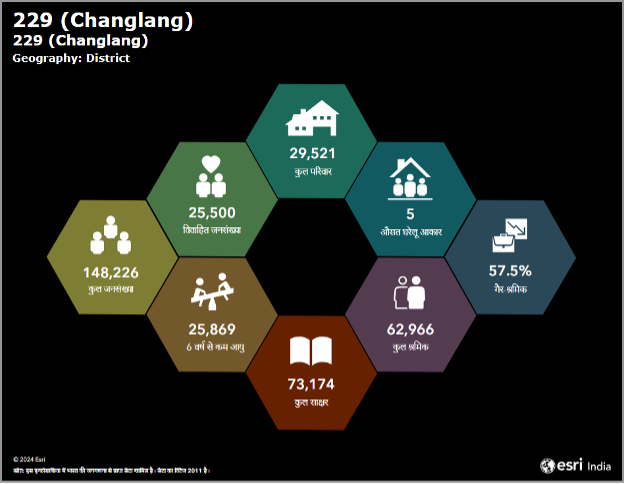
दी बुनियादी तथ्य (Hindi version of Basic Facts)
We have a new Standard template for Esri India: दी बुनियादी तथ्य. This template is a Hindi version of the Basic Facts infographic.
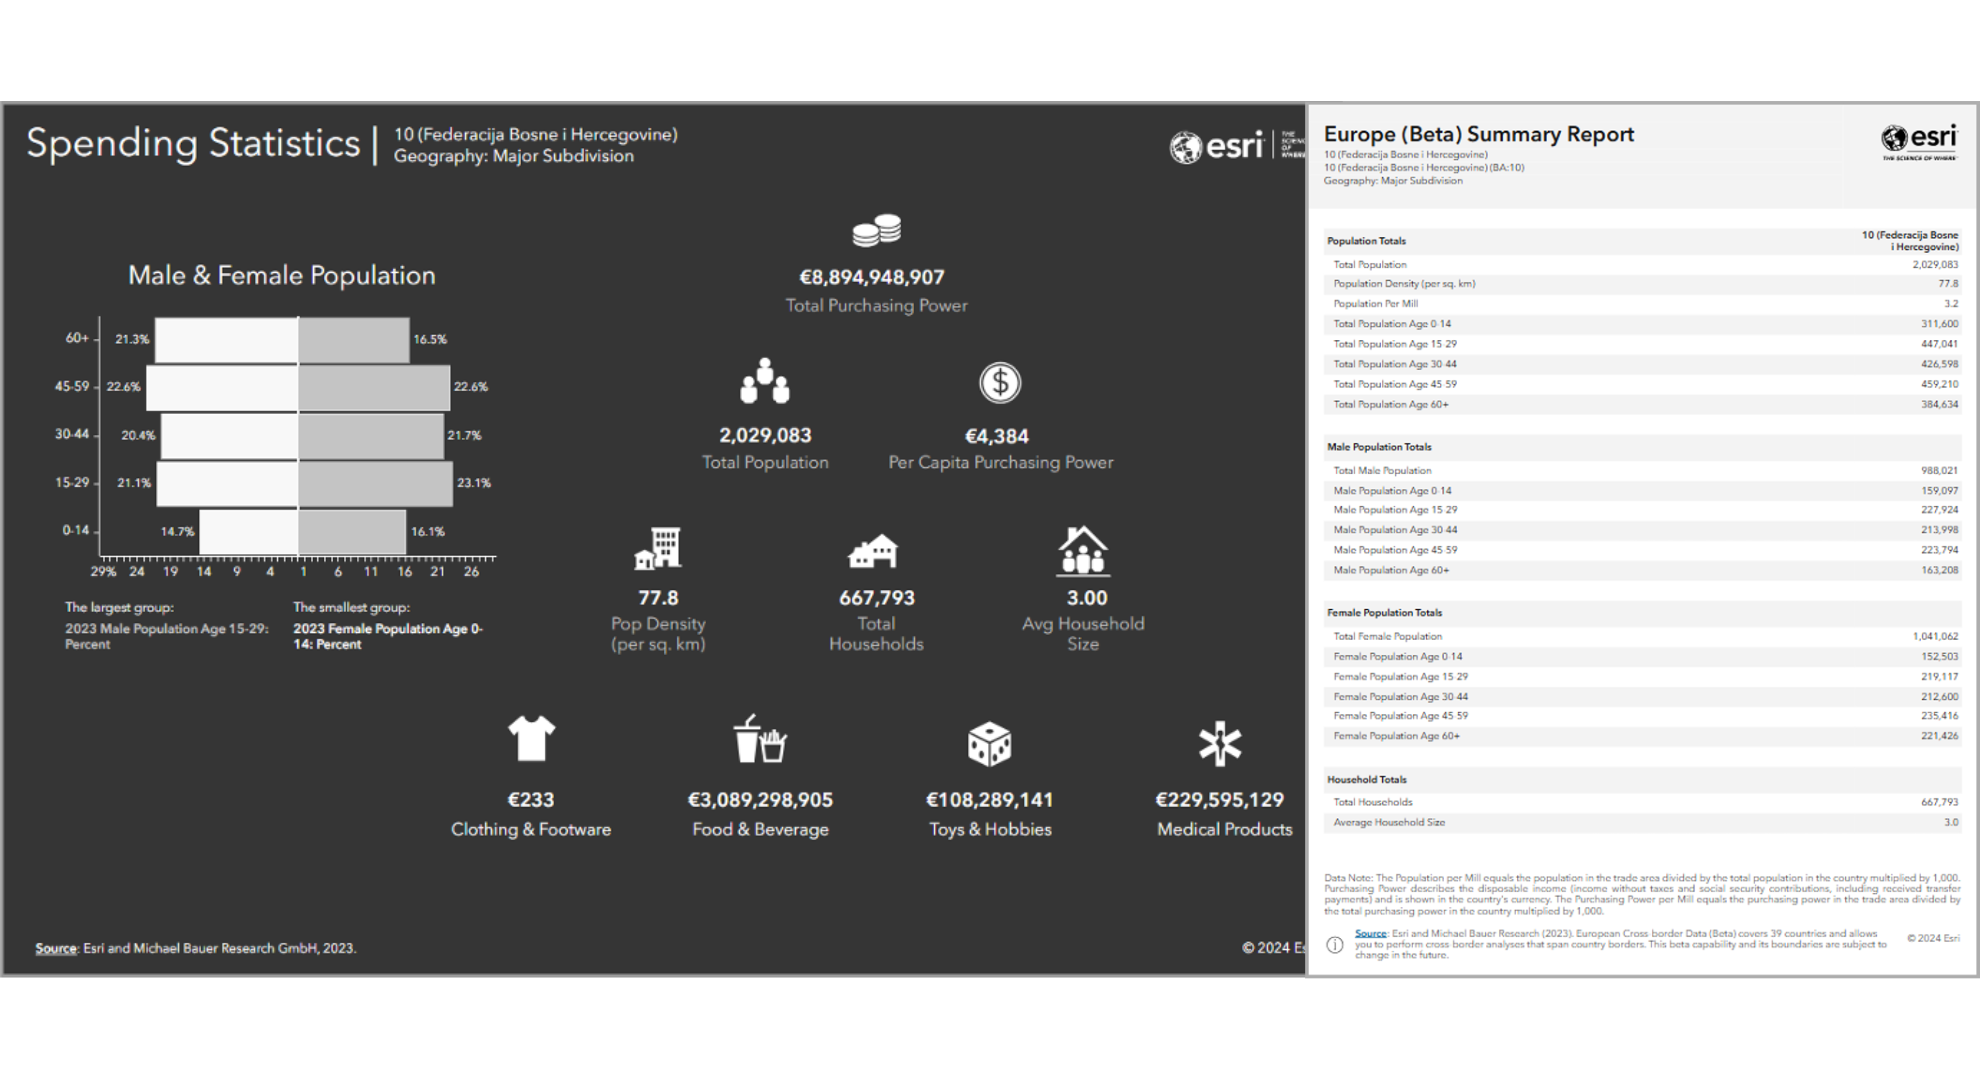
Two new templates for the Europe (Beta) data source
For our first cross-border data source, we created two new infographics. Use Spending statistics for an overview of population and spending by category. Use Europe Summary Report (Tabular) for a data table of demographic information, including population totals and expenditures by category.
For more details on infographics and how to use them, discover the following blog articles:
- Learn about infographics in ArcGIS Business Analyst Web App and Community Analyst
- Exploring the infographics gallery in ArcGIS Business Analyst
Data enhancements and deprecations
We know that Business Analyst would be nothing without data, and the latest release means we’ll be saying hello to some exciting new datasets to aid in your mapping and analysis. This release includes updates to the following datasets:
- Advanced Demographics: Canada 2024 (Environics Analytics), India 2024 (Esri India).
- Standard Demographics from Michael Bauer Research for 18 South American and Oceania countries (2024).
- Points of interest data (POI) from Data Axle (June 2024) for U.S. and Canada.
- Points of interest data (POI) from SafeGraph (August 2024) for U.S., Canada, and Puerto Rico.
- Global POI data from Foursquare (August 2024).
- USA Business Summary from Data Axle (June 2024).
- USA Traffic data from Kalibrate (Q3 2024).
Also new to the release is Esri’s Urbanicity Type dataset.Urbanicity is the level of urbanization in a particular area, ranging from “urban cores” (i.e. Manhattan, Los Angeles, other dense areas, etc.) to rural communities. This data is a classification system that designates land into one of 10 urbanicity categories that share characteristics such as density, Infrastructure development, and socioeconomic dependence on urban cores. Users can now leverage urbanicity data in workflows such as site-location selection and analysis.
Now with the addition of all this new data, we do unfortunately have to say good-bye to some older data offerings. Esri will be discontinuing the 4orange data offering for the Netherlands. Customers must prepare to transition their workflows and processes to Esri’s Michael Bauer Research (MBR) data for the Netherlands as an alternative dataset.
Additional enhancements
That’s not all, we packed even more enhancements and improvements for you into Business Analyst Web App. Some of these enhancements include:
Smart map search:
We love customization and we know you do too! In the smart map search workflow users can now customize the style of both matching and non-matching areas by adjusting their fill and outline.
Results pane:
Our popular Results pane feature now allows for expansion to provide larger views and include pagination in tables, enhancing accessibility and user-friendliness.

Help resources:
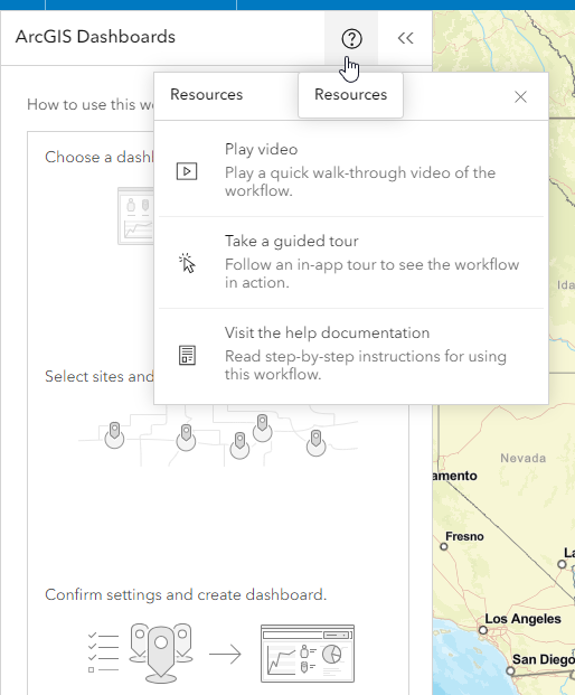
Need access to documentation and guidance while using the workflow? No worries! In our redesigned workflows, we have incorporated a Resources menu for quick access to documentation and guided tours under the Maps tab. For example, this menu has been added to the ArcGIS Dashboards workflow:
Administrative updates:
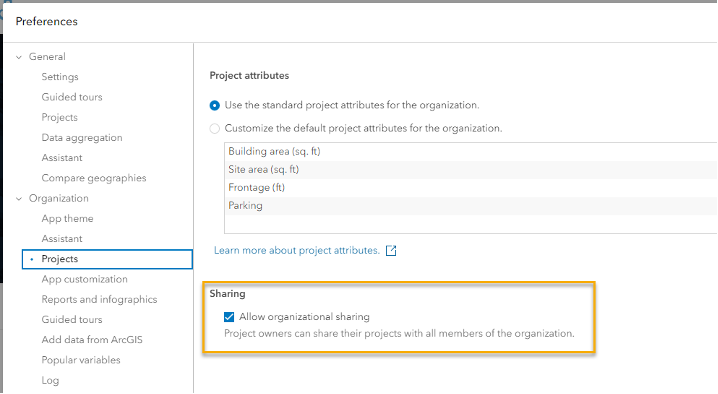
Organizational admins now have the ability to prevent users from sharing a project with all members of the organization. To do so, in My preferences, go to Organization > Projects to access the new setting. When this option is disabled, users will only be able to share projects with individual members of the organization. The option to share projects with the entire organization will not be seen.
ArcGIS Business Analyst Mobile App
Want to use ArcGIS Business Analyst on the go? No problem! Simply download ArcGIS Business Analyst Mobile App from the App Store or Google Play. In this latest update, users can view facts and run infographics and reports for school district boundary sites. Additionally, access updated data for Canada, India (Esri India), and Michael Bauer Research countries and regions, global points of interest, and U.S. traffic counts. We’ve also improved performance with several bug fixes to make focusing on your mapping journey even easier.
ArcGIS Experience Builder: Business Analyst widget enhancements & improvements
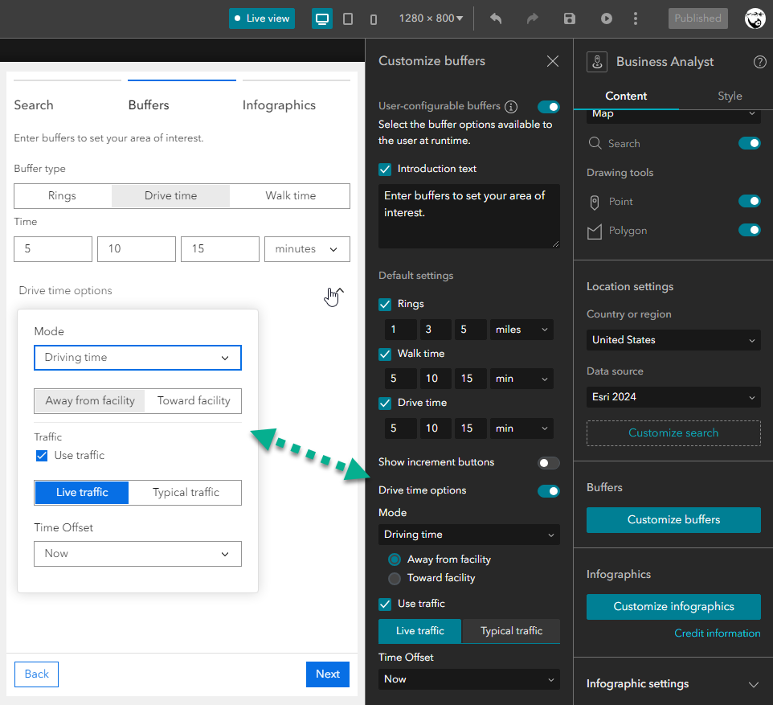
The Business Analyst widget in ArcGIS Experience Builder is a popular and well-loved tool that provides users with the ability to view additional information about any point or polygon feature on a map through the creation of reports and infographics. To better enhance your workflows, the widget now supports drive-time options that allow travel modes and traffic selection when creating drive times. We’ve also delivered several bug fixes to make your workflow even smoother.
ArcGIS Community Analyst – Migrate to Business Analyst
As you may know, we are saying goodbye to ArcGIS Community Analyst. This November 2024 release is the last and final release of Community Analyst which will be deprecated entirely. Upon commencement of the migration period starting on December 1st, Community Analyst users who have purchased one of the Business Analyst Web App products (Standard or Advanced) and have been assigned a license can view and use all their current Community Analyst content (including projects, custom data, infographics, and report templates) within Business Analyst. Furthermore, we have designed an onboarding experience to ease the transition and assist users in discovering the exclusive features offered solely in the Business Analyst Web App.
For further details, refer to Deprecation Notice for ArcGIS Community Analyst: Transition to ArcGIS Business Analyst Web App.
Additional Resources
We’re so happy to share this release of ArcGIS Business Analyst Web App with you! Below you can find additional links that you may find useful.
- Business Analyst product overview page
- Review pricing and purchase Business Analyst
- Join our LinkedIn Business Analyst User Group
- Join our Business Analyst Esri Community
- Follow our weekly #BATipsandTricks posts on social media
- Read more Business Analyst blog articles on ArcGIS Blog
- Watch Business Analyst Web App videos
- Watch Business Analyst Mobile App videos
- Visit the Business Analyst Resources page
- Visit the Community Analyst Resources page

Article Discussion: