If you attended or streamed the plenary sessions at Esri’s 2024 User Conference, you may be familiar with the capabilities of ArcGIS Business Analyst Web App’s AI assistant. Plenary presenter Jess Altamira demonstrated Business Analyst Assistant (Beta)’s range of interactive capabilities, including mapping points of interest and creating color-coded maps, with a timely use case: learning more about the popular sport of pickleball.
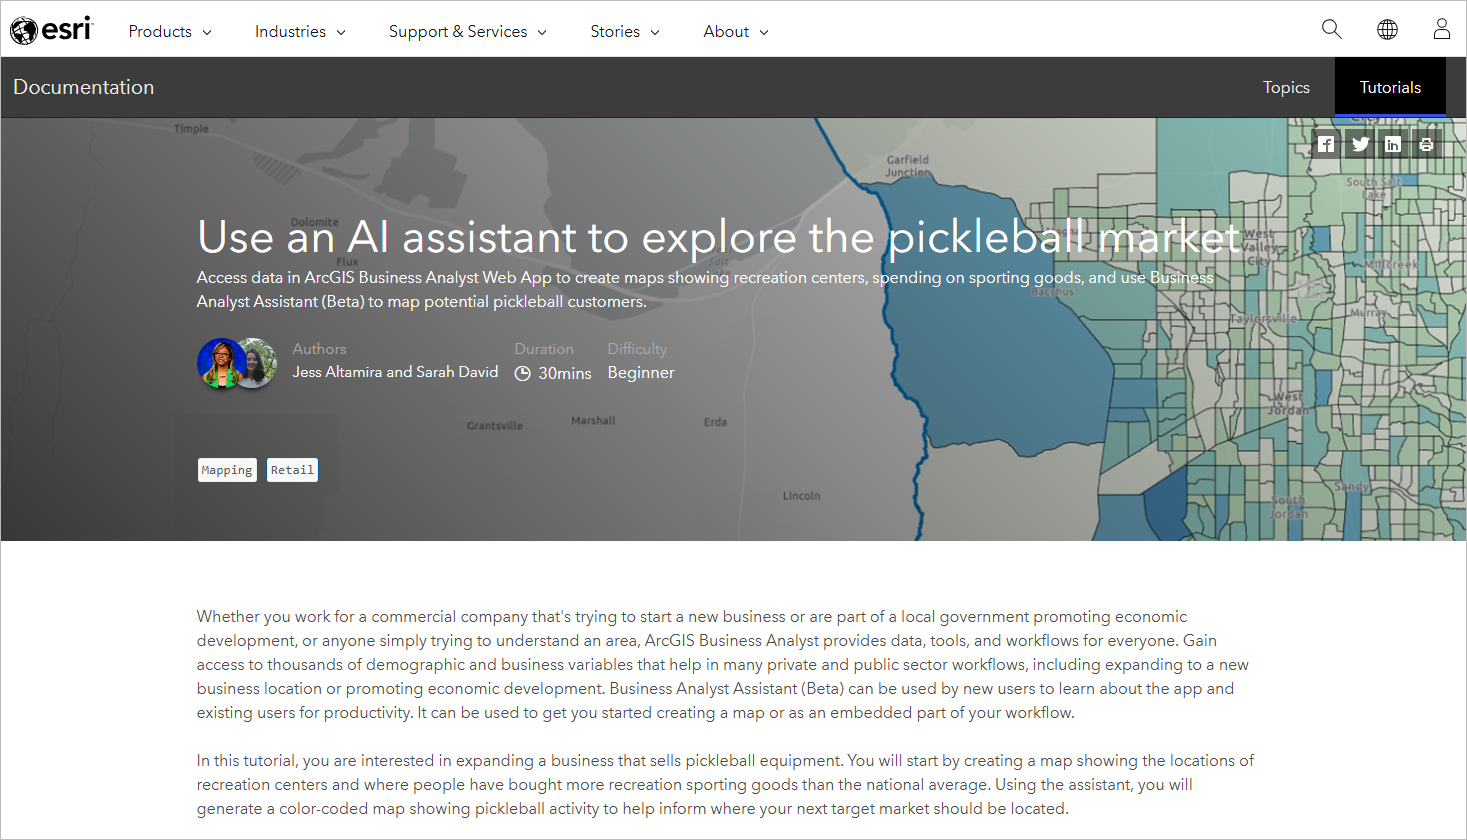
Now you can perform this workflow yourself by following the newly published Esri tutorial, Use an AI assistant to explore the pickleball market. Read on for some background on Business Analyst’s approach to AI and an overview of the new tutorial.
AI comes to Business Analyst
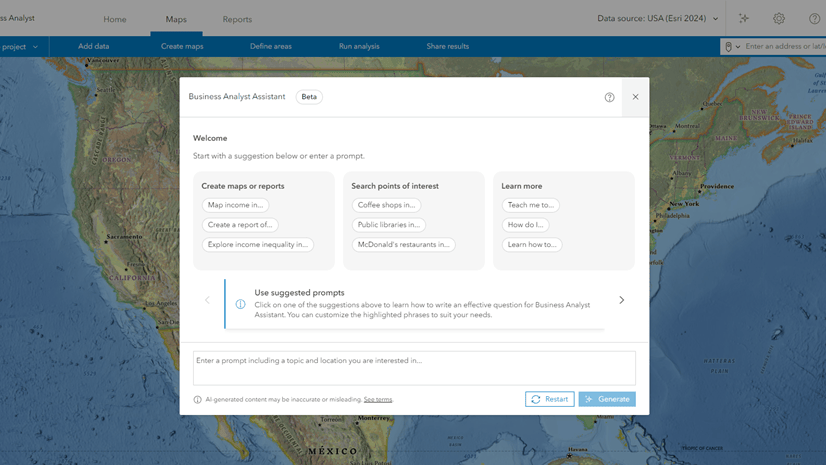
Business Analyst Assistant (Beta) is an in-app productivity tool that uses artificial intelligence to recommend popular workflows, data, infographic reports, and tips. Business Analyst Assistant (Beta) helps new users learn about the app, and guides existing users in increasing their productivity.
The assistant can help you with tasks related to the following capabilities: running infographics, using points of interest search, creating color-coded maps, using smart map search, and creating point-based sites with buffers. It also shares tips, which provide guidance on performing workflows (similar to taking a guided tour).
Why pickleball?
If you live near a pickleball court, it won’t be news to you that it is one of the fastest-growing sports in the United States. From the cornfields of Iowa to the yard at San Quentin, courts are springing up and the pickleball industry expands accordingly.
Data on pickleball was one of the most-requested datasets for Business Analyst in recent years, and Esri’s Market Potential dataset now features Behaviors data reflecting participation in pickleball in the last twelve months.
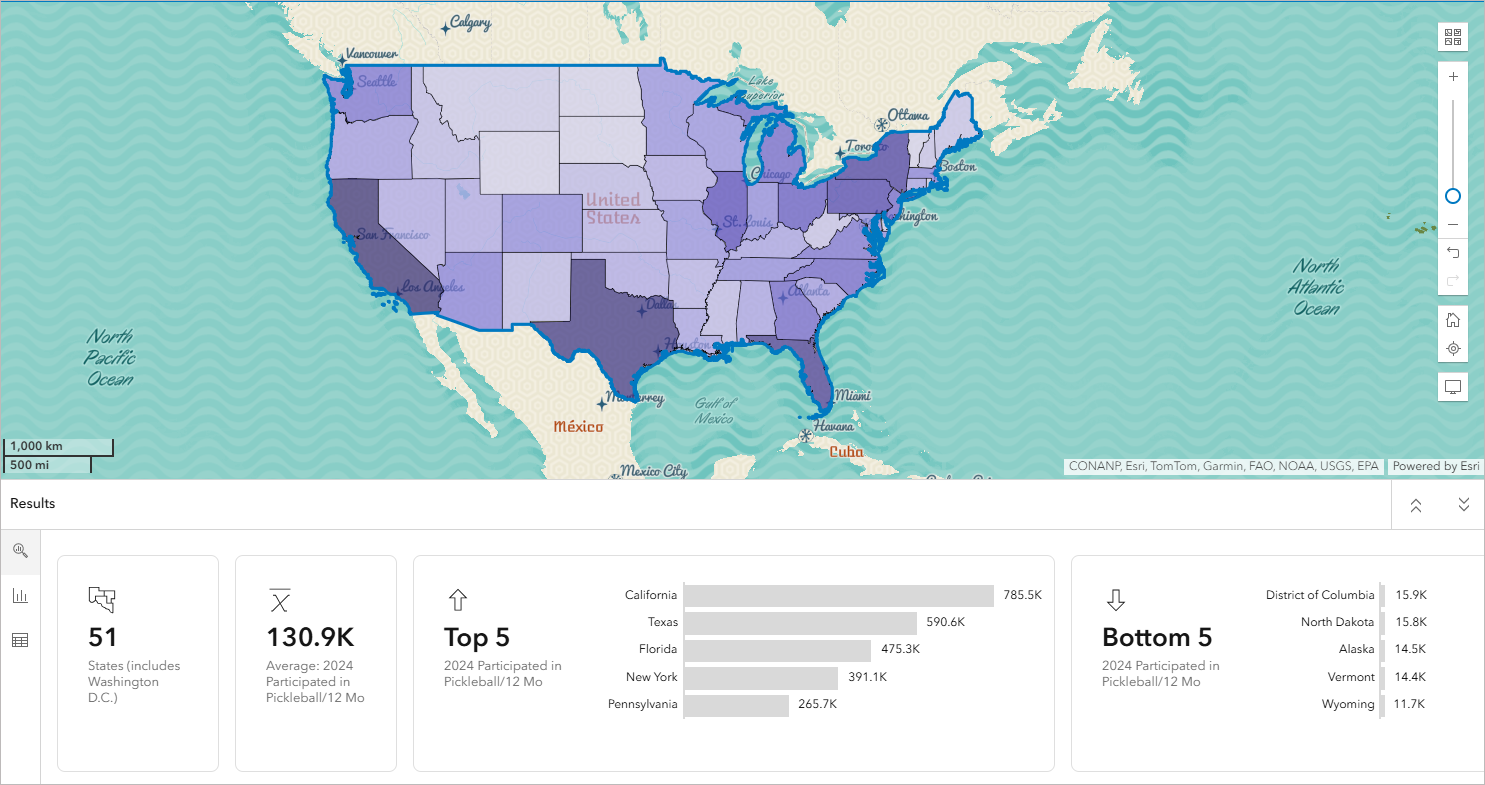
Check out the tutorial
In this new tutorial, we use Business Analyst Web App to analyze where a pickleball equipment business can expand.
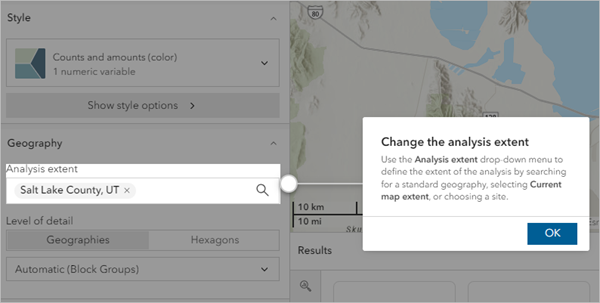
Start by creating a map to show the locations of recreation centers and where people have bought more recreation sporting goods than the national average. We can use the Select geography tool to add our site to the map, then add points of interest (POI) identifying recreation centers. To enrich the places on the map, we add consumer behavior data using a color-coded map.
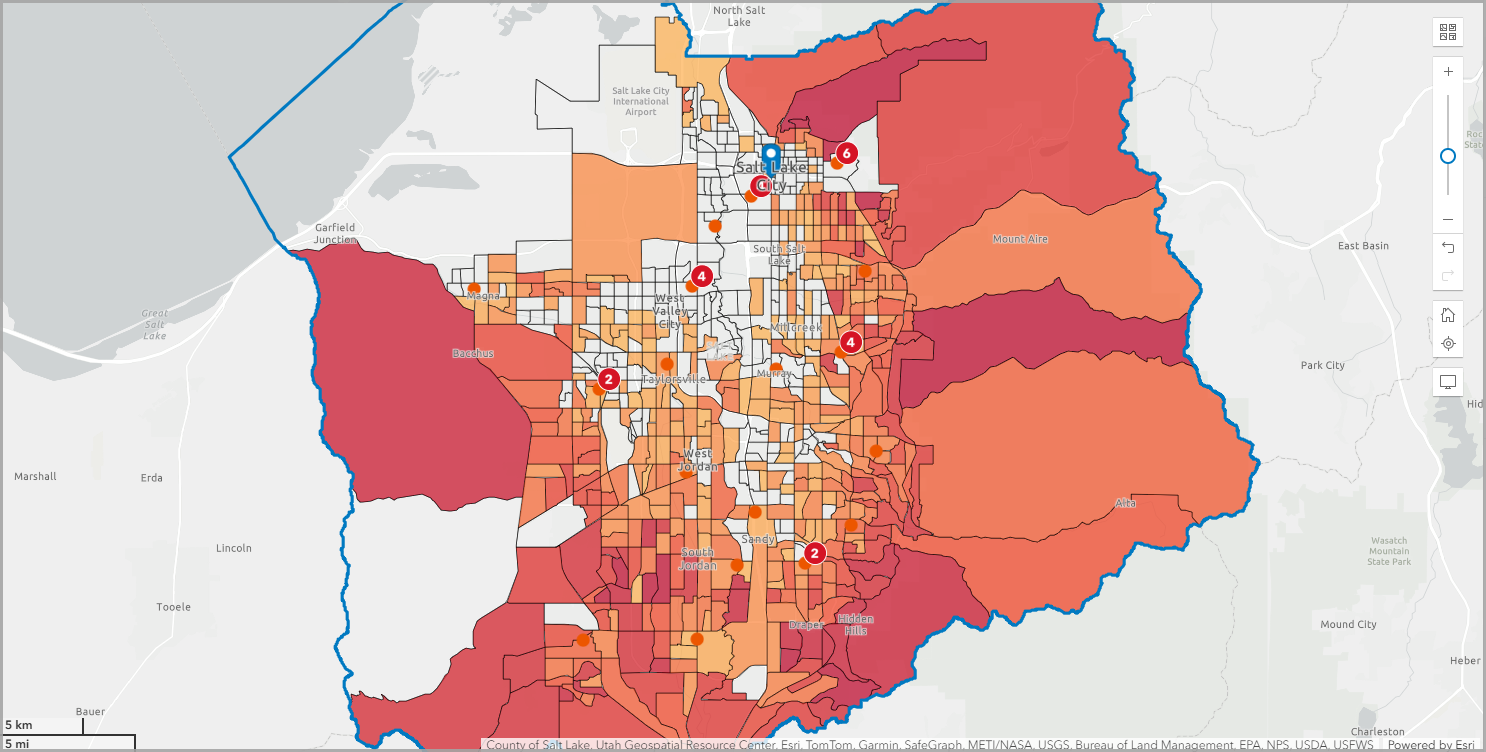
Next, we can explore the demand for pickleball in our area using Business Analyst Assistant (Beta) recommendations. We can enter a prompt to request a map of people who have played pickleball in the past year within the area of interest.
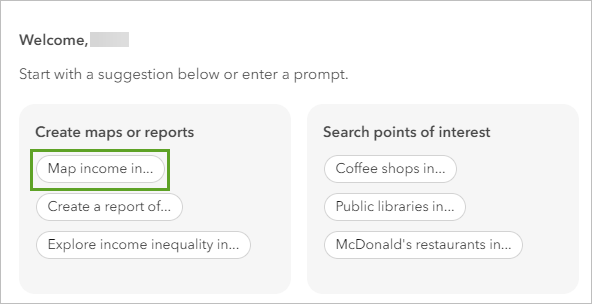
Business Analyst Assistant (Beta) provides recommendations, from which we can create a color-coded map. We can use tips to explore the results and make modifications to the map.
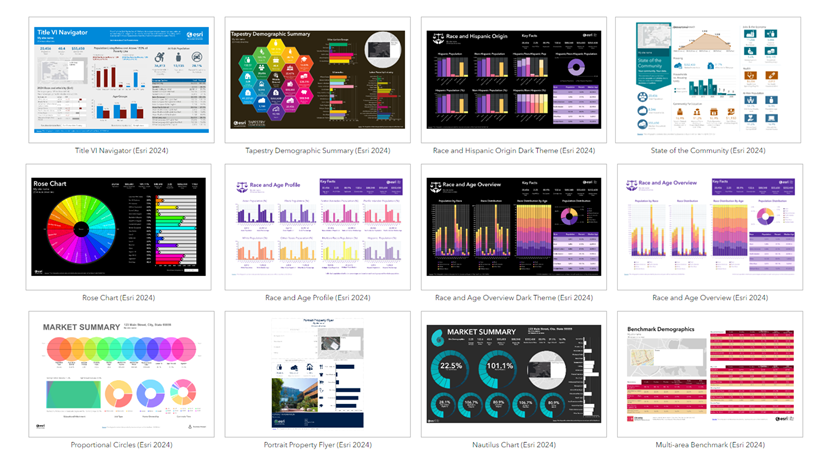
To complete our analysis, we can generate an infographic with information specific to spending behavior on recreational goods and recreational activity.

To view the full tutorial, be sure to check out Use an AI assistant to explore the pickleball market.




Article Discussion: