In previous articles, I discussed the methods used to create customer-derived trade areas (CDTAs), explored several advanced options and use cases, while also discussing how to use density-based cluster analysis to refine the customer set used in creating trade areas. In this article, I will continue to expand on more advanced and innovative uses of CDTAs in topics such as site prospecting, customer behavior analysis, and estimating market potential or loss. To do this, I will combine ArcGIS Business Analyst Pro’s Generate Grids and Hexagons tool, using centroid creation and GeoEnrichment to generate a new set of points that act as a probability surface. You can use this surface as a model of opportunity or need, allowing it to act as a set of optimized “archetype” customers against which to evaluate customer interactions, opportunities, and engagements.
Substituting demographic-based centroids for customer points
Customer-derived trade areas are enclosures around a set of points, usually representing customers, that are delineated by a set tolerance (such as a proportion of the points) or a specific weight (such as sales or another condition of interest). Although they’re called “customer-derived trade areas,” the same workflow could be used to analyze data not tied to “customers”: how 911 calls are distributed around first responder sites, how school districts match resources to their pupil enrollment, or how insurance claims may best be prioritized based on aid centers. There are applications for CDTAs in environmental and ecological analysis, healthcare, government, utilities, and every industry that uses spatial analysis.
Throughout the following sections, I am going to replace customer points with a set of regular Uber H3 hexagon centroids. Why would an ArcGIS Business Analyst Pro user need to do that? One scenario, which is common in retail analysis, is to model the potential for a new store. You don’t have existing customers for a new store, but you do have ideas of the market potential. So in this analysis, I am going to use hexagons that are a quarter of a mile in area and enrich them with a custom market potential calculation. For a pediatric hospital or pharmacy, that potential could be modeled using age breakdowns and population statistics, while for a transit agency it might be commute characteristics. The points represent an archetypal surface of potential, demand, or need mentioned in my introduction.
I used the Generate Grids and Hexagons geoprocessing tool in Business Analyst Pro to generate them, enriching each centroid with the specific attributes I want in my model. The result is an estimation of the sales potential for each location based on the characteristics of my existing customer base.
In the screenshot below, I have symbolized the land-based centroids, that have been enriched with both population and spending variables. Places with high spending potential are shown in green, transitioning to purple where there is low potential. Areas without centroids are places where either spending or population are zero.

The map illustrates potential target markets, with a concentration of green centroids, that closely match the archetypal (desired) customer audience. Most of the audience are in more rural locations to the northeast but in the Bay Area itself, close to the store, San Jose stands out, as well as San Leandro and the communities around Berkeley.
My CDTA analysis will use this market opportunity point layer instead of customers.
Creating market potential thresholds
One area that CDTA excels at is turning market opportunity surfaces into quantitative insights showing how much market could be captured and how well an organization’s locations are performing compared to that potential. In the screenshot below, I have created four trade areas using the detailed method, which represent increasingly large potential markets. Each ring shows ten percent of the available opportunity moving out from the store.
I have simplified the symbology of the centroids and colored each opportunity ring from red to blue. The first ten percent of market opportunity that the store could capture, shown in red, is within 21 miles of the store. Ten to twenty percent of the opportunity (yellow) is within the next ten miles, ending at the 31-mile mark. This means that the same market capture opportunity exists within half the geometric distance. The thirtieth and fortieth percentile occur at 38 and 45 miles, respectively. Statistically, this means that half the opportunity is within 31 miles, but the next half is within half the distance to the store, an additional 15 miles.
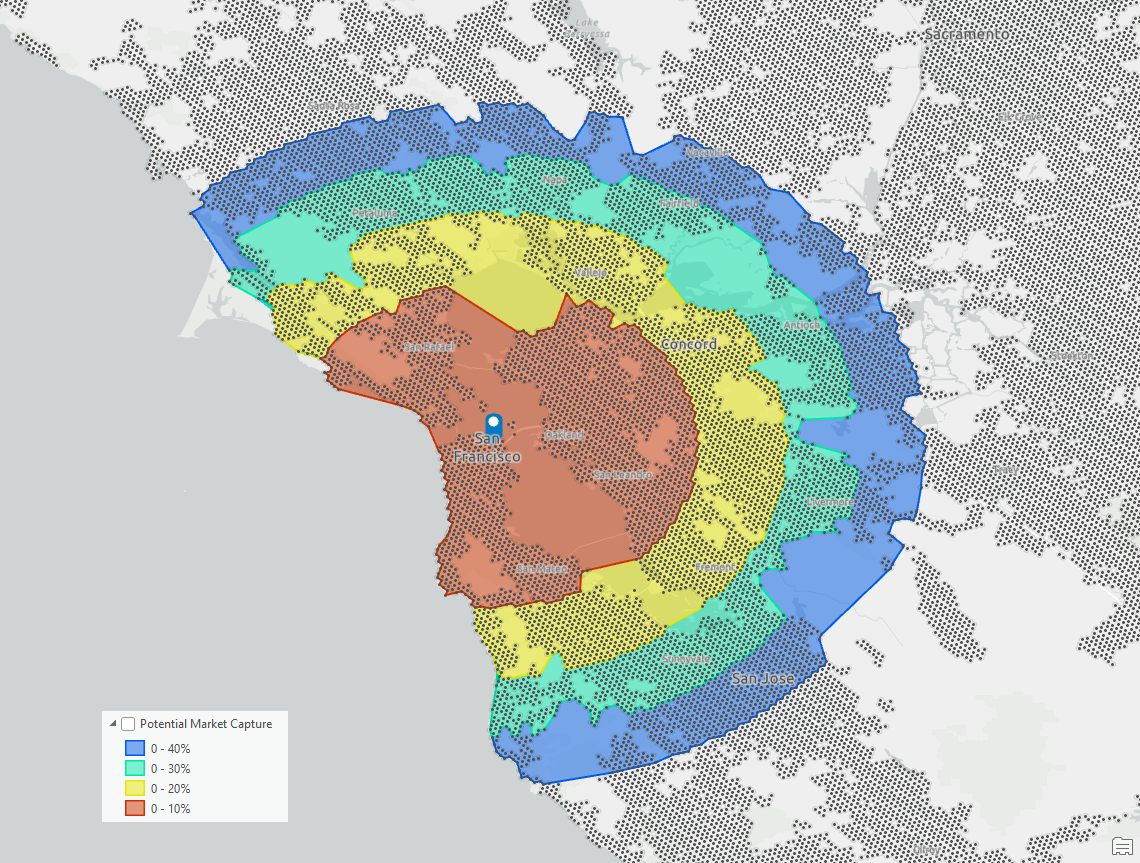
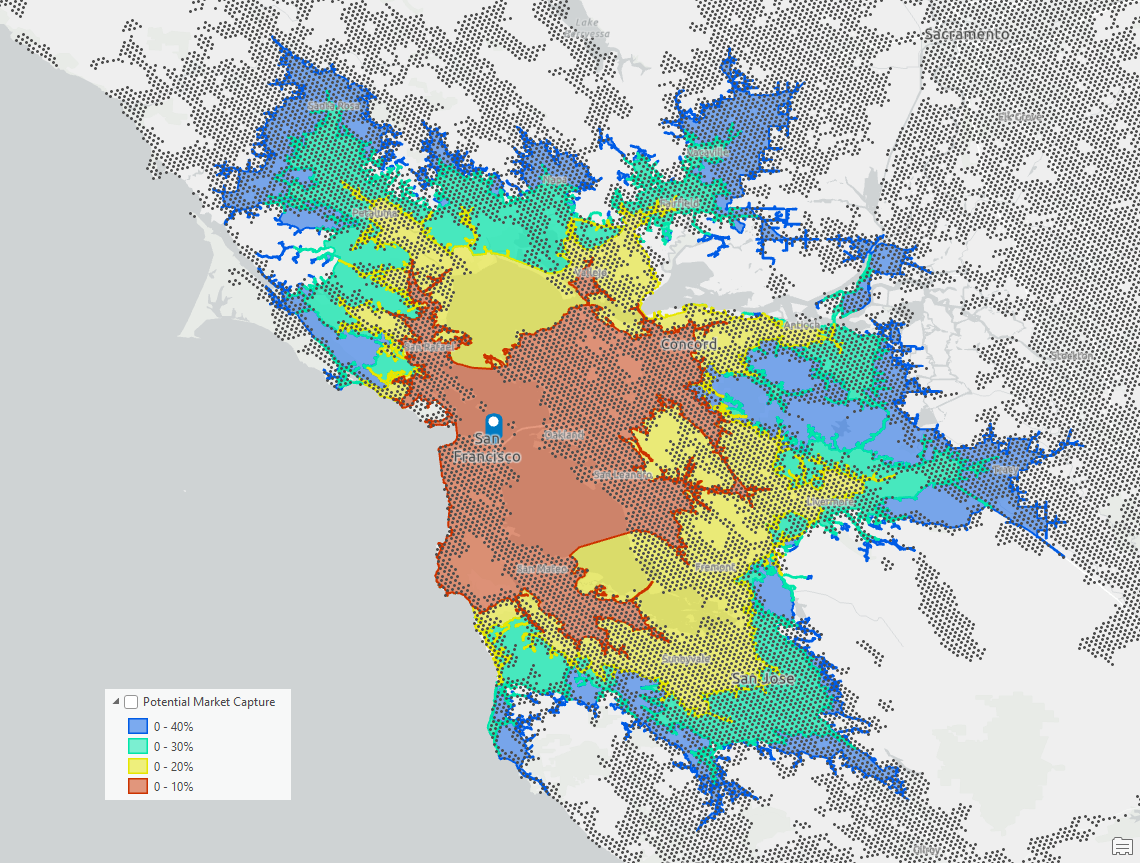
Using the detailed method, the CDTAs appear like concentric rings that are not representative of how customers would travel to the store. The drive times method, shown in the next screenshot, generates a more realistic set of CDTAs that emphasize how population centers influence market reach and potential opportunity capture, because they are representative of the time taken to reach the store, not simple distances.
The two methods diverge because of the underlying set of candidate locations—one using potential or probability of sales, and the other using actual customer data. As a result, we see strong differences in the underlying pattern of the factor that weights how the CDTA is formed and how it is clustered. Using the detailed method, the capture grows equally in all directions, while drive times use the road network which is dependent on speed limits, road density, functions, and barriers.
On a hexagon centroid grid, all points are equally spaced and so growing out in any direction by the same percentage can capture similar amounts of opportunity. The difference in the capture rate is a function of the individual centroid value and the absence of points around it. When using drive times rather than “as the crow flies” or geometric distance, the growth can only happen along specific segments and in a specific direction. Nearby points may be geographically close but farther away when using the road network.
The drive-time model emphasizes unpopulated areas and routes that reach into new areas, especially the northern and southern Bay communities. The pattern is much more dendritic and irregular. Following the major road network forces this method to aggregate nearby points of opportunity, which in the real world represent connected communities and towns. For a business, the drive-time-based CDTA provides a much more lifelike and functional view of where the opportunity is, how much can be reached at progressive distances, and how far customers living in those capture zones will need to travel to reach the store or location.
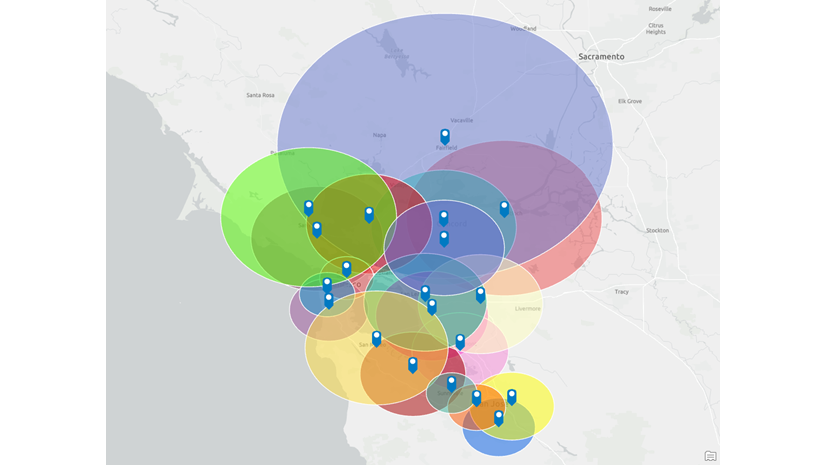
If a business wanted to expand this work and the models that underpin it, they could use multiple locations, such as their own store network and/or competitors. This would better quantify the potential capture and loss rates from a store to competitors or their own store cannibalizations. I’ve worked with companies and organizations who have applied the same techniques to the optimize their outlet, store, and site planning strategy. For example, I’ve helped organizations identify where they would accept same-brand cannibalization to protect their own stores from competitors despite the cannibalization. These techniques can also help with expansion, closure, and relocation strategies, allowing multi-dimensional models to be built, and simulations or what-ifs to be assessed. The result is actionable, intelligent, and pragmatic solutions to the issues and needs that the business is facing based on quantitative information, accurate impact assessments, and clearly identified consequences.
Assessing market share, loss, and capture
Many retailers apply the ideas I have discussed above into understanding the relationship between distance and purchasing behaviors as well as frequency and size of basket—aka spending behaviors. The same principles—how a user engages with a location, how frequently, and for what purposes—are applicable to many industries and scenarios. CDTAs can be a powerful asset that aids understanding of the size of unrealized opportunity or need as well as user behavior.
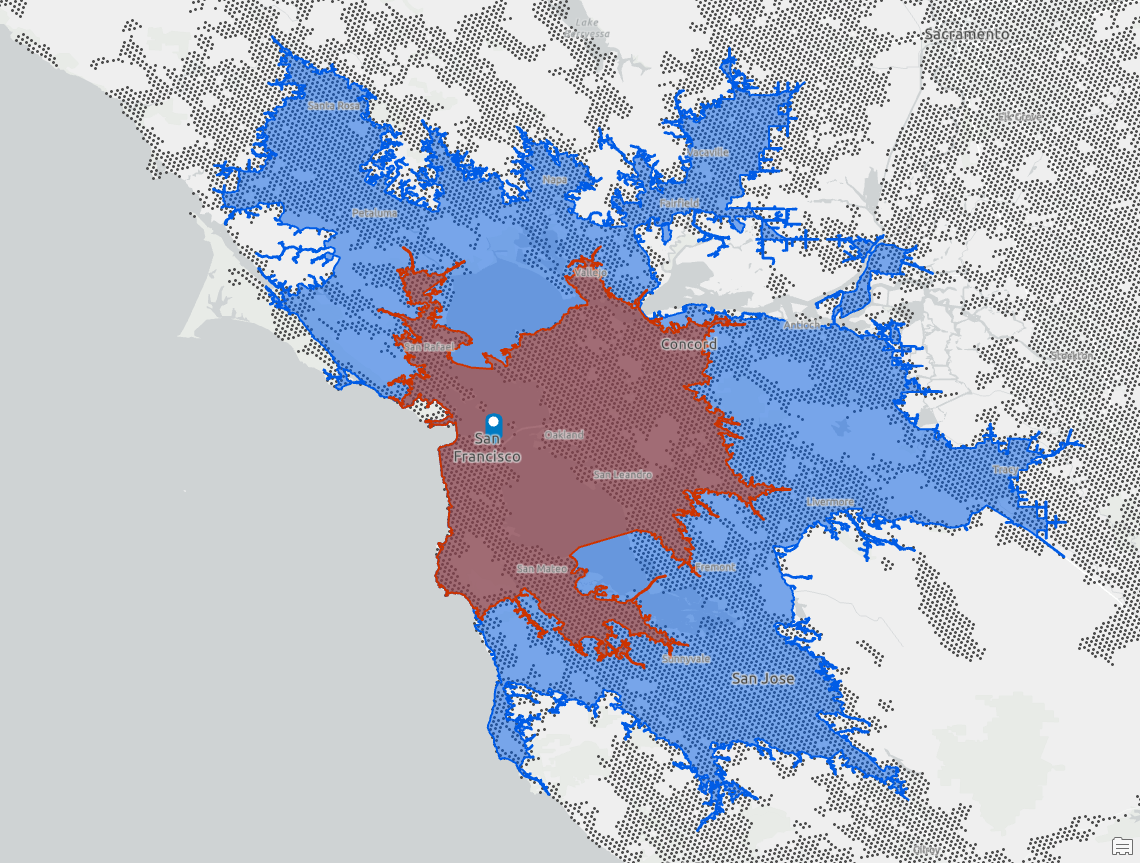
In the example below, the smaller drive time represents forty percent of the customer base according to their purchase behavior and annual spending. The larger drive time is the same forty percent, but now maps the extent of market potential. The red area is the intersection of the two different views: actual customer capture versus market potential. The blue area in the larger drive time area is the unrealized market and identifies target towns and neighborhoods.
Within this unrealized market are potential growth locations that could help prioritize an expansion strategy when combined with an understanding of the specific growth targets and the opportunity that could be realized. With this Bay Area scenario, I would advise the company to focus on San Jose, which has both a well-clustered set of customers, shown by the purple trade area, and a significant amount of contiguous market opportunity when compared to other potential expansion sites. The more you look at this map, the more you can identify different scenarios for the retailer.
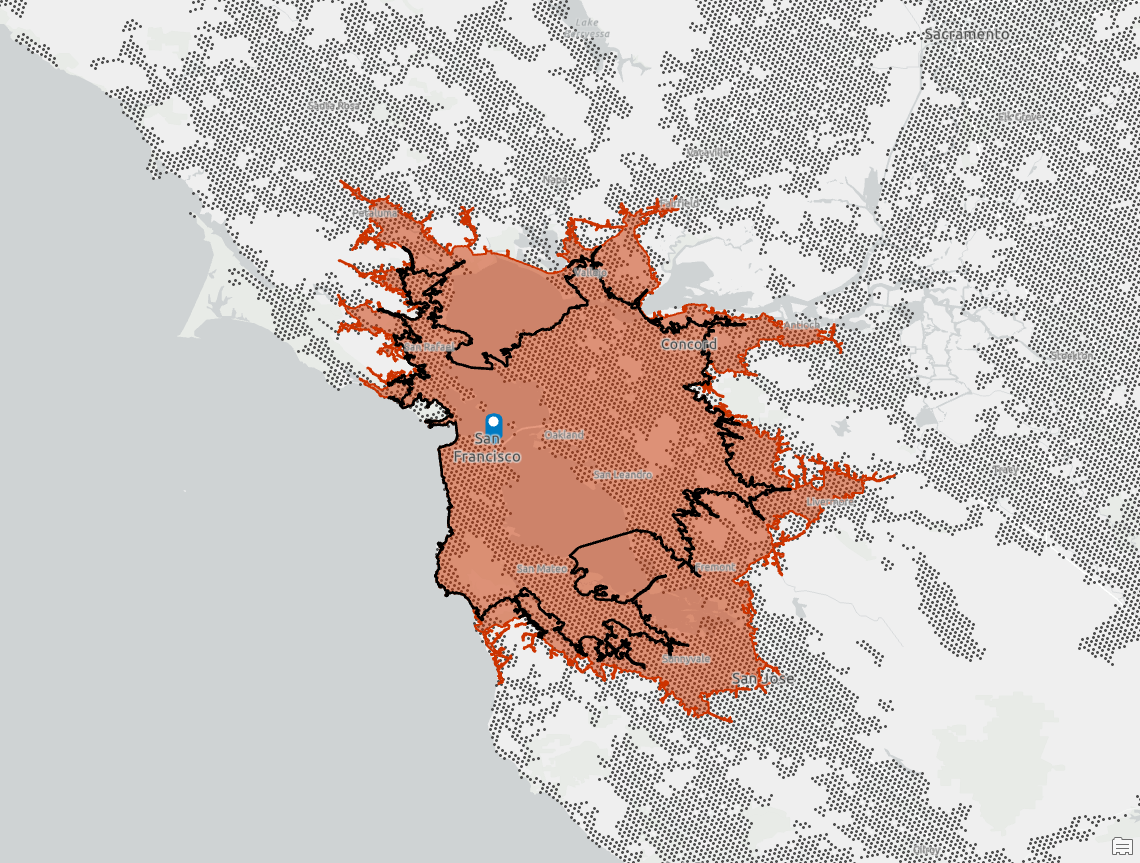
Similarly, we can compare customer-focused CDTAs with ones that map potential. Below I have used the same forty percent of customer sales (shown in black) and overlaid it with the twenty percent market opportunity drive time. These suggest that the store is capturing less than half of the market potential because the two trade areas are of similar size. In fact, the market opportunity isochrone, which mirrors the forty percent of customers, is 16%. This means the store is capturing 2.5 times less than the market opportunity. That difference may be being lost to competition or yet-to-be-activated customers who haven’t engaged with the store or brand.
Better estimation of true trade areas and customer capture
As I’ve discussed, hexagons and their centroids provide a valuable mechanism to better understand the opportunity within an existing customer base. They can also be used to assess the market potential for a new site. In the example below, I have overlaid and selected just the hexagons that fall within the detailed trade area for the original sixty-five percent of customers visiting the store.
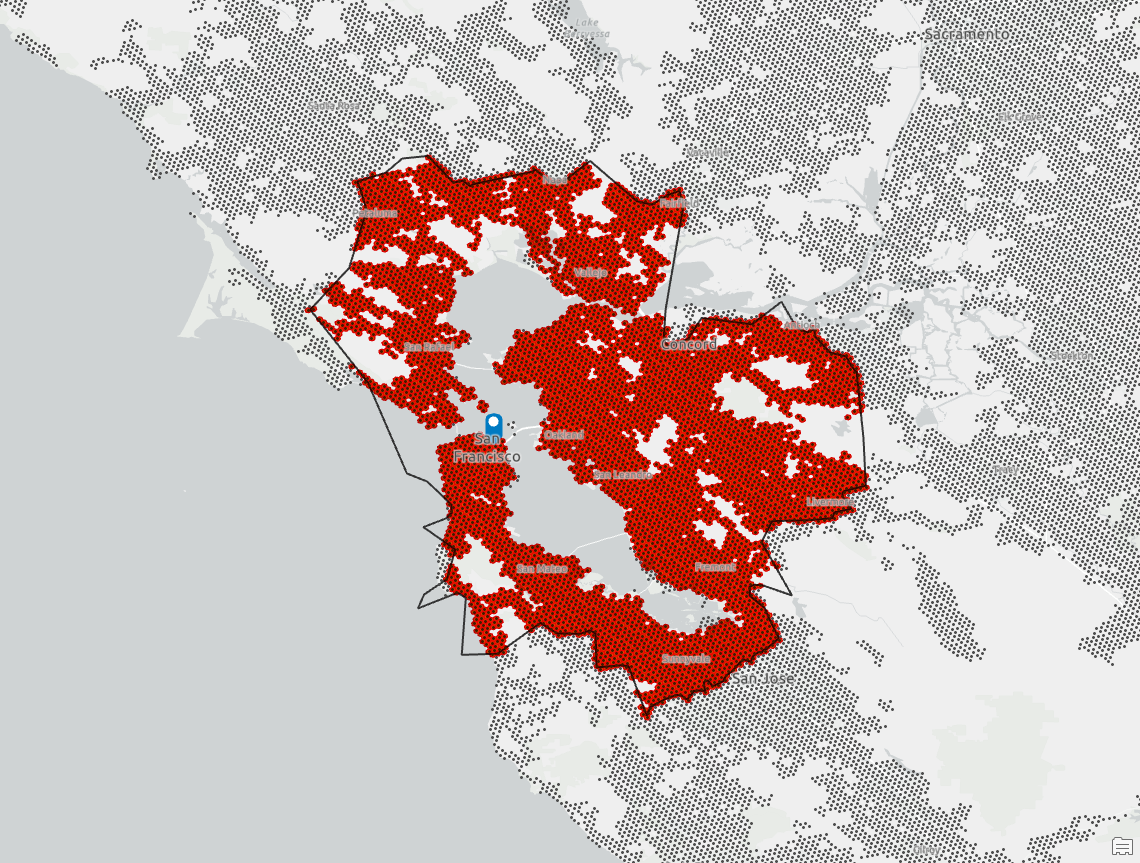
You can immediately see how using detailed hexagons can create greater understanding of the distribution of market potential, including unpopulated and low-opportunity locations. Large areas of the market to the east and north are not populated, while the South Bay is rich in potential. This derived CDTA further helps explain and explore the geographic patterns and location-based influences on customer and store interactions. Hexagons help create a more realistic and nuanced picture of how customers and opportunity exist in the context of a new store.
Creating hexagon-based customer-derived trade areas
Finally, I want to discuss how we can link the Generate Customer Derived Trade Areas tool with Generate Grids and Hexagons in Business Analyst Pro using ModelBuilder, Arcpy, or Python notebooks. The output of performing customer-derived trade area analysis can be the input into the area of interest in Generate Grids and Hexagons. In the examples below, I have used the same detailed 65 percent of customers CDTA as shown above and created multiple versions of hexagons that fall within it, across four different scales.
You can see how closely the level 7 and 8 hexagons follow the outline of the CDTA. Level 6 is a good approximation of the CDTA that removes many of the internal indentations and offers a more organic, smoothed shape. Level 5 could be dissolved to create an outline that is essentially the CDTA plus an approximate 5-7 mile buffer.
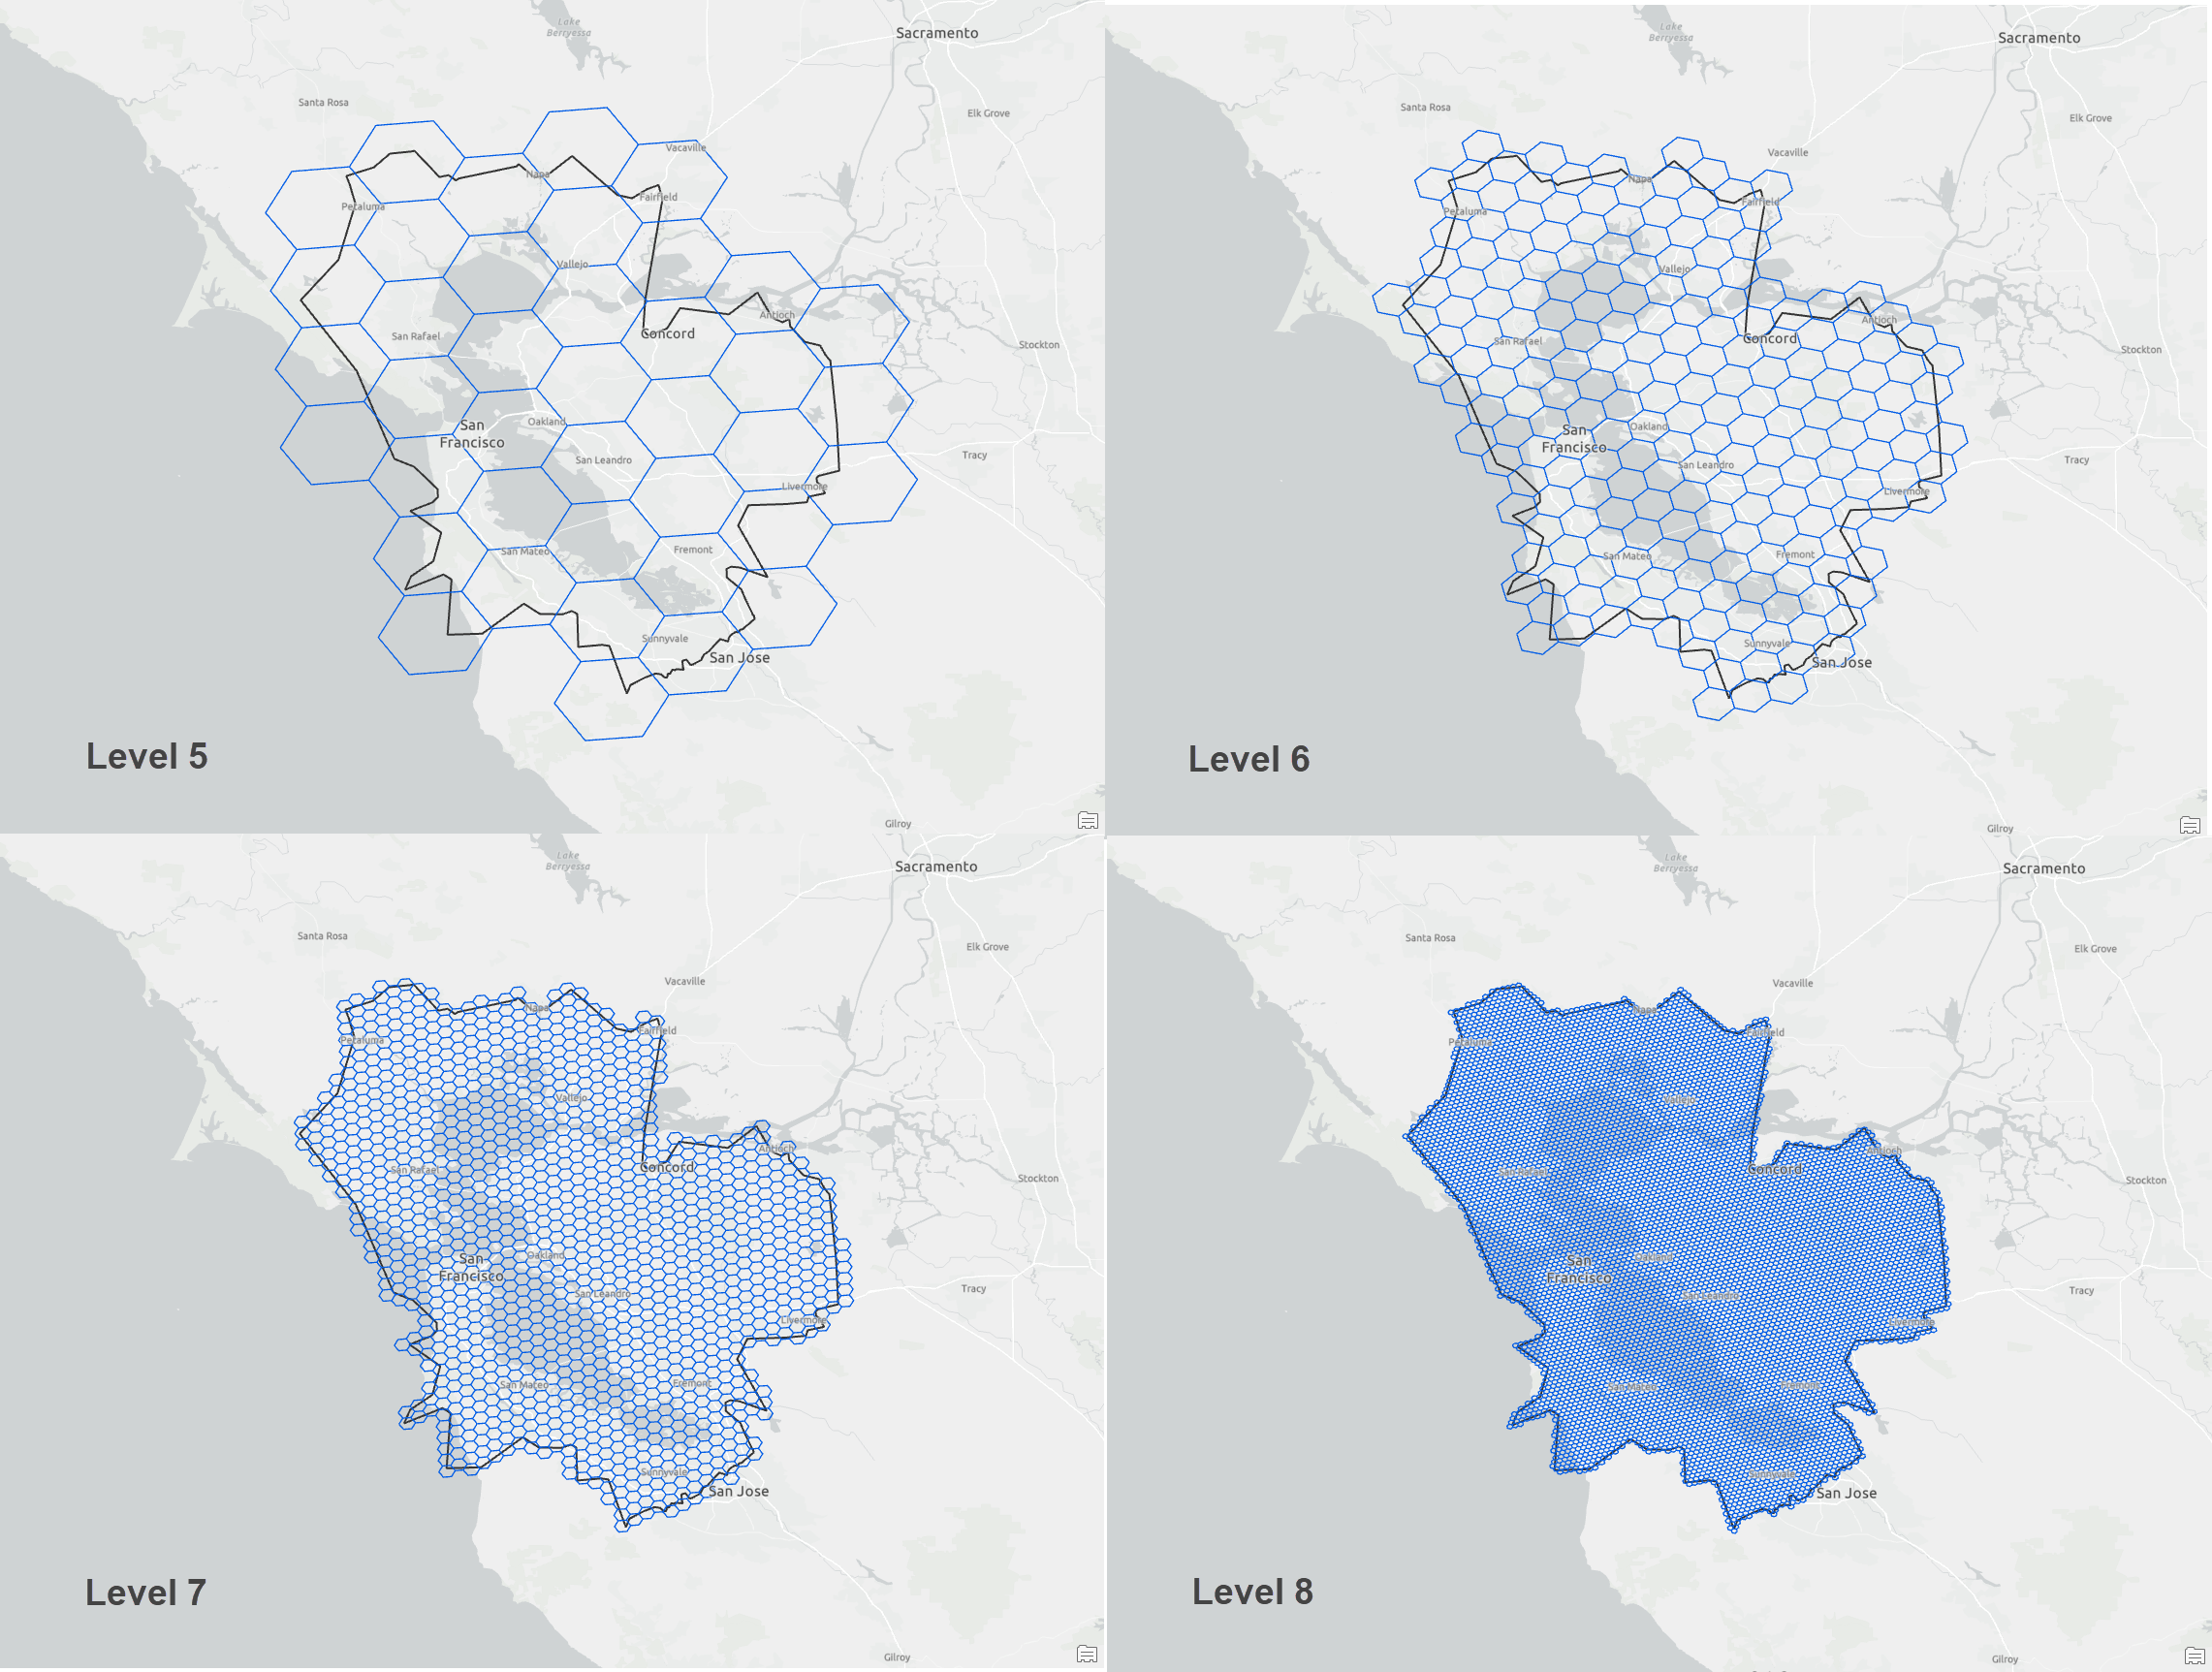
Each of these scales of hexagons offers unique and interesting opportunities for further analysis into where opportunity lies. I particularly like hexagon representations because, unlike traditional formal geographies such as census tracts or block groups, the size of a hexagon is constant so the only thing that varies across the geographic space is the underlying distribution of the demographics and market opportunity. When comparing potential markets defined by a fixed-size hexagons, I know that the inputs to my models are constant and that the variations in geography type and size will have less impact.
Closing thoughts
Over the course of these three articles, I’ve explored a lot of the detailed use cases for CDTAs and exposed you to some of the ways I combine point-derived trade areas in both ArcGIS Business Analyst Pro and ArcGIS Pro.
In doing so, I continue to come up with new ideas, discovering new use cases and innovative applications working alone and with customers. Those influence our software development strategy. The Business Analyst team continues to explore enhancements and new capabilities via research, industry experience, and user feedback. If you have comments and ideas, we’re happy to connect with you and if you find these examples helpful, let me know.


Article Discussion: