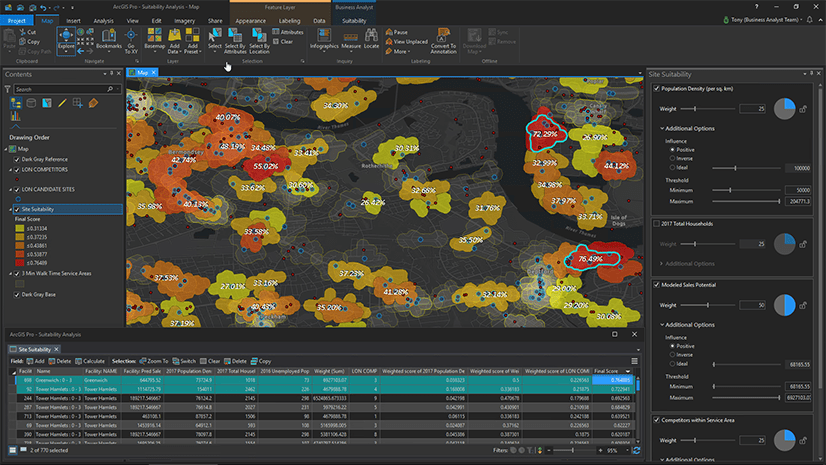
Ever since joining the ArcGIS Business Analyst team, I’ve heard variations of one question, many times– “Can I access POI data in the Business Analyst Web App?” Or, simply put, “Can I locate competitor and companion businesses in my trade area?” Usually, questions like these come up after I’ve shown a demo highlighting how to create custom infographics, color-coded maps, or even how to do a suitability analysis for a “potential new business location.” One of the greatest rewards for a product marketer is the look in the person’s eye after I answer their question with, “Yes, yes you can.”
Let’s take a step back to discuss what POI data is. POIs (points-of-interest) are a collection of geographic points that can be referenced for many kinds of analysis. These points can range from things like business locations, tourist attractions, post offices, churches, schools, parks, or even things like speed cameras.

But POI data isn’t just made up of these points. POIs can also provide context around points. For instance, SafeGraph, an Esri partner, has a POI dataset called SafeGraph Places that includes information about the brand and brand category, location names, and other identifying features for millions of POIs.
Understanding how POI data can be used with Business Analyst is powerful. For instance, let’s imagine that I’m looking to open another location for my rapidly growing organic juice and smoothie business. This business is largely dependent on nearby complementary businesses, so naturally, I would like to look for points of interest like fitness centers, yoga studios, or even shopping malls within close proximity to a potential location.

A Free POI Add-On for ArcGIS Business Analyst
Right “out of the box” there are business locations and summary data sourced from Infogroup included in the Business Analyst Web App. But of course, when it comes to data, the more the better. That’s where SafeGraph has come to help.
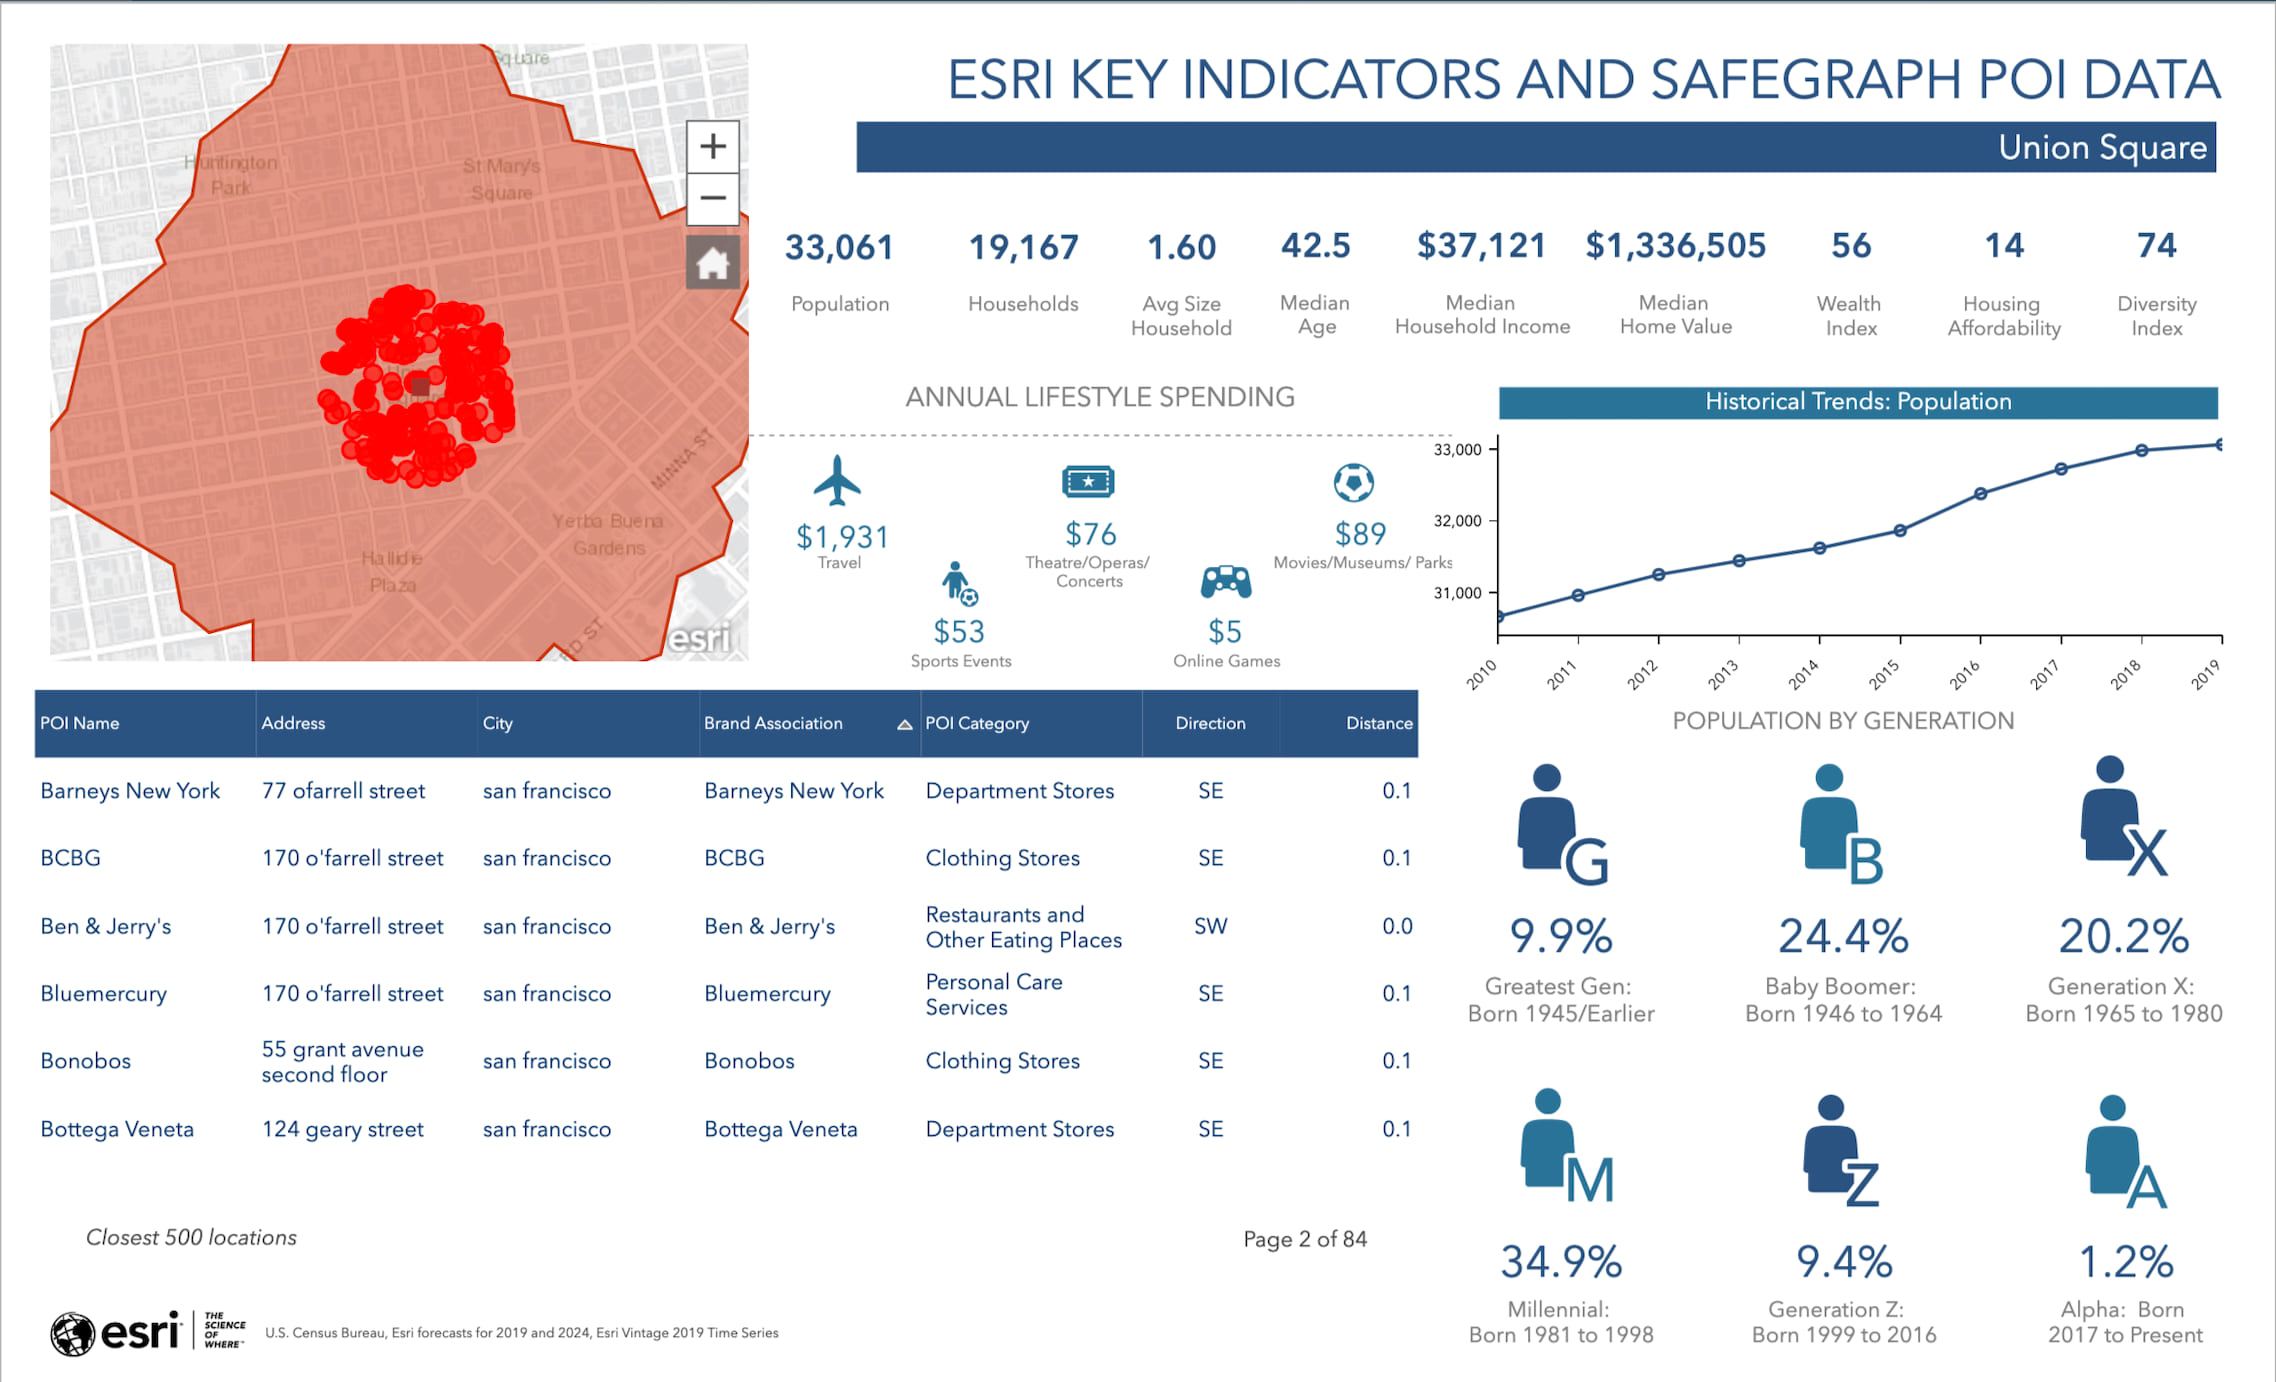
SafeGraph is a data company that unlocks information in POI data. With SafeGraph Places for ArcGIS, a free data addon for the Business Analyst Web App, users can access and visualize data about points of interest and business listings in the US. This dataset has roughly five million points-of-interest, updated monthly. The POIs are represented as point data to enable GIS use cases and include information like location name, address, and brand association. For users interested in richer data about their places of interest, such as building footprints and foot-traffic patterns, you can learn more at the SafeGraph Data Bar.

Adding SafeGraph POI Data to the
ArcGIS Business Analyst Web App
Getting up-and-running with SafeGraph Places in the ArcGIS Business Analyst Web App is simple. Here’s how to do it:
1.) Sign into the ArcGIS Marketplace here.
2.) License SafeGraph’s POI data from the ArcGIS Marketplace by clicking the “Get it now” button on the SafeGraph Places listing. You’ll need to share access to SafeGraph Places to members of your group. For detailed steps to do that, follow this guide.
3.) Log in to the ArcGIS Business Analyst Web App and choose a new or existing project, then follow these steps:
- Navigate to the Reports tab
- Build Infographics
- Choose the Nearby Restaurants template
- Hover over the table on the left and click “Replace”
- Choose “Nearby”
- Choose “Browse for a layer on ArcGIS”
- Find the SafeGraph Places layer from step two (2.) above and click “Add”
- Select which attributes, filters, and method to display the results in the table.
- Save the template with a new name.
4.) Go to the Maps and create a new site by either searching for an address or dropping a pin.
5.) Create rings or drive time around the site you just created.
6.) Click “Infographics” in the site pop-up and choose the template saved in step three (3.).

Resources for ArcGIS Business Analyst
We’re so happy that you’re exploring how to add Esri partner data to ArcGIS Business Analyst. Below you can find some useful links for ArcGIS Business Analyst and SafeGraph Places for ArcGIS:
- Business Analyst product overview page
- SafeGraph Places on the ArcGIS Marketplace
- Business Analyst resources page
- LinkedIn user group
- Business Analyst YouTube playlist
- Business Analyst GeoNet community
- Business Analyst Web App login page
- Business Analyst help and documentation pages
- Email the team: businessanalyst@esri.com


Commenting is not enabled for this article.